EURCHF: One of The Clearest Manipulations We’ve SeenEURCHF -One of The Clearest Manipulations We’ve Seen
This is one of the clearest manipulations we’ve seen… EUCHF is printing a new historical low at 0.9181 for now without any logical reason behind it.
Price has never been in this area in his entire life.
There’s no major market news event to ju
Related currencies

EURCHF – Outlook for the Coming Month1. Monthly View
On the monthly timeframe, the overall structure is still bearish, but there’s room for a potential bullish shift. The major liquidity resting at the previous lowest point—formed in November 2024—has already been swept. With that liquidity taken, the market now has the space to push

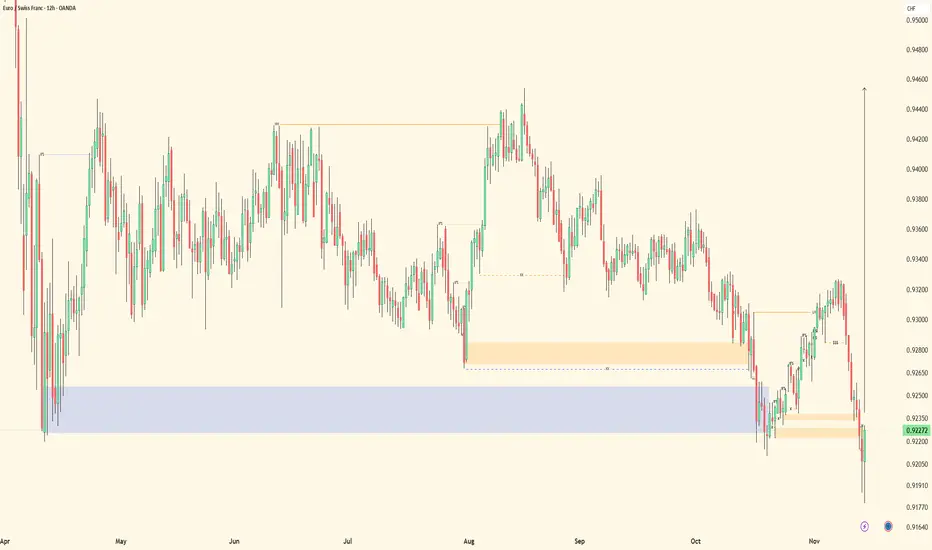
EURCHF: Another Selling Opportunity 🇪🇺🇨🇭
EURCHF will most likely drop after a test of a major intraday/daily
resistance cluster.
The pair completed a consolidation on that, forming a local
selling imbalance.
I expect a bearish movement at least to 0.92 level.
❤️Please, support my work with like, thank you!❤️
I am part of Trade Nat

JP Morgan says EURCHF oversold --- Could target 0.96 on rebound?JP Morgan sees the surge in the Swiss franc as not justified. According to JP Morgan, the Eurozone economy is holding up better than markets had anticipated. Under this environment, JP Morgan believes the current EUR/CHF levels present an opportunity to fade franc strength and rebuild long positions

Eurchf at resistance short Eurchf has pulled back up to resistance level and big fall possible from here again let us see how it plays out

EUR/CHFAfter a BOS on 4 h create a new LL
we wait for BOS on 1 H create a HH
After take a BUY trade on DEMAND create on 1 H

EURCHF oversold bounce backs capped at 0.9258The EURCHF is currently trading with a bearish bias, aligned with the broader downward trend. Recent price action shows a retest of the support, suggesting a possibility of temporary relief rally within the downtrend.
Key resistance is located at 0.9258, a prior consolidation zone. This level will

EURCHF - HTF/Mid-Term OutlookHTF (4H): Bullish
Strong liquidity sits at 0.92676.
We’ve shifted out of the pullback phase and are now aligned with continuation. Mid-term (30M) internal structure has fully formed, mapped, and refined, giving us the framework for a clean bullish leg.
Price took the identified sell-side liquidity

EURCHF SHORT SETUP ( 20 NOV 2025 )If you have doubt on our trades you can test in demo.
OANDA:EURCHF SHORT SETUP
📊 EP: 0.92895
💵 TP: 0.92804
❌ SL: 0.92942
Trade Ideas:
Idea is clearly shown on chart + we have some secret psychologies and tools behind this.
Trade Signal:
I provide trade signals here so follow my account an

See all ideas
Summarizing what the indicators are suggesting.
Oscillators
Neutral
SellBuy
Strong sellStrong buy
Strong sellSellNeutralBuyStrong buy
Oscillators
Neutral
SellBuy
Strong sellStrong buy
Strong sellSellNeutralBuyStrong buy
Summary
Neutral
SellBuy
Strong sellStrong buy
Strong sellSellNeutralBuyStrong buy
Summary
Neutral
SellBuy
Strong sellStrong buy
Strong sellSellNeutralBuyStrong buy
Summary
Neutral
SellBuy
Strong sellStrong buy
Strong sellSellNeutralBuyStrong buy
Moving Averages
Neutral
SellBuy
Strong sellStrong buy
Strong sellSellNeutralBuyStrong buy
Moving Averages
Neutral
SellBuy
Strong sellStrong buy
Strong sellSellNeutralBuyStrong buy
Displays a symbol's price movements over previous years to identify recurring trends.
Frequently Asked Questions
The current rate of CHFEUR is 1.0740 EUR — it has decreased by −0.19% in the past 24 hours. See more of CHFEUR rate dynamics on the detailed chart.
The value of the CHFEUR pair is quoted as 1 CHF per x EUR. For example, if the pair is trading at 1.50, it means it takes 1.5 EUR to buy 1 CHF.
The term volatility describes the risk related to the changes in an asset's value. CHFEUR has the volatility rating of 0.32%. Track all currencies' changes with our live Forex Heatmap and prepare for markets volatility.
The CHFEUR showed a −0.89% fall over the past week, the month change is a −0.71% fall, and over the last year it has decreased by −0.22%. Track live rate changes on the CHFEUR chart.
Learn how you can make money on rate changes in numerous trading ideas created by our community.
Learn how you can make money on rate changes in numerous trading ideas created by our community.
CHFEUR is a minor currency pair, i.e. a popular pair that is not associated with USD. Such pairs are also called cross currency pairs.
Currencies are usually traded through forex brokers — choose the one that suits your needs and go ahead. You can trade CHFEUR right from TradingView charts — just log in to you broker account. Check out the list of our integrated brokers and find the best one for your needs and strategy.
When deciding to buy or sell currency one should keep in mind many factors including current geopolitical situation, interest rates, and other. But before plunging into a deep research, you can start with CHFEUR technical analysis. The technical rating for the pair is sell today, but don't forget that markets can be very unstable, so don't stop here. According to our 1 week rating the CHFEUR shows the buy signal, and 1 month rating is buy. See more of CHFEUR technicals for a more comprehensive analysis.