How to Use Moving Averages in TradingViewMaster moving averages using TradingView's charting tools in this comprehensive tutorial from Optimus Futures.
Moving averages are among the most versatile technical analysis tools available, helping traders analyze trends, identify overbought/oversold conditions, and create tradeable support and resistance levels.
What You'll Learn:
Understanding moving averages: lagging indicators with multiple applications
Simple moving average basics: calculating price averages over set periods
Key configuration choices: lookback periods, price inputs, and timeframes
How to select optimal lookback periods (like 200-day) for different trading styles
Using different price inputs: close, open, high, or low prices
Applying moving averages across all timeframes from daily to 5-minute charts
Analyzing price relative to moving averages for trend identification
Using 50-day and 200-day moving averages for trend analysis on E-Mini S&P 500
Mean reversion trading: how price tends to return to moving averages
Trend direction analysis using moving average slopes
Famous crossover signals: "Death Cross" and "Golden Cross" explained
Trading moving averages as dynamic support and resistance levels
Advanced moving average types: weighted and exponential moving averages
Applying moving averages to other indicators like MACD and Stochastics
Balancing sensitivity vs. noise when choosing periods
This tutorial may benefit futures traders, swing traders, and technical analysts who want to incorporate moving averages into their trading strategies.
The concepts covered could help you identify trend direction, potential reversal points, and dynamic trading levels across multiple timeframes.
Learn more about futures trading with TradingView:
optimusfutures.com
Disclaimer:
There is a substantial risk of loss in futures trading. Past performance is not indicative of future results. Please trade only with risk capital. We are not responsible for any third-party links, comments, or content shared on TradingView. Any opinions, links, or messages posted by users on TradingView do not represent our views or recommendations. Please exercise your own judgment and due diligence when engaging with any external content or user commentary.
This video represents the opinion of Optimus Futures and is intended for educational purposes only. Chart interpretations are presented solely to illustrate objective technical concepts and should not be viewed as predictive of future market behavior. In our opinion, charts are analytical tools—not forecasting
SPX500H2026 trade ideas

ES — Week Ahead (Sep 15–19) — Fundamentals & Key Risk WindowsMacro focus: FOMC (Wed 2:00/2:30 pm ET), plus Retail Sales, Industrial Production, Housing Starts, Jobless Claims, Philly Fed, and LEI.
Calendar (ET):
Tue 9/16
• Retail Sales (Aug) 8:30 — Census schedule confirms Sep 16, 8:30 am release.
• Industrial Production (Aug) 9:15 — G.17 release calendar shows Sep 16 at 9:15 am.
• NAHB Housing Market Index (Sep) 10:00 — NAHB schedule sets Sep 16, 10:00 am.
• FOMC (Day 1) begins — Fed calendar.
Wed 9/17
• Housing Starts/Permits (Aug) 8:30 — Census/HUD note next report Sep 17, 8:30 am.
• FOMC Statement 2:00 / Powell 2:30 — Fed event calendar.
Thu 9/18
• Initial Jobless Claims 8:30 — DOL weekly; last print 263k (spike tied to TX/fraud anomalies).
• Philly Fed (MBOS) 8:30 — 3rd Thu schedule.
• Conference Board LEI 10:00 — next release Sep 18, 10:00 am.
Fri 9/19
• State Employment (Aug) 10:00 — BLS schedule.
• (FYI for next week: Existing Home Sales (Aug) Tue Sep 23, 10:00 am.)
Context to watch:
• Markets widely expect a 25 bp cut at the Sep 16–17 FOMC; path/“dots” and Powell’s tone matter more than the cut size.
• Michigan sentiment (prelim) fell to 55.4 with inflation expectations elevated (1-yr 4.8%, 5-yr 3.9%).
Tomorrow (Mon 9/15) — Trade Plan
Kill-zones (ET): NY AM 09:30–11:00; NY PM 13:30–16:00.
News risk: NAHB 10:00 (size down or wait 2–3m around print)
Long from support 6586 → TP1 6600
• 15m trigger: Rejection at 6586 (close ≥ 6587 after testing ≤ 6585).
• 5m confirm: Higher-low + close ≥ 6588.
• 1m entry: First retest that closes back above 6587.
• Hard SL: 15m wick low − 0.25–0.50.
• TP1: 6600 (book 70%, runner 30% @ BE).
• TP2 (runner): 6606.25.
Short from resistance 6600 → TP1 6586
• 15m trigger: Rejection at 6600 (close < 6596.5 after probing ≥ 6598.5).
• 5m confirm: Lower-high + close < 6596.0.
• 1m entry: First retest that closes back below 6596.5.
• Hard SL: 15m wick high + 0.25–0.50.
• TP1: 6586 (book 70%, runner 30% @ BE).
• TP2 (runner): 6581.50.
Weekly plan—how fundamentals change our timing
• Tue AM (Retail Sales 8:30 / IP 9:15 / HMI 10:00): Expect a more directional NY AM; trade level→level but avoid first prints by ±3–5m.
• Wed (FOMC 2:00/2:30): Treat NY PM as the main event; no positions carried into 1:55–2:35 unless already at TP1 with runner @ BE.
• Thu (Claims/Philly/LEI): 8:30–10:00 stack can create a trend morning; trade acceptance if a 15m body prints through a level.
ES - September 12th - Daily Trade PlanSeptember 12th - 6:15am EST
Yesterday we had great trading conditions, and we have exceeded our weekly targets! I wrote at 5:50am EST in my trade plan the following - (You can see it in the related publication section)
"Overnight low is 6534 and high is 6551 as of writing. We have to remain bullish until proven otherwise, so the targets above at 6567, 6578 and if it really wants it can get to 6592. I have said that the white trend line is a magnet that we are heading towards. We just don't know what route price will take to achieve its targets. We focus on our process and edge to take points out of the market daily."
There were 2 key takeaways from this that I want to point out.
1. 6551 was the overnight session high at time of writing. It also became a key support that took us higher after 9:30am. You can see on the 15 min chart a nice consolidation of price that held until breaking out.
2. My initial targets of 6567, 6578 were met, we blew past the white trend line magnet and then ripped past my target of 6592 and the high of the day was 6600.
6600 on ES & 46,000 on DOW are big round numbers! You should never be bearish when the trend is up, I do think we can be cautious for many reasons. September is typically a bearish month, Fed Cutting rates will actually be bearish, not bullish, Employment rate is going higher, Credit Card delinquencies are higher, Auto Payment delinquencies are higher, etc., etc., etc.
Those reasons are data, news, opinions and not how we make money on a daily basis trading ES. As we all know, Institutions make money on news events, by using those events to scare retail investors into a bearish mindset, sell price down to key levels that they can run stops, grab liquidity, and then ride the market higher. It's called accumulation and distribution.
------------------------------------------------------------------------------------------------------------------
Let's get into today's trading plan!
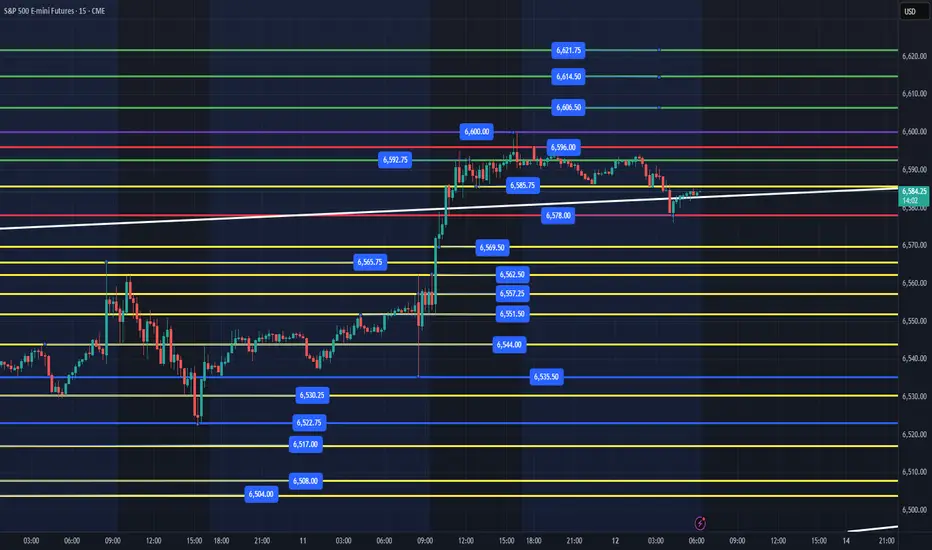
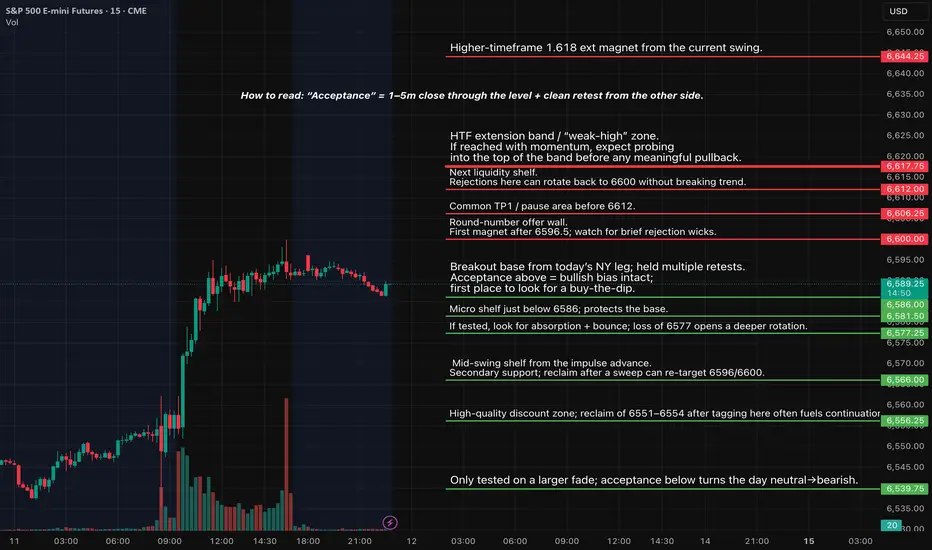
Overnight low is 6576 and high is 6596. We have been going sideways overnight and into the white trend line magnet. We are currently grinding slowly across the white trendline as I write this plan. After a healthy 65pt move yesterday, price needs to settle and figure out what it wants to do. While we don't care what price decides to do or the path it takes, we will just focus on what levels do we think have the highest probability of flushing, reclaiming and driving us higher to the next level. (Why? I do NOT SHORT ES, I LONG areas that liquidity will be present and institutions are buying at).
Key Support Levels - 6576, 6569, 6562, 6551, 6535, 6522
Key Resistance Levels - 6585, 6592, 6596, 6600
Upside targets above are 6606, 6614, 6621+
Key Levels to watch for price opportunities:
1. Overnight low at 6576. This area was tested and really has not given us much of a bounce, so not sure there is much liquidity left in the tank when we test it again.
2. 6562, flush and reclaim to back test 6576 and potentially keep going higher.
3. 6551, flush and reclaim to back test 6576 and potentially keep going higher.
IF, price breaks below 6551, I will only be focused on the flush and reclaim of the levels in blue below at 6535, 6522. This could be 6530, reclaim 6535 or 6517, reclaim 6522.
IF, price can flush and reclaim the red or blue levels, those are always my highest quality spots I am looking to ride higher. The yellow levels are very important support and resistance levels that you can get reclaims of and move higher. They can also be choppy and harder to enter without a short time frame edge for entry. It is all based on your strategy, goals and edge of getting points from ES.
I will post an update around 10am after the NYSE open.
---------------------------------------------------------------------------------------------------------------------
Couple of things about how I color code my levels.
1. Purple shows the weekly High/Low
2. Red shows the current overnight session High/Low (time of post)
3. Blue shows the previous day's session Low (also other previous day's lows)
4. Yellow Levels are levels that show support and resistance levels of interest.
5. White shows the trendline from the August lows.
Strategies & Styles in Global TradingPart 1: Foundations of Global Trading Strategies
1.1 Strategic Thinking in Trading
Trading strategies aim to answer three critical questions:
What to trade? (stocks, forex, commodities, indices, crypto, bonds).
When to trade? (entry and exit timing based on analysis).
How much to risk? (position sizing and risk management).
Without a defined strategy, trading becomes speculation driven by emotions.
1.2 Key Influences on Strategy
Global strategies are shaped by:
Market type: Developed (US, EU, Japan) vs. Emerging (India, Brazil, South Africa).
Time horizon: Long-term investments vs. intraday moves.
Information source: Technical analysis, fundamental analysis, quantitative models, or macroeconomic data.
Technology: Algorithmic trading, AI-driven predictions, and blockchain-based platforms.
Part 2: Major Trading Styles
2.1 Day Trading
Definition: Buying and selling within the same day, closing all positions before market close.
Features: Relies on volatility, liquidity, and rapid decision-making.
Tools Used: Intraday charts (1-min, 5-min, 15-min), moving averages, volume profile, momentum indicators.
Global Example: US tech stocks like Tesla or Nvidia are favorite day-trading instruments due to volatility.
Pros: Quick profits, no overnight risk.
Cons: High stress, requires constant monitoring, heavy brokerage costs.
2.2 Swing Trading
Definition: Holding trades for several days or weeks to capture medium-term price swings.
Basis: Combines technical chart patterns with macro/fundamental cues.
Global Example: Trading EUR/USD currency pair during central bank policy cycles.
Pros: Less stressful than day trading, better reward-to-risk ratio.
Cons: Requires patience; risk of overnight news shocks.
2.3 Position Trading
Definition: Long-term strategy, holding positions for months or years.
Basis: Fundamental analysis (earnings, economic cycles, interest rates).
Global Example: Long-term bullish positions in gold as an inflation hedge.
Pros: Less frequent monitoring, aligns with macro trends.
Cons: Requires strong conviction and capital lock-in.
2.4 Scalping
Definition: Ultra-short-term trading strategy, aiming for small profits on many trades.
Basis: Order flow, bid-ask spreads, micro-movements.
Global Example: Forex scalpers trade EUR/USD, GBP/USD due to high liquidity.
Pros: Rapid compounding of profits, no overnight risk.
Cons: High transaction costs, requires lightning-fast execution.
2.5 Algorithmic & Quantitative Trading
Definition: Using computer models, AI, and algorithms to trade automatically.
Methods: Statistical arbitrage, mean reversion, machine learning models.
Global Example: Hedge funds like Renaissance Technologies use quant models to outperform markets.
Pros: Emotion-free, scalable, works 24/7 in multiple markets.
Cons: Requires advanced coding skills, backtesting, and infrastructure.
2.6 High-Frequency Trading (HFT)
Definition: Subset of algorithmic trading using microsecond execution speed.
Basis: Profiting from inefficiencies in order books, arbitrage, spreads.
Global Example: Chicago Mercantile Exchange (CME) futures and US equities.
Pros: Can generate huge volumes of small profits.
Cons: Expensive technology, regulatory scrutiny, highly competitive.
2.7 Event-Driven Trading
Definition: Trading based on news, earnings reports, central bank decisions, or geopolitical events.
Global Example: Buying oil futures after OPEC production cuts; trading GBP during Brexit votes.
Pros: High potential returns.
Cons: High volatility, unpredictable outcomes.
2.8 Arbitrage Strategies
Definition: Profiting from price discrepancies between markets.
Types:
Spatial arbitrage (same asset, different markets).
Triangular arbitrage (currency mismatches).
Merger arbitrage (M&A deals).
Global Example: Simultaneously buying and selling Bitcoin on different exchanges.
Pros: Low-risk if executed correctly.
Cons: Requires speed, capital, and advanced systems.
Part 3: Global Trading Strategies by Asset Class
3.1 Equity Trading Strategies
Value Investing: Buying undervalued stocks (Warren Buffett approach).
Growth Investing: Targeting high-growth sectors like AI or EVs.
Momentum Trading: Riding the wave of strong price trends.
Pairs Trading: Long one stock, short another in the same sector.
3.2 Forex Trading Strategies
Carry Trade: Borrowing in low-interest currency, investing in high-interest currency.
Breakout Trading: Entering positions after a currency breaks key levels.
Range Trading: Buying low, selling high in sideways markets.
News Trading: Trading during central bank announcements or data releases.
3.3 Commodity Trading Strategies
Trend Following: Using moving averages for oil, gold, wheat.
Seasonal Strategies: Trading based on harvests or demand cycles.
Hedging: Producers using futures to lock in prices.
Spread Trading: Buying one commodity and selling another related one (e.g., crude oil vs. heating oil).
3.4 Bond & Fixed Income Trading Strategies
Yield Curve Strategies: Positioning based on steepening or flattening yield curves.
Credit Spread Trading: Exploiting risk premiums between corporate and government bonds.
Duration Hedging: Managing sensitivity to interest rate changes.
3.5 Cryptocurrency Trading Strategies
HODLing: Long-term holding of Bitcoin, Ethereum.
DeFi Yield Farming: Earning interest from decentralized lending protocols.
Arbitrage: Spot vs. futures arbitrage.
Momentum & Volatility Plays: Crypto thrives on extreme price swings.
Part 4: Risk Management & Psychology in Strategies
4.1 Risk Management Tools
Stop-Loss & Take-Profit Orders.
Position Sizing (1–2% capital per trade rule).
Diversification across assets and geographies.
Hedging with options/futures.
4.2 Psychological Styles in Trading
Aggressive vs. Conservative traders.
Discretionary vs. Systematic approaches.
Risk-seeking vs. Risk-averse behaviors.
Trading psychology (discipline, patience, emotion control) often defines whether a strategy succeeds or fails.
Part 5: Regional Differences in Global Trading Styles
US Markets: Heavy focus on tech stocks, options trading, and HFT.
Europe: Strong in forex, bonds, and energy trading.
Asia (Japan, China, India): Retail-dominated, rising algo-trading adoption.
Middle East: Commodity-heavy (oil, petrochemicals).
Africa & Latin America: Emerging markets, currency and commodity-driven.
Part 6: The Future of Global Trading Strategies
AI & Machine Learning: Automated strategies learning from big data.
Blockchain & Tokenization: 24/7 trading, decentralized exchanges.
Sustainable Trading: ESG-based strategies, carbon credits.
Cross-Asset Strategies: Linking equities, commodities, crypto, and derivatives.
Conclusion
Global trading is not just about buying and selling—it is about choosing the right strategy and style that aligns with one’s goals, risk tolerance, and market conditions.
From short-term scalping to long-term investing, from algorithmic arbitrage to macro-driven positioning, traders worldwide adapt strategies to seize opportunities across stocks, currencies, commodities, bonds, and cryptocurrencies.
The winning formula is not a single "best" style—it’s about discipline, adaptability, risk management, and continuous learning. Markets evolve, and so must strategies.
US Stock Market, Retail Investors’ Pessimism;A Positive Signal?1) What is contrarian analysis of financial markets?
Contrarian analysis is an original way of looking at financial markets, based on market sentiment, particularly the sentiment of retail traders, often considered the “weak hands” of the market. Instead of following the dominant opinion, it assumes that the crowd is often wrong, especially retail investors. Indeed, they tend to react emotionally: buying when everything looks good and selling when everything looks bad.
However, markets rarely behave so obviously. When the majority of retail investors are euphoric and convinced that the rally will continue, it often means most of them have already bought, leaving few potential buyers to push prices higher – and therefore the market top may be near. Conversely, when these same investors are pessimistic, it usually indicates that they have already sold, that the downside potential is limited, and that the market bottom is near.
Applied to US equities, this reasoning becomes particularly interesting. Imagine a steadily rising market, supported by strong corporate earnings and a solid economy. If retail investors remain cautious or worried despite this, it may suggest that the rally is not over. Their skepticism leaves room for additional buying later, which can extend the trend.
In summary, contrarian analysis encourages us to view retail investors’ pessimism as an opportunity rather than a threat. As long as they doubt, the market is probably not at its peak. It is only when optimism becomes widespread that real caution is warranted.
2) According to the AAII, retail investors’ pessimism is near its yearly high regarding US equities
The current sentiment situation is particularly interesting. According to the latest survey by the American Association of Individual Investors (AAII), the percentage of retail investors with bearish expectations has climbed near its yearly high and stands well above its historical average.
Yet, the S&P 500 is trading near its all-time high. According to contrarian analysis, this suggests that the bullish cycle top in the S&P 500 has not yet been reached, since market peaks are always built on retail investors’ euphoria (and troughs on their pessimism).
DISCLAIMER:
This content is intended for individuals who are familiar with financial markets and instruments and is for information purposes only. The presented idea (including market commentary, market data and observations) is not a work product of any research department of Swissquote or its affiliates. This material is intended to highlight market action and does not constitute investment, legal or tax advice. If you are a retail investor or lack experience in trading complex financial products, it is advisable to seek professional advice from licensed advisor before making any financial decisions.
This content is not intended to manipulate the market or encourage any specific financial behavior.
Swissquote makes no representation or warranty as to the quality, completeness, accuracy, comprehensiveness or non-infringement of such content. The views expressed are those of the consultant and are provided for educational purposes only. Any information provided relating to a product or market should not be construed as recommending an investment strategy or transaction. Past performance is not a guarantee of future results.
Swissquote and its employees and representatives shall in no event be held liable for any damages or losses arising directly or indirectly from decisions made on the basis of this content.
The use of any third-party brands or trademarks is for information only and does not imply endorsement by Swissquote, or that the trademark owner has authorised Swissquote to promote its products or services.
Swissquote is the marketing brand for the activities of Swissquote Bank Ltd (Switzerland) regulated by FINMA, Swissquote Capital Markets Limited regulated by CySEC (Cyprus), Swissquote Bank Europe SA (Luxembourg) regulated by the CSSF, Swissquote Ltd (UK) regulated by the FCA, Swissquote Financial Services (Malta) Ltd regulated by the Malta Financial Services Authority, Swissquote MEA Ltd. (UAE) regulated by the Dubai Financial Services Authority, Swissquote Pte Ltd (Singapore) regulated by the Monetary Authority of Singapore, Swissquote Asia Limited (Hong Kong) licensed by the Hong Kong Securities and Futures Commission (SFC) and Swissquote South Africa (Pty) Ltd supervised by the FSCA.
Products and services of Swissquote are only intended for those permitted to receive them under local law.
All investments carry a degree of risk. The risk of loss in trading or holding financial instruments can be substantial. The value of financial instruments, including but not limited to stocks, bonds, cryptocurrencies, and other assets, can fluctuate both upwards and downwards. There is a significant risk of financial loss when buying, selling, holding, staking, or investing in these instruments. SQBE makes no recommendations regarding any specific investment, transaction, or the use of any particular investment strategy.
CFDs are complex instruments and come with a high risk of losing money rapidly due to leverage. The vast majority of retail client accounts suffer capital losses when trading in CFDs. You should consider whether you understand how CFDs work and whether you can afford to take the high risk of losing your money.
Digital Assets are unregulated in most countries and consumer protection rules may not apply. As highly volatile speculative investments, Digital Assets are not suitable for investors without a high-risk tolerance. Make sure you understand each Digital Asset before you trade.
Cryptocurrencies are not considered legal tender in some jurisdictions and are subject to regulatory uncertainties.
The use of Internet-based systems can involve high risks, including, but not limited to, fraud, cyber-attacks, network and communication failures, as well as identity theft and phishing attacks related to crypto-assets.

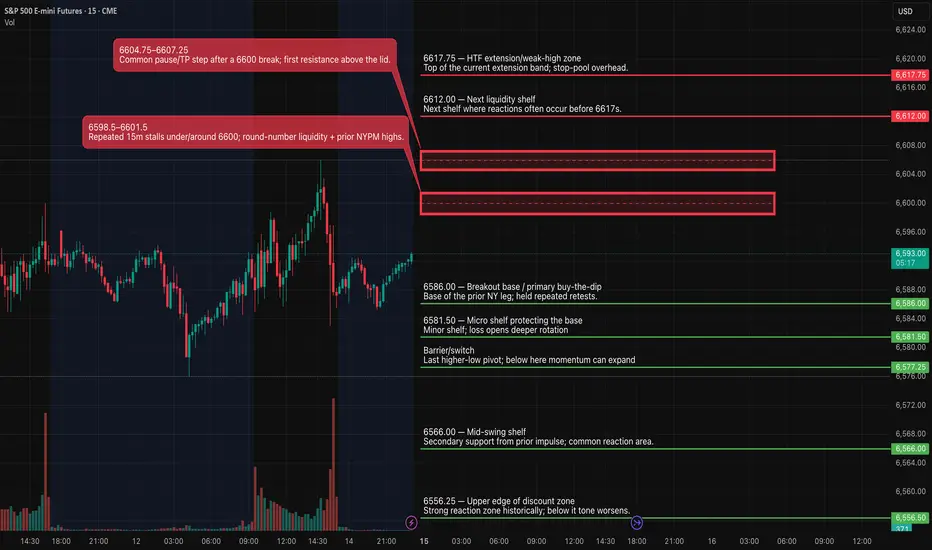
ES (SPX) Futures Analyses for tomorrow Sep 12Overnight
Expect balance 6586–6596 with a modest bullish tilt. If ON accepts >6596.5, drift toward 6603–6606 is likely before NY.
Tomorrow (NY session)
Base case: Early range, then acceptance >6596.5 (close + clean retest) → expansion to 6606 → 6612 → 6616–6619 (HTF extension band).
Failure path: Rejection at 6596–6600 and acceptance <6586 → rotate 6581 → 6577; deeper only if 6577 fails (then 6566/6556).
Fundamentals (times ET)
10:00 — Univ. of Michigan Consumer Sentiment (Prelim, Sep). This is the only major macro print on deck; expect a 2–5m whipsaw around the release, then directional follow-through after displacement.
Today’s context: CPI (Aug) came in +0.4% m/m, +2.9% y/y; Core +0.3% m/m, +3.1% y/y, and Initial Jobless Claims rose to 263k (week ending Sep 6). Together: inflation still sticky but labor softening—into tomorrow this supports “range→up unless 6586 breaks.”
fall in price on es we look to be far overextended and my model shows a growing up side accumulation in laquitity short today

Day 26 — Trading Only S&P Futures | BLS Revision TradeToday’s session lined up perfectly with the news. I came in prepared, knowing the BLS jobs revision was coming, and expected the number to print bigger than forecast.
As the market opened, structure flipped bearish and we started trending down. I shorted resistance levels and traded the 1-min MOB for easy profits once the data came out — which confirmed the trade idea. Ended the day with +300.02.
📰 News Highlights
US 2025 BLS Payrolls revision: -911K jobs, biggest downward revision on record
🔑 Key Levels for Tomorrow
Above 6480 = Remain Bullish
Below 6465 = Flip Bearish
This is also one of the first weeks i am testing copytrading apps that allow me to trade 5-10 accounts at once and it just follows the first account.
But I set my other accounts with bigger drawdowns to trade 3x the leader account test test how things work and i have 1 account that locks out after $150s because based on my study, if i lock out after $150, i will have a high success rate for the month.
All of this is only possible after i tested run myself and my strategy where I am trading like a turtle and making sure I can trade for a full month with 70% + win rate and achieve consistency without blowing up the account.
Once that was achieve, I can use any copy trading app to multiple my $200/day trades into 1000 by having all my other account follow my leader account.
But don't rush to do this until you are successful.
Remember to WALK, before you run.

Will Lowered Interest Rates Make Or Break The Stock Index MarketS&P 500 Fundamentals:
All three of the major indexes posted gains for the week, led by a 2% gain in the Nasdaq, with expectations high the Fed will cut interest rates by at least 25 basis points at the meeting.
S&P ascends second straight week, adds 1.6% on revived artificial intelligence optimism, expected interest-rate cuts.
Price Levels To Lookout For:
- Closure Above $6,600
- $6,450 Weekly Order Block
- $6,223.25 - $6,109.00 Weekly Draw On Liquidity
Nasdaq Fundamentals:
Helping the Nasdaq, shares of Tesla gained 7.4% after board chair Robyn Denholm dismissed concerns that CEO Elon Musk's political activity had hurt sales at the electric-vehicle maker and said the billionaire was "front and centre" at the company.
Price Levels To Lookout For:
- $24,068.50 Prev All-Time HIghs
- $24,200 Psychological Level
- $22,222 - $22,582 Weekly Sellside Liquidity Pool
Dow Jones Fundamentals:
In New York, the Dow Jones Index dropped 231 points or 0.50 percent on Friday.
Losses were led by Merck (-2.75%), Sherwin-Williams (-2.14%) and Honeywell International (-1.79%).
Offsetting the fall, top gainers were Apple (1.82%), Microsoft (1.76%) and Walmart (0.83%).
Price Levels To Lookout For:
- $46,176 (Current Highs)
- $45,245 Weekly Order Block
- $44,642 - $44,615 Weekly BISI

Day 28 S&P Futures | -$78 Trading While Under the WeatherWelcome to Day 28 of Trading Only S&P Futures!
Not my best day — I was feeling under the weather and missed the open. Took a trade at resistance that didn’t work out and left some limit orders higher up at GEX resistance levels. Most of the session I stayed on the sidelines, but my end-of-day orders finally filled and gave me a decent recovery.
Sometimes the best decision when you’re not 100% is to step back and avoid forcing trades.
📰 News Highlights
DOW CLOSES UP OVER 600 POINTS, VIX TUMBLES AS STOCKS END AT RECORD HIGHS AFTER CPI DATA
🔑 Key Levels for Tomorrow
Above 6540 = Remain Bullish
Below 6520 = Flip Bearish

ES - September 11th - Daily Trade PlanSeptember 11th - 5:50am EST
Yesterday, we did not get as much volatility as we have done in the past on economic data release days. Today, we have another with CPI at 8:30am. While we could continue the trend of low volatility, today I am still going to be cautious. Before I get into today's plan, take a minute to read my daily trade plan from yesterday. (See Related Publication Section)
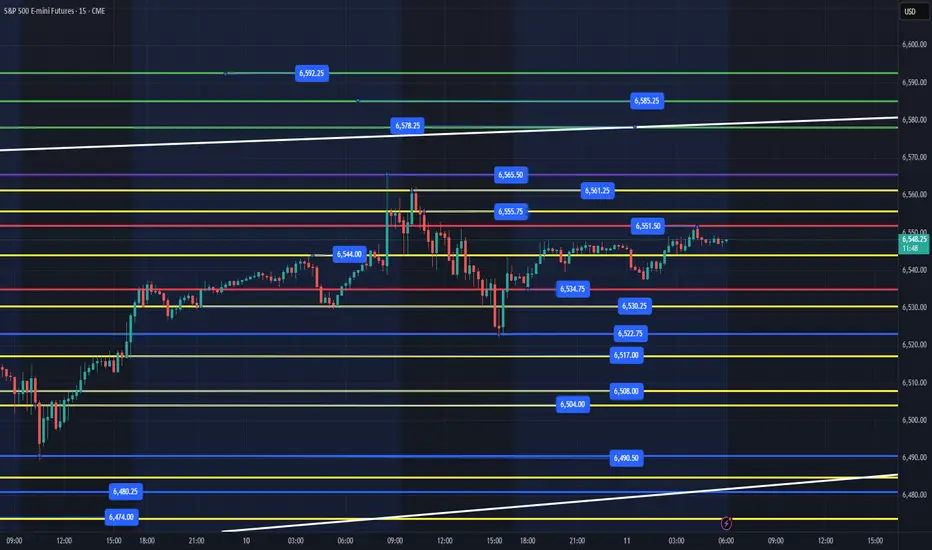
I stated in the plan "Any flush of 6526 and reclaim should be a good level for a move higher. We could see price sell off all the way down to the white trend line around 6474 area, flush and then recover a level in blue to continue higher."
After the initial pop from the PPI release, we opened up battled between 6545-6562, then grinded lower after many attempts to lose 6545. I said, yesterday in my 10:29am Note:
"Price can still go higher, but any loss of 6545 would not be good and could flush lower. See my updates above on places I like for us to flush and reclaim at lower levels. 6526 being first for some points, maybe even getting as low as 6517 and reclaiming 6526."
At 3:20pm we touched the 6522 level and rallied up to 6543 into the close for a nice 20pt pop. While I was actually off my desk for this move, it shows you that with patience and waiting for the high-quality setups, you will be rewarded.
------------------------------------------------------------------------------------------------------------------
What is the plan for today? 8:30am, we have a big data report. I will not be trading before the report and will be waiting on price to settle out after the NYSE open. That is one of my rules on data & volatility events.
Overnight low is 6534 and high is 6551 as of writing. We have to remain bullish until proven otherwise, so the targets above at 6567, 6578 and if it really wants it can get to 6592. I have said that the white trend line is a magnet that we are heading towards. We just don't know what route price will take to achieve its targets. We focus on our process and edge to take points out of the market daily.
Key Support Levels - 6545, 6534, 6530, 6522, 6523, 6517, 6504-08, 6490, 6480
Key Resistance Levels - 6551, 6555, 6565, 6578, 6592
After the CPI release and by 9am, we should have a good sense for what price is looking to do. Any flush of 6534 or even better 6222 (maybe as low as 6517) and reclaim should be a good level for a move higher. We could see price sell off all the way down to the white trend line around 6480 area, flush and then recover a level in blue to continue higher.
IF, price does flush 6490 and we are accelerating into it, I would be patient and wait to see what it does. While yesterday we flushed, recovered for a nice 50 point move higher, we might get a nice bounce, but liquidity continues to be taken each time we visit this level and when we do lose the level, I anticipate a multi-level loss.
IF, price can flush and reclaim the red or blue levels, those are always my highest quality spots I am looking to ride higher. The yellow levels are very important support and resistance levels that you can get reclaims of and move higher. They can also be choppy and harder to enter without a short time frame edge for entry. It is all based on your strategy, goals and edge of getting points from ES.
Size down today, price could lose 100+pts or run 100+pts higher. Do not be a hero. Wait for your levels and edge to enter and make sure you take profits at the next level higher.
I will post updates after CPI and around 10am after NYSE has settled out.
-----------------------------------------------------------------------------------------------------------------
Couple of things about how I color code my levels.
1. Purple shows the weekly High/Low
2. Red shows the current overnight session High/Low (time of post)
3. Blue shows the previous day's session Low (also other previous day's lows)
4. Yellow Levels are levels that show support and resistance levels of interest.
5. White shows the trendline from the August lows.
ES (SPX) Analyses for Thu, Sep 11 (CPI day)What matters tomorrow (fundamentals)
CPI (Aug) at 8:30 ET — the BLS schedule shows the August CPI release Thu Sep 11, 08:30 ET. This is the day’s primary driver.
Weekly Initial Jobless Claims at 8:30 ET — standard Thursday release; calendars show the event scheduled for Sep 11 at 08:30 ET.
Treasury 30-yr bond auction — $22B long-bond sale Thursday (typically 13:00 ET). This can move yields into the NY afternoon and spill into equities.
Context into the print: PPI (Aug) was released today (Sep 10); YoY +2.6% per data trackers/BLS release, keeping focus on CPI for confirmation. Markets are leaning toward a Fed cut at next week’s meeting.
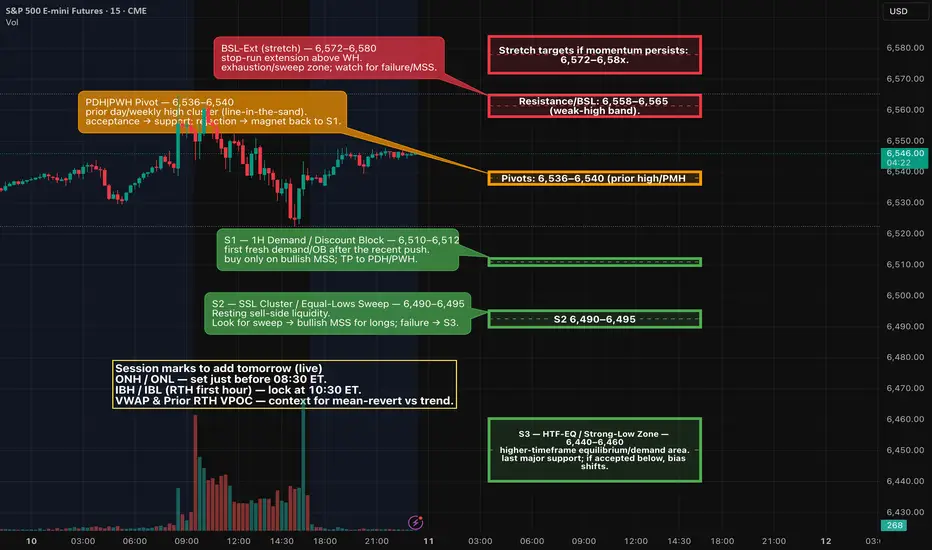
I’m using your 1D / 4H / 1H.
Trend: Uptrend intact on 1D; price sits just beneath a “weak-high / premium” supply band. (1D shows fib extensions near ~6705 (1.272) and ~6799 (1.618) as far targets, not base-case for tomorrow.)
4H: Recent push into a red supply band then pullback; mid-range equilibrium roughly ~6,44x–6,45x.
1H: Resistance zone ~6,558–6,565 (your “Weak High” band). Prior highs around ~6,536–6,540 act as local pivot/PMH; below that, demand/discount blocks stack ~6,50x → 6,46x–6,44x.
Scenario A — Disinflationary/soft CPI (yields down)
Likely path: Early sell-side sweep into 6,51x → 6,49x discount → bullish MSS.
Entry: Buy the 1–5m PD-array in discount after displacement.
Targets: 6,536–6,540 → 6,558–6,565 (weak-high). Leave runner toward 6,57x–6,58x only if order-flow stays bid.
Invalidation: 1–5m structure loses 6,49x and cannot reclaim.
Scenario B — Hot CPI (yields up)
Likely path: Buy-side sweep through 6,558–6,565 → failure → bearish MSS back below the band.
Entry: Short premium PD-array after displacement down.
Targets: 6,536–6,540 → 6,51x, stretch 6,49x then 6,46x–6,44x if momentum accelerates.
Invalidation: Acceptance back above 6,565 with bullish structure.
Projections:
ES futures are anticipated to respond within a 5-15 minute window following the 8:30 AM release, with intraday movements likely intensified by algorithmic trading and stop-hunting activities. Historical analysis of the past 6 CPI events indicates an average end-of-day ES move of approximately +0.76% in response to ±0.1% deviations from forecasts. The prevailing volatility suggests that implied moves, derived from options data, are forecasting a swing of around 0.5-1% (equivalent to ±30-60 points from current levels), though actual market responses have been known to exceed these expectations in the event of surprises.
In the pre-release phase, spanning overnight to pre-market hours (approximately 4:00-9:30 AM ET), market participants are likely to observe a consolidation or mild upward bias within a range of 6480-6575, building upon today’s record highs. The light trading volume may lead to false breakouts around critical levels. Traders are currently positioning for a "failed breakdown" pattern, wherein an initial dip below recent lows could trigger stop-loss orders, followed by a swift reversal higher if market sentiment remains intact.
As the clock strikes 8:30 AM ET, high volatility is expected, with the potential for a 20-40 point gap open or sharp spike. A common occurrence is an initial downside flush aimed at testing liquidity (for instance, dipping below 6500) before a definitive market direction is established. Whipsaw action is likely as news headlines emerge, with particular focus on the core CPI data, which will be pivotal for determining sustained market trends.
Good Luck Everyone!
Waiting for CPICPI numbers on Thursday can add to the expectation of future Fed action. The next objective to the upside is 6560.

Day 27 — Trading Only S&P Futures | 20pt Win & Bottom CatchWelcome to Day 27 of Trading Only S&P Futures!
Started the day red due to overnight trades, but once the session opened, everything lined up perfectly. I waited for resistance after spotting multiple X7 sell signals, shorted the top, and caught a 20-point move down to MOB. From there, I flipped long, and later caught the market bottom with the help of Bia’s analysis.
The result? A smooth +385 day — clean reads, clean execution.
📰 News Highlights
S&P 500, NASDAQ eke out record closing highs after tame PPI inflation data
🔑 Key Levels for Tomorrow
Above 6515 = Remain Bullish
Below 6500 = Flip Bearish

Sep 10 MES Recap: Watching MAG7, Session Highs/Lows, and Higher MES Journal – September 10, 2025
Today I traded MES using supply and demand levels, while also tracking leadership from the MAG7 (with QQQ as my main proxy).
Track the MAG7 with me on TradingView using the MAG7
List .
I didn’t trade with this strategy until a few guys in my Discord recommended it. I had a bit of a learning curve, but I finished green on most accounts for the first time in a while.
Context I Tracked
Asian session high/low: 6,514 / 6,492
London session high/low: 6,528 / 6,506
Previous day high/low: 6,536.25 / 6,489.25
PPI report (Aug 2025): -0.1% vs forecast, shifted bias from bullish to bearish intraday
VWAP levels on both ES and QQQ
Wins
Stayed green overall on funded accounts with payout potential.
Saw the end-of-day pump confirmed by MAG7, even after an initial retrace.
Reinforced my supply/demand and VWAP process.
Losses and Lessons Learned
Entered one trade without higher timeframe confirmation, which cost me a FundingTicks eval account (treating this loss as tuition).
Learned that higher timeframes (1H/4H/Daily) must confirm intraday levels before entering.
Looking Forward
I’ll combine:
Supply/Demand + Session Highs/Lows
Leader ETF (QQQ/MGK/MAG7)
Higher Timeframes (1H/4H/Daily)
This approach gives me more conviction and fewer blind trades.
Indicators
Since I’m still learning how to mark levels properly, I’m starting out with indicators to help reinforce that I’m using potentially correct levels. I primarily used:
Asian
& London Sessions High/Lows
Previous
Highs & Lows
Supply
and Demand Visible Range
TradingView default VWAP indicator

ID: 2025 - 0199.9.2025
Trade #19 of 2025
Entry at 164 DTE
Adding to the overall portfolio to help balance delta in anticipation of a market pullback.
Working GTC orders for take profit in 30-60 DIT.
Happy Trading!
-kevin

ES - September 10th - Daily Trade Plan September 10th - 5:45am EST -
Volatility should arrive with PPI & CPI today and tomorrow. I will not go into too much detail about my trade plan yesterday as you can read it under the (Related Publication Section). A couple of highlights, 6493 & 6505-08 have been 2 key levels so far this week. Why? Institutions have been buying at these levels and price has kept moving higher. As you know by now, my edge is buying after the Institutions and riding the wave higher. I do NOT short ES as I wait for short squeezes as a safer way to enter and ride the waves up in bull/bear markets. The past couple of days have been pretty boring price action. We have chopped retail investors up all week as price has ping ponged back and forth between my levels, but more importantly between 6493-6523. We finally broke out overnight and hit our first target of the week, which was also last week's high at 6544.
What is the plan for today? 8:30am, we have a big data report. I will not be trading before the report and will be waiting on price to settle out after the NYSE open. That is one of my rules on data & volatility events.
Overnight low was 6526 with the high being 6544. We have to remain bullish until proven otherwise, so the targets in green above are still in play this week. How do we get to those targets? Ideally, we get a big flush, scare retail traders, let them pile in short, flip the script, short squeeze and ride higher. If you have been trading ES for any length of time you know that if price is flushing, you get out the way. Do not be a hero and try to pick when price will reverse. Identify levels that have high probabilities, watch the reaction at that level, then enter based on your edge.
Key Support Levels - 6530, 6526, 6523, 6517, 6504-08, 6490
Key Resistance Levels - 6544, 6549, 6555, 6562, 6578+
The white trend line is the magnet above that I believe we are heading for at some point this week or into the Fed meeting next week.
After the PPI release and by 9am, we should have a good sense for what price is looking to do. Any flush of 6526 and reclaim should be a good level for a move higher. We could see price sell off all the way down to the white trend line around 6474 area, flush and then recover a level in blue to continue higher.
IF, price does flush 6490 and we are accelerating into it, I would be patient and wait to see what it does. While yesterday we flushed, recovered for a nice 50 point move higher, we might get a nice bounce, but liquidity continues to be taken each time we visit this level and when we do lose the level, I anticipate a multi-level loss.
IF, price can flush and reclaim the red or blue levels, those are always my highest quality spots I am looking to ride higher. The yellow levels are very important support and resistance levels that you can get reclaims of and move higher. They can also be choppy and harder to enter without a short time frame edge for entry. It is all based on your strategy, goals and edge of getting points from ES.
Size down today, price could lose 100+pts or run 100+pts higher. Do not be a hero. Wait for your levels and edge to enter and make sure you take profits at the next level higher.
I will post updates after PPI and around 10am after NYSE has settled out.
-----------------------------------------------------------------------------------------------------------------
Couple of things about how I color code my levels.
1. Purple shows the weekly High/Low
2. Red shows the current overnight session High/Low (time of post)
3. Blue shows the previous day's session Low (also other previous day's lows)
4. Yellow Levels are levels that show support and resistance levels of interest.
5. White shows the trendline from the August lows.

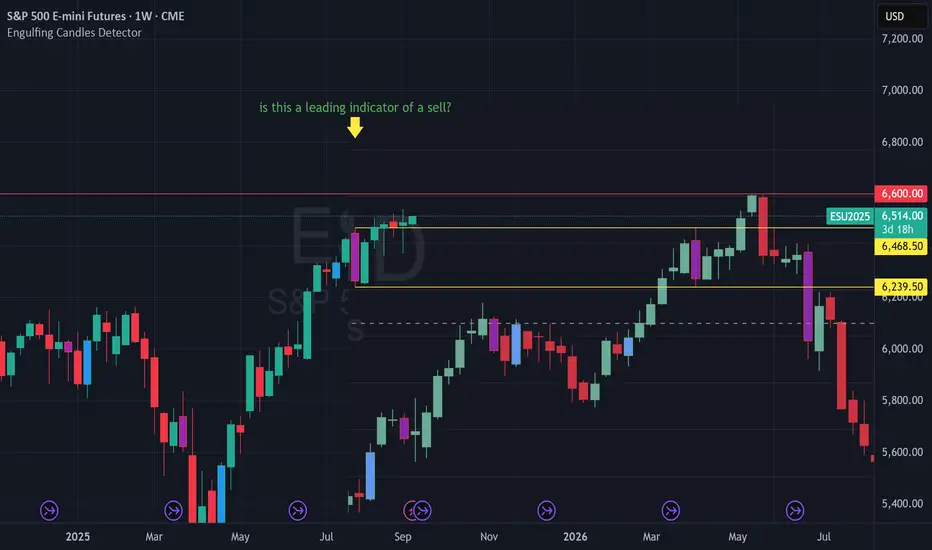
Is the Risk about to be a sell? Put an old pattern of gold from last fall up next to ES. Both have a striking similarity with a Bearish Engulfing pattern and price struggling to move past. Is that bearish engulfing weekly a leading indicator of a pretty sizable dumpster fire coming?
ES - September 9th - Daily Trade PlanSeptember 9th - 5:45am EST - Daily Trade Plan
Yesterday, I did not make a trade. I was waiting on price to flush a lower level and all we got in the afternoon was the 6493 level that was the 2am low and produced a low-quality setup based on my edge. When we are trading in such narrow ranges, it can be difficult to not get chopped around and my edge is focused on flushing high quality levels, reclaim and then enter after and ride up with the institutions. You can see that Institutions were buying yesterday and holding the 6493 level all day. I stated in my updated note at 11am - "Price broke above the overnight high and is testing the 6517 resistance." (We never got a back test that I could enter long) Any pullback needs to hold the 6508 level." Price didn't hold but also didn't flush lower than 6493.
I only mention this because this is what patient, disciplined trading looks like. FOMO is what will end your trading career. Do I want to trade and make money each day? Of course, but I have to be disciplined to wait for the best entries and not gamble all day long.
Now onto today! The overnight low was 6504 and high is 6523. We have been grinding higher since the Friday low. Any pullback will be health for this structure to continue higher. It cannot keep grinding higher and I am anticipating a pull back to keep us moving up the levels. Which levels should we be looking to engage in?
Key Support Levels - 6504-08, 6493, 6480, 6474, 6464, 6453 - Below Friday's low, I would wait for a level below to build a base around and reclaim.
Key Resistance Levels - 6517, 6523, 6531, 6542
The overnight low of 6504 is first level down to flush and recover and grab some points. Since the 6493 level has tested 3x yesterday, I don't think we will have much left in the tank, and I would expect price to flush a couple of levels. Waiting on 6493 to be reclaimed is the safest spot to enter. Everything between 6506-6516 is pure chop and will fake you out both directions. Be patient and wait for a flush of a level in red or blue and then the reclaim of that immediate level.
I will post an update around 10am EST.

ES (S&P500) - Analyses - Breakout or Breakdown Plan (Sep 9)S&P 500 E-mini (ES) keeps ranging inside 6,490–6,505, with repeated taps of 6,516 above and 6,490–6,496 below. Tomorrow I’m stalking a box resolution during the AM session, then a second chance in the PM window.
Key Zones
Resistance: 6,505–6,516 (NYPM/NYAM lid). Above it: 6,541.25 (PDH) → 6,547.75 (IBH).
Support: 6,495–6,490 (NYAM/NYPM floor). Below it: 6,481.0 → 6,471.5 (hard pools).
Range to watch: 6,490–6,505 (decision box).
Game Plan (structure-first)
LONG (breakout-acceptance)
1. 5-minute displacement close > 6,505–6,516.
2. Retest 6,501–6,503 (OB/FVG/OTE) and hold.
3. Entry on confirm; Targets: TP1 6,541.25, TP2 6,547.75, TP3 6,555+.
4. Invalidation: any 5-minute body back ≤ 6,500 after breakout.
SHORT (breakdown-acceptance)
1. 5-minute displacement close < ~6,496.
2. Retest 6,498–6,500 (failed reclaim) and roll.
3. Entry on confirm; Targets: TP1 6,481.0, TP2 6,471.5, TP3 6,464–6,465.
4. Invalidation: any 5-minute body ≥ 6,500 after fill.
Timing windows
Primary: 09:30–11:30 ET and 13:30–15:30 ET (trade management only in between).
We are currently consolidating below 6,516, with a clear liquidity ladder leading to PDH 6,541.25 if the movement is accepted. If it fails, we have stacked support levels around 6,481 and 6,471 that typically attract price action once 6,496 breaks down.
Please confirm with ES and NQ: we want both indices to move in sync (no bearish signs of market tension on longs, and no bullish signs of market tension on shorts).
What could affect ES tomorrow?
NFIB Small Business Optimism (Aug): 6:00 AM ET.
API crude inventories (for CL correlation): Tuesday around 4:30 PM ET.
(For Wednesday's context: EIA petroleum report at 10:30 AM ET.)

ES - September 8th - Daily Trade PlanSeptember 8th - 8:50am - Update
In my post last night I stated, " Tonight's evening session, I think we can continue to build a base and work higher above the immediate 6492 resistance to 6505-6510 area. I could see us then setting up for a leg lower to flush the 6452 level (Friday's Low) maybe even get below the white trend line to the 6444, 6438 levels and then reclaim the 6452 level. IF not we might need to flush down to 6426 or just under and then reclaim that level to keep price moving higher."
The overnight low was 6479.50 and high is 6508. We have immediate support at 6493.50. While price can rally from here and we have tested the 6508 level 3x so far overnight. I think it needs a pull back to clear the 6508 resistance and overnight high. IF, price can flush 6592 (maybe down to 6488-90) then reclaim and rally, we could retest the 6508 resistances. Ideally, we flush the overnight low (6479.50) and use that level to reclaim and move higher.
IF, price is selling off pretty good and can't reclaim the overnight session low, the 6464, 6452 are key levels I will wait for a reaction, reclaim, and then follow up the levels.
Key Support Levels - 6493, 6479, 6464, 6453 - Below Friday's low, I would wait for a level below to build a base around and reclaim.
Key Resistance Levels - 6508, 6517, 6531, 6542
Since the 6508 level has tested 3x, IF, it does break out the back test of that level, should provide a good entry.
I will see how price is acting in the first 30 mins and will provide an update.

Follow-Up: Non-Farm Moves from FridayHi All,
Following up on the range (size of the move) after non-farm on Friday to see how close our range expectation estimates were (see the earlier video post linked here for that).
The actual number came in pretty poor and worse than expected at 22k (vs 75k expected).
The move on the Non-farm release itself was actually quite muted with roughly a 20pt move on both sides of our VWAP starting point. But the real move came around 30 minutes into the US open where we saw a quick decline down to our lower boundary (50pts lower at 6470) and then briefly over-ran to 6450. But we settled and that 6470 became support for most of the session before reverting back to that declining VWAP to finish the day around 6490.
So, what's the lesson here: a bit of time pre-framing the possibilities for moves in either direction using a combination of stats (ATR, standard deviation of range), other technical analysis tools (support/resistance, VWAP, vol profile) along with experience can help frame the day and the important levels. Use this to start to decide what tools to pull out of the toolbox (trading strategies) and where to initiate trades.
If you find this helpful and would like to see more please let me know.
Happy Trading!

ES (SPX) Weekly: Levels & Setups - Sep 8-12, 2025Price is camped under a higher-timeframe supply/“weak-high” band. Trend remains constructive on the Weekly/Daily, but 4H/1H are coiling beneath resistance. I’m neutral into mid-week inflation data and will only engage on clean acceptance above the prior-high band or a rejection back into range.
Event stance: Two inflation releases hit 08:30 ET mid-week. I’ll be flat into the prints and wait for the first qualifying 15-minute close before arming anything
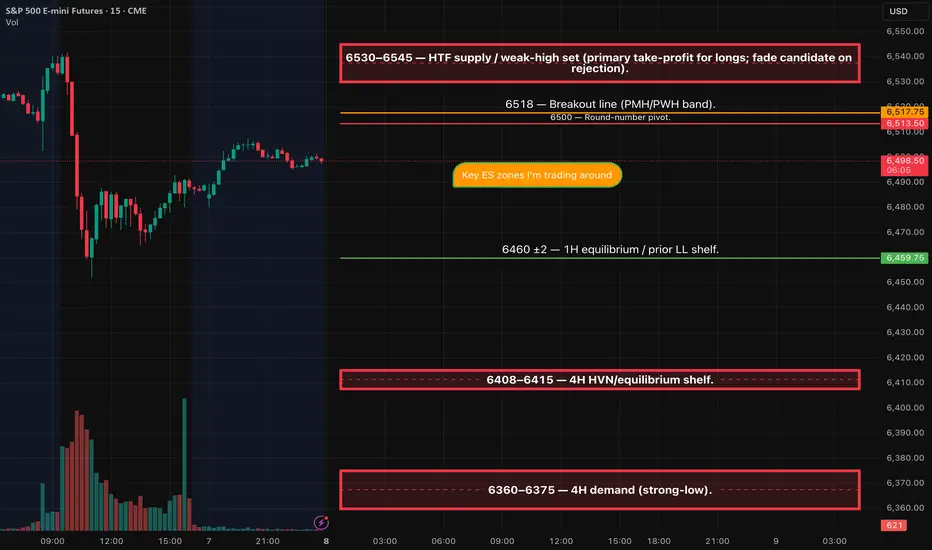
Key ES zones I’m trading around
6530–6545 — HTF supply / weak-high packet (primary take-profit for longs; fade candidate on rejection)
6518 — Breakout line (PMH/PWH band)
6500 — Round-number pivot
6460 ±2 — 1H equilibrium / prior LL shelf
6408–6415 — 4H HVN / equilibrium shelf
6360–6375 — 4H demand (strong-low)
Setup 1 — Breakout-Acceptance LONG
Trigger: 15m close > 6518, then two 5m bodies hold above.
Entry: 6520.5–6523.0 on the retest or break of bar-2 high.
Stop: tighter of (i) below the 15m trigger candle low, or (ii) below the last confirmed 5m swing; cap ≤ 6–8 pts.
• If neither option fits ≤ 8 pts from your fill, pass and wait for a cleaner micro HL.
TP1 (dynamic): first hard band (e.g., any workable print inside 6530–6545) that yields ≥ max(15, 2.5×SL) from your fill (front-run 0.25–0.5 pt if 2.5R is tight).
TP2/TP3: 6550, then 6570; trail by 15m/30m closes.
• Disqualifiers: any 5m body back ≤ 6518 before TP1; visible liquidity wall ≤ 5 pts beyond trigger; news window.
Setup 2 — SRR Rejection SHORT (Sweep → Recapture → Reversal)
Trigger: Sweep 6518–6530, fail, then 15m bearish close < 6518.
Entry: 6515.0–6518.0 on the retest from below.
Stop: tighter of (i) above the 15m trigger candle high, or (ii) above the last confirmed 5m LH; cap ≤ 6–8 pts.
• I f the correct structural stop is > 8 pts from your fill, skip until a micro LH tightens risk.
TP1 (dynamic): first hard band below that gives ≥ max(15, 2.5×SL) from your fill—usually 6500; if 2.5R isn’t met to 6500, promote to 6482, then 6460.
TP2/TP3: 6482, then 6460 (extend toward 6410 if momentum).
• Disqualifiers: no 15m bearish confirmation; any 5m body ≥ 6518–6522 after entry (use your exact line); news window.