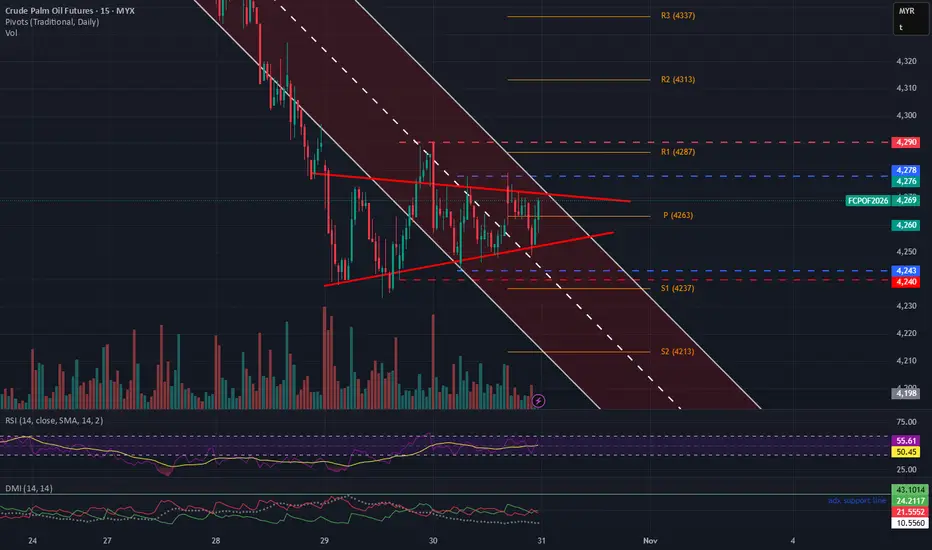
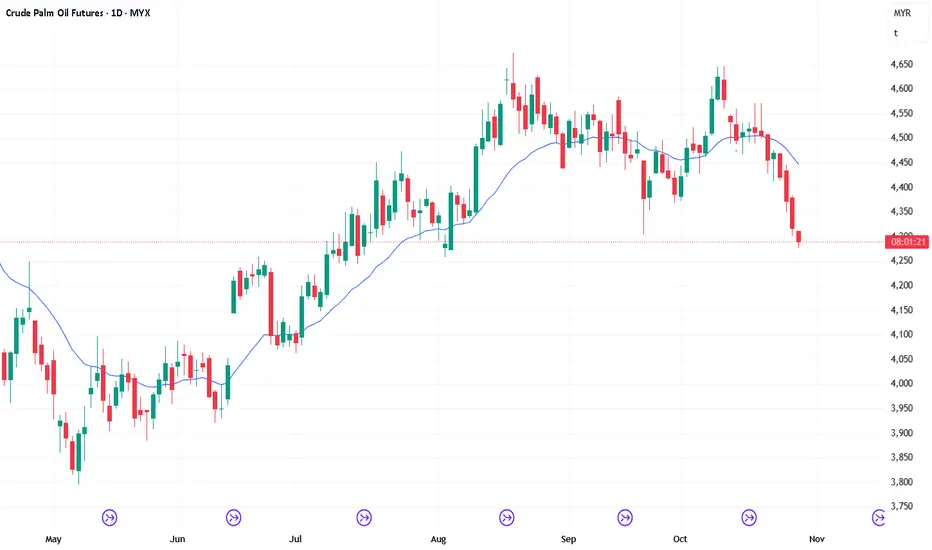
CPO JAN Futures Double top PatternCPO Jan futures forming double top chart pattern. Prices are trading well below the rising trend line at 4350. Trading below 4350 prices are expected to trade further lower to test 4200 - 4100 range in near term. If price falls further below 4100 then we might witness prices to test 3950 - 3800 levels. Any trade between 3800 to 3600 range will be seen as a long term buying opportunity. One should be also couscous around 3900 which can also be acting a a strong support. Chart attached
Trade ideas

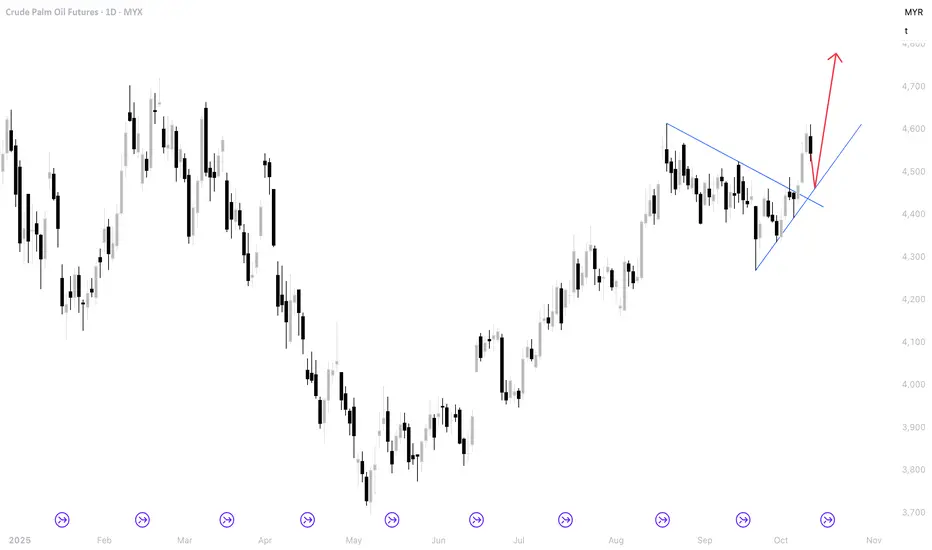
FCPO Forming a symmetrical triangle Main Trend: Bearish
Short Term Trend : Sideways
Trading Plan:
• Short –
o If price unable to break above 4272. TP1=4255 TP24237 TP3=4213
SL=4280
o If price gap up but fail to break above 4287. TP1=4272 TP2=4255 SL=4290
• Long –
o If price break above 4272. TP1=4287 TP2=4313 SL=4263
o If price gap up above 4287. TP1=4300 TP2=4313 SL=4278
DMI: +DI (green) is trying to cross above -DI (red), suggesting potential early bullish momentum.
Disclaimer: This is just my IDEA on the market, not a suggestion to open any trade. Please do not follow without any personal due diligence on the market.
Declining Palm Oil Prices : CSE - WATA/AGAL/NAMU/etcFundamentals
Malaysian palm oil futures have entered a corrective phase, plunging to a four-week low with an 8% decline over the period. This price softening is primarily attributed to:
• Demand contraction in key export markets
• Appreciation of the Malaysian ringgit, reducing competitiveness
CSE Companies with exposure to palm oil benefited from favorable pricing over the previous three months, with notable rallies.
Strategy
The recent price correction is unlikely to impact current quarter earnings.
However, next quarter margins may compress if the downtrend persists
Given the current trajectory of international prices, think a prudent profit-booking approach is more appropriate.
Re-entry opportunities may arise post-stabilization, levels to watch are marked in the chart.

30/10/25 First Pullback Would Likely Only Be Minor
Yesterday's candlestick (Wednesday, October 29) was another bear bar closing near its low with a small tail below.
In our last report, we said traders would observe whether the bears could create more follow-through selling, or if the bulls could create a pullback instead.
The bears continue to create follow-through selling, closing below the September 23 low.
The bulls see the current move as a deep pullback.
They want the September 23 low areas to act as support, forming a large double bottom bull flag (September 23 and October 29 lows).
They want a failed breakout below the September 23 low.
They must create strong consecutive bull bars to show they are back in control.
The bears want strong follow-through selling below the 20-day EMA, with a break below the September low sometime this week. So far, this is the case.
The current move is in the form of a 7-bar bear microchannel, indicating strong bears and persistent selling.
The first pullback would likely be minor, followed by at least a small sideways to down leg to retest the current low extreme (currently the Oct 29 low).
The bears must create sustained follow-through selling trading below the September 23 low to increase the odds of a reversal.
Production: SPPOMA's first 25 days increased by +2.78%.
Refineries' appetite to buy is there, slightly less enthusiastic.
Export: Oct down 0.36% for the first 25 days as per ITS.
For today (Thursday, Oct 29), traders will see if the bulls can create a decent minor pullback attempt.
Or will any pullback be weak (long tails below candlestick, closing below its lower half, lacking in follow-through buying), and the bears continue to get follow-through selling?
For now, odds slightly favor sellers above the first minor pullback.
Andrew
27/10/25 Bears Want FT Selling, Bulls Want PB to 20-Day EMA
Friday’s candlestick (Oct 24) was an inside bear bar closing near its low and still trading below the 20-day EMA.
In our last report, we stated that traders observe whether the bears can create a bear bar closing near their low. If they get that, the weekly candlestick will close near its low, which will increase the odds of next week trading at least a little lower. Or would the bulls be able to create a bull bar instead?
The market bears managed to create a bear bar, and the weekly chart closed near its low.
The bulls see the current move as another pullback.
They want the September 30 or September 23 low areas to act as support, forming a large double bottom bull flag (September 23 and October 23 lows).
They want the market to reverse back above the 20-day EMA.
They must create strong consecutive bull bars trading above the 20-day EMA to show they are back in control.
The bears see the recent (Oct 9) move as a buy vacuum retest of the August high.
They got a pullback from a double top bear flag (Aug 19 and Oct 9), a lower high major trend reversal (Oct 9), as well as a larger double top bear flag with the February high on the larger time frame.
They see last Friday's rally (Oct 17) forming a lower high and Tuesday's (Oct 21) forming a micro double top (Oct 17 and Oct 21).
They want strong follow-through selling below the 20-day EMA, with a break below the September low sometime this week.
If the market trades higher, they want the 20-day EMA or the October 17 high to act as resistance, followed by a 3rd leg sideways to down.
The bears must create sustained follow-through selling trading far below the 20-day EMA and the September 23 low to increase the odds of a deeper pullback.
Production: SPPOMA's first 20 days increased up 2.7%.
Refineries' appetite to buy remains decent.
Export: Oct up 2.4% for the first 20 days as per ITS.
For today (Monday, Oct 27), traders will see if the bears can create more follow-through selling.
Or will the bulls be able to create a pullback near the 20-EMA instead?
Andrew

24/5/25 Will The Weekly Candlestick Close Bearish or Neutral?
Thursday’s candlestick (Oct 23) was a bull bar closing near its high with a long tail below and trading below the 20-day EMA.
In our last report, we said traders would observe whether the bears could create follow-through selling below the 20-day EMA, or if the market would trade slightly lower but stall, reversing to retest the 20-day EMA instead.
The market traded lower, but formed a rally in the last 2 hours (following the rally in Crude Oil and SBO) and is still trading below the 20-day EMA.
The bulls see the current move as another pullback.
They want the September 30 or September 23 low areas to act as support.
They want a reversal from a large double bottom bull flag (September 23 and October 23 lows) and want the market to reverse back above the 20-day EMA.
They must create strong consecutive bull bars trading above the 20-day EMA to show they are back in control.
They want Friday's candlestick to be a strong bull bar so that the weekly candlestick will have a bull body and close above the 20-week EMA.
The bears see the recent (Oct 9) move as a buy vacuum retest of the August high.
They want a reversal from a double top bear flag (Aug 19 and Oct 9), a lower high major trend reversal (Oct 9), as well as a larger double top bear flag with the February high on the larger time frame.
They see last Friday's rally (Oct 17) forming a lower high and Tuesday (Oct 21) forming a micro double top (Oct 17 and Oct 21).
They want the market to reverse below the 20-day EMA. They got what they wanted.
If the market trades higher, they want the 20-day EMA or the October 17 high to act as resistance, followed by a 3rd leg sideways to down.
The bears must create sustained follow-through selling trading far below the 20-day EMA and the September 23 low to increase the odds of a deeper pullback.
They want a strong bear bar today so that the weekly candlestick will close near its low and below the 20-week EMA.
Production: SPPOMA's first 20 days increased up 2.7%.
Refineries' appetite to buy remains decent.
Export: Oct up 2.4% for the first 20 days as per ITS.
For today (Friday, Oct 24), traders will see if the bears can create a bear bar closing near its low. If they get that, the weekly candlestick will close near its low, which will increase the odds of next week trading at least a little lower.
Or will the bulls be able to create a bull bar instead? If this is the case, the weekly candlestick will close above the 20-week EMA with a long tail below, and possibly with a bull body. This will reduce the recent bearishness.
Andrew
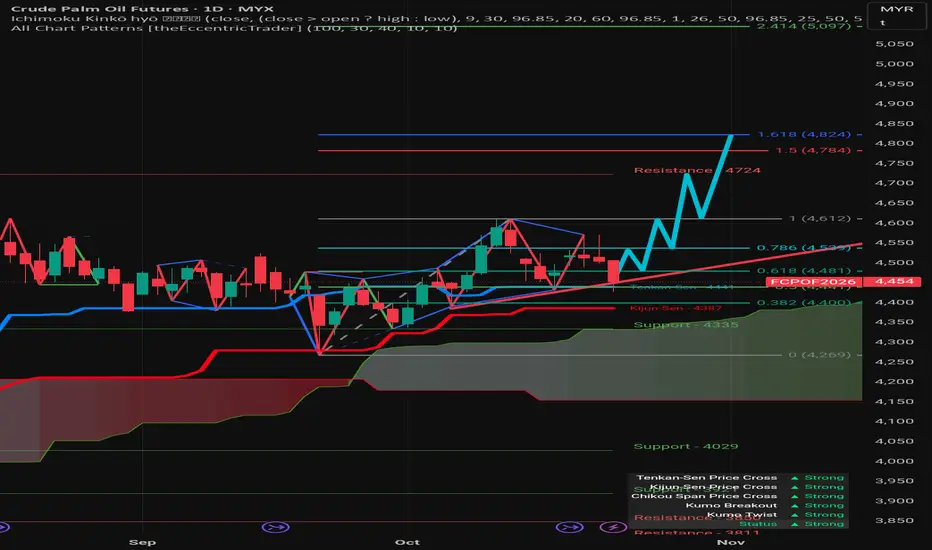
Strong bullish environmentTenkan-Sen (Conversion Line - Blue): 4,441
Kijun-Sen (Base Line - Red): 4,287
Kumo (Cloud): The shaded area that acts as a dynamic support/resistance zone. The current price is trading above the upper edge of the cloud (Senkou Span A/B), which is generally bullish.
Chikou Span (Lagging Span - Green): The closing price shifted back in time, used to confirm the trend's momentum.
Immediate Resistance: 4,527 (The 0.786 Fibonacci retracement level, which appears to have recently acted as a minor reversal point).
Key Resistance (Recent High): 4,724 (This is the high of the recent upward move).
Fibonacci Extension Targets:
1(4,784)
1.618(4,824) (This level is often a strong target for trend continuation).
2.414(5,097) (A longer-term, more ambitious target).
Support
Ichimoku/Fibonacci Support: 4,400 (0.382 Fibonacci retracement level, near the Tenkan-Sen).
Strong Support (Kijun-Sen): 4,287
Mid-Term Support (Below Kijun-Sen): 4,335
Cloud Support: The cloud itself (Kumo) provides a broad support area.
Potential Lower Support: 4,269 (0 Fibonacci level, corresponding to a previous swing low).
Long-Term Support: 4,029 (Marked as a significant previous low).
Strong Resistance/Support Zone (Lower): 3,811 (Marked as a previous resistance level, suggesting it could act as strong support if tested).
Trade Signals (Ichimoku Confirmation)
The table at the bottom suggests a strong bullish environment:
The price is currently in a pullback phase, testing the lower support areas within the context of this strong upward trend.
FCPO Week 43 2025: Consolidation or bearish to 4300?Happy Deepavali!
Price has shifted from bullish to a potential bearish. Momentum to go higher has been greatly reduced. A key reversal created on Friday could be the Lower High for a bearish move.
There is a potential of double top. Still early since it is yet to confirm. If price can break and close below 4490 then bearish could go and test 4300. Price will confirm double top once if break below 4270 area.
If there is no momentum this week then another consolidation is expected with a view for a break to a lower price.
Happy trading.

Strong downtrend, price has broken below several support levels.The price is well below the Kumo (cloud), which is a strong bearish signal.
The Kijun-Sen (Base Line) is at 4,405 and the Tenkan-Sen (Conversion Line) is below it, suggesting bearish momentum.
The Chikou Span (Lagging Span) is below the price from 26 periods ago, confirming the bearish trend.
The downtrend line and a minor level around 4,240 (2.414 Fibonacci extension). A significant resistance level is marked near 4,452.
A support level is marked at 4,163.
Significant potential support zones:
4,097 - 4,117 (a cluster of Fibonacci extensions).
4,000 (a major psychological support level, marked as "Support - 4000").
The lowest identified support/resistance is at 3,953.
Bollinger Bands (BB): The price is trading outside or near the lower band, indicating high volatility and potential oversold conditions, although in a strong trend, this can persist.
Pattern: A small Flag pattern (bearish continuation pattern) was indicated around late October, which has now been broken to the downside, reinforcing the bearish move.
The overall technical outlook is strongly bearish ("Status: Weak" according to the Ichimoku summary). The price action suggests a likely continuation towards the next major support level at 4,000 MYR.

3/11/25 - Nov Likely to Trade at Least a Little Lower
Friday’s candlestick (Oct 31) was a bear bar closing near its low.
In our previous report, we noted that the bulls wanted a strong bull bar to form a weekly candlestick with a long tail below, reducing the week’s bearishness. Conversely, the bears wanted a strong bear bar to confirm control and close the week strongly bearish.
The market traded lower, and the weekly candlestick indeed closed as a strong bear bar near its low.
The bulls hope the current move is simply a deep pullback.
They want to see a failed breakout below the September 23 low.
To show they’re regaining control, the bulls must now produce strong consecutive bull bars breaking clearly above the bear microchannel.
The bears, on the other hand, wanted follow-through selling below the September low — and they got it.
The current move has formed a 9-bar bear microchannel, signaling strong bears and persistent selling pressure.
The first pullback will likely be minor, followed by at least a small sideways-to-down leg retesting the current low (Oct 31 low).
The bears’ measured-move target, based on the height of the prior trading range, projects toward the 4000–3950 area.
Production: October output likely increased; November figures are yet to be announced.
Refineries: Buying interest remains, though slightly less enthusiastic.
Exports: October exports rose 5.19%, according to ITS.
Overall, the market is breaking out from an 11-week trading range in a persistent 9-bar bear microchannel — evidence of strong selling momentum.
The market remains Always-In-Short.
For Monday (Nov 3), traders will watch whether the bulls can produce a minor pullback and a few decent bull bars in the days ahead, or if the bears will extend their follow-through selling.
For now, odds still slightly favor the first pullback being minor, with sellers likely waiting above the bear microchannel.
Andrew

FCPO Week 45 2025: Retrace or consolidation to continue bearish.Bearish overall. However there is a sign of bearish exhaustion.Price making swing lows but the momentum has declined thus signalling that price might retrace before resuming lower. However looking at 15m chart this retracement is not started yet. Still no higher low or higher high yet. Monday session might give a bit more idea. Retracing towards 4300 is possible but next week would probably where price going into consolidation then retracement before continuing lower.
Happy hunting!

31/10/25 Bulls Want PB, First PB Likely Minor
Yesterday's candlestick (Thursday, October 30) was an inside bull doji closing in its lower half with a long tail above.
In our last report, we said traders would observe whether the bulls could create a decent minor pullback attempt, or if any pullback would be weak (long tails above candlestick, closing below its lower half, lacking follow-through buying), and the bears continue to get follow-through selling.
The market formed a small pullback but did not trade above the prior day's high.
The bulls see the current move as a deep pullback.
They want the September 23 low areas to act as support, forming a large double bottom bull flag (September 23 and October 29 lows).
They want a failed breakout below the September 23 low.
They must create strong consecutive bull bars breaking strongly above the bear microchannel to show they are back in control.
The bears want strong follow-through selling below the September low sometime this week. They got what they wanted.
The current move is in the form of an 8-bar bear microchannel, indicating strong bears and persistent selling.
The first pullback would likely be minor, followed by at least a small sideways to down leg to retest the current low extreme (currently the Oct 29 low).
The bears must create sustained follow-through selling trading below the September 23 low to increase the odds of a reversal.
Production: SPPOMA's first 25 days increased by +2.78%.
Refineries' appetite to buy is there, slightly less enthusiastic.
Export: Oct down 0.36% for the first 25 days as per ITS.
The bulls want a strong bull bar today, which will create a weekly candlestick with a long tail below, reducing the week's bearishness.
The bears want a strong bear bar today to create a strong bear bar on the weekly chart. If this is the case, odds will favor next week trading at least a little lower.
Today (Friday, Oct 31), traders will see whether the bulls can mount a decent minor pullback attempt.
Or will any pullback be weak (long tails above candlestick, closing below its lower half, lacking in follow-through buying), followed by the bears continuing to get follow-through selling in the days ahead?
For now, odds slightly favor the first pullback to be minor and sellers above the bear microchannel.
Andrew

29/10/25 Bears Want Close Below September 23 Low
Yesterday's candlestick (Tuesday, October 28) was another bear bar closing near its low with a small tail below.
In our last report, we said traders would observe whether the bears could create more follow-through selling, or if the bulls could create a pullback instead.
They continue to create follow-through selling, testing the September 23 low.
The bulls see the current move as another pullback.
They want the September 23 low areas to act as support, forming a large double bottom bull flag (September 23 and October 29 lows).
They must create strong consecutive bull bars to show they are back in control.
The bears want strong follow-through selling below the 20-day EMA, with a break below the September low sometime this week. So far, this is the case.
The current move is in the form of a 6-bar bear microchannel, indicating strong bears and persistent selling. There may be sellers above the first pullback.
If the market trades higher, they expect at least a small sideways to down leg to retest the current leg extreme low (currently Oct 29 low).
The bears must create sustained follow-through selling trading below the September 23 low to increase the odds of a reversal.
Production: SPPOMA's first 25 days increased by +2.78%.
Refineries' appetite to buy remains decent.
Export: Oct down 0.36% for the first 25 days as per ITS.
For today (Wednesday, Oct 29), traders will see if the bears can create more follow-through selling and close below the October 23 low.
Or will the market trade lower, but close with a long tail or a bull body instead?
For now, if there is a small bounce, odds slightly favor sellers above the bear microchannel.
Andrew
28/10/25 Will Bears Get More FT or Can Bull Create Minor PB?
Yesterday's candlestick (Monday, October 27) was a bear bar closing in its lower half with a small tail below.
In our last report, we said traders would observe whether the bears could create more follow-through selling, or if the bulls would be able to create a pullback near the 20-EMA.
They managed to create follow-through selling, testing the September 30 low area.
The bulls see the current move as another pullback.
They want the September 30 or September 23 low areas to act as support, forming a large double bottom bull flag (September 23 and October 23 lows).
They want the market to reverse back above the 20-day EMA.
They must create strong consecutive bull bars to show they are back in control.
The bears want strong follow-through selling below the 20-day EMA, with a break below the September low sometime this week.
The current move is in the form of a 5-bar bear microchannel, which means strong bears and persistent selling. There may be sellers above the first pullback.
If the market trades higher, they want the 20-day EMA to act as resistance, forming a lower high, followed by a 3rd leg sideways to down.
The bears must create sustained follow-through selling trading below the September 23 low to increase the odds of a reversal.
Production: SPPOMA's first 25 days increased by +2.78%.
Refineries' appetite to buy remains decent.
Export: Oct down 0.36% for the first 25 days as per ITS.
For today (Tuesday, Oct 28), traders will see if the bears can create more follow-through selling.
Or will the bulls be able to create a pullback instead?
For now, if there is a small pullback, odds slightly favor sellers above the bear microchannel.
Andrew

23/10/25 Bears Need FT Selling Below 20-Day EMA
Wednesday’s candlestick (Oct 22) was a bear bar closing in its lower half and closing below the 20-day EMA.
In our last report, we stated that traders would observe whether the bears could create follow-through selling below the 20-day EMA or if the 20-day EMA would continue to act as support, followed by a retest of the October 9 highs in the days ahead.
The market traded lower, and the bears managed to get a bear bar closing below the 20-day EMA.
The bulls see the current move as another pullback.
They want the September 30 or September 23 low areas to act as support.
They want a reversal from a large double bottom bull flag (with Sept 23 low) and want the market to reverse back above the 20-day EMA.
They must create strong consecutive bull bars to show they are back in control.
The bears see the recent (Oct 9) move as a buy vacuum retest of the August high.
They want a reversal from a double top bear flag (Aug 19 and Oct 9), a lower high major trend reversal (Oct 9), as well as a larger double top bear flag with the February high on the larger time frame.
They see last Friday's rally (Oct 17) forming a lower high and Tuesday (Oct 21) forming a micro double top (Oct 17 and Oct 21).
They want the market to reverse below the 20-day EMA. They got what they wanted.
The bears must create sustained follow-through selling trading far below the 20-day EMA and the September 23 low to increase the odds of a deeper pullback.
Production: SPPOMA's first 20 days increased up 2.7%.
Refineries' appetite to buy remains decent.
Export: Oct up 2.4% for the first 20 days as per ITS.
So far, the market has closed below the 20-day EMA on Wednesday.
For today (Thursday, Oct 23), traders will see if the bears can create follow-through selling below the 20-day EMA. If the bears can get sustained follow-through selling in the next few trading sessions, the odds a deeper pullback will increase.
Or will the market trade slightly lower but stall, reversing to retest the 20-day EMA instead?
Andrew

22/10/25 Bears Need FT Selling Below 20-Day EMA
Tuesday’s candlestick (Oct 22) was a bear doji closing near its low with a long tail above and closing around the 20-day EMA.
In our last report, we stated that traders would watch to see if the bears could create follow-through selling below the 20-day EMA, and if the 20-day EMA would continue to act as support, followed by a retest of the October 9 highs in the days ahead.
The market traded slightly higher in the morning session, forming a micro double top with the October 17 high, but reversed to close near its low of the day.
The bulls see the recent move (Oct 15) as a pullback and want the 20-day EMA to act as support.
They hope to get a retest of the October 9 high, even if it only forms a lower high. So far, the retest is a lower high (Oct 17).
They must create strong consecutive bull bars to increase the odds of the market trading higher.
The bears see the recent (Oct 9) move as a buy vacuum retest of the August high.
They want a reversal from a double top bear flag (Aug 19 and Oct 9), a lower high major trend reversal (Oct 9), as well as a larger double top bear flag with the February high on the larger time frame.
They see last Friday's rally (Oct 17) forming a lower high and yesterday (Oct 21) forming a micro double top (Oct 17 and Oct 21).
They want the market to reverse below the 20-day EMA.
The bears must create strong consecutive bear bars trading far below the 20-day EMA to increase the odds of a deeper pullback.
Production: SPPOMA's first 20 days increased up 2.7%.
Refineries' appetite to buy remains decent.
Export: Oct up 2.4% for the first 20 days as per ITS.
So far, the market traded below the 20-day EMA during Tuesday night's session.
For today (Wednesday, Oct 22), traders will see if the bears can create some follow-through selling below the 20-day EMA.
Or will the 20-day EMA continue to act as support, followed by a retest of the October 9 highs in the days ahead?
Andrew

21/10/25 Can The Bears Create FT Selling Below 20-Day EMA?
Friday’s candlestick (Oct 17) was a bear doji closing in its lower half with a long tail above and closing above the 20-day EMA.
In our last report, we said traders would watch if bulls could create a strong bull bar, closing the weekly candlestick with a bull body. Or, if bears could create a strong bear bar, perhaps closing below the 20-day EMA.
The bulls could not create a bull bar, but the bears could not create a close below the 20-day EMA either. The weekly candlestick closed with a bear body.
The bulls see the recent move (Oct 15) as a pullback and want the 20-day EMA to act as support.
They hope to get a retest of the October 9 high, even if it only forms a lower high. So far, the retest is a lower high (Oct 17).
They must create strong consecutive bull bars to increase the odds of the market trading higher.
This point is already stated in paragraph 3. Remove here to avoid repetition.
The bears see the recent (Oct 9) move as a buy vacuum retest of the August high.
They want a reversal from a double top bear flag (Aug 19 and Oct 9), a lower high major trend reversal (Oct 9), as well as a larger double top bear flag with the February high on the larger time frame.
They see Friday's rally (Oct 17) forming a lower high and want the market to reverse below the 20-day EMA.
The bears must create strong consecutive bear bars trading far below the 20-day EMA to increase the odds of a deeper pullback.
Production: SPPOMA's first 15 days increased up 6%.
Refineries' appetite to buy remains decent.
Export: Oct up 16% for the first 15 days as per ITS.
For tomorrow (Tuesday, Oct 21), traders will see if the bears can create some follow-through selling below the 20-day EMA.
Or will the 20-day EMA continue to act as support, followed by a retest of the October 9 highs in the days ahead?
Andrew

17/10/25 Can Bull Create Strong FT Buying or Fail to Do So?
Thursday’s candlestick (Oct 16) was another doji trading around the 20-day EMA.
In our last report, we stated that traders would observe whether the bulls could create a retest of the October 9 high in the next few days, even if it only forms a lower high, or if the bears would be able to create follow-through selling below the 20-day EMA.
The market continued to trade sideways around the 20-day EMA. During Thursday night's market, the market traded higher.
The bulls see the recent move (Oct 15) as a pullback and want the 20-day EMA to act as support.
They hope to get a retest of the October 9 high, even if it only forms a lower high.
They must create strong consecutive bull bars to increase the odds of the market trading higher.
They want today to close as a strong bull bar so that the weekly candlestick has a bull body and closes near its high.
The bears see the recent (Oct 9) move as a buy vacuum retest of the August high.
They want a reversal from a double top bear flag (Aug 19 and Oct 9), a lower high major trend reversal (Oct 9), as well as a larger double top bear flag with the February high.
They see Thursday night's rally (Oct 17) forming a lower high and want the market to reverse below the 20-day EMA.
The bears must create consecutive bear bars trading far below the 20-day EMA to increase the odds of a deeper pullback.
They want Friday to close as a strong bear bar so that the weekly candlestick will have a strong bear body.
Production: SPPOMA's first 15 days increased up 6%.
Refineries' appetite to buy remains decent.
Export: Oct up 16% for the first 15 days as per ITS.
For today (Friday, Oct 17), traders will see if the bulls can create a strong bull bar. If they do, the weekly candlestick will close with a bull body near its high. If this is the case, the market could still trade slightly higher next week.
Or will the bears be able to create a strong bear bar, perhaps closing below the 20-day EMA? If they do, it will reduce the recent bullishness.
Andrew
16/10/25 Currently Sideways Around 20-Day EMA
Wednesday’s candlestick (Oct 15) was an inside doji with prominent tails.
In our last report, we stated that traders would observe whether the bulls could create a retest of the October 9 high in the next few days, even if it only forms a lower high, or if the bears would be able to create follow-through selling below the 20-day EMA.
So far, the market is trading sideways slightly above the 20-day EMA.
The bulls see the current move as a pullback and want the 20-day EMA to act as support.
They hope to get a retest of the October 9 high, even if it only forms a lower high.
They must create strong consecutive bull bars to increase the odds of the market trading higher.
The bears see the recent (Oct 9) move as a buy vacuum retest of the August high.
They want a reversal from a double top bear flag (Aug 19 and Oct 9), a lower high major trend reversal (Oct 9), as well as a larger double top bear flag with the February high.
The bears must create consecutive bear bars trading far below the 20-day EMA to increase the odds of a deeper pullback.
Production: SPPOMA's first 10 days increased up 6%.
Refineries' appetite to buy remains decent.
Export: Oct up 16% for the first 15 days as per ITS.
For today (Thursday, Oct 16), traders will see if the bulls can create a retest of the October 9 high in the next few days, even if it only forms a lower high.
Or will the bears be able to create follow-through selling below the 20-day EMA? If they do, especially it is strong, it could swing the odds for a deeper pullback moving forward.

15/10/25 Retest Oct 9 High or FT Selling Below 20-Day EMA?
Tuesday’s candlestick (Oct 14) was a bear bar closing near its low with a long tail above.
In our last report, we stated that traders would observe whether the bulls could create a strong retest of the October 9 high in the next few days, or if the move would lack sustained follow-through buying and stall at a lower high.
The market traded higher but reversed into a bear bar, closing below the 20-day EMA.
The bulls see the current move as a pullback and want the 20-day EMA to act as support.
They hope to get a retest of the October 9 high, even if it only forms a lower high.
They must create strong consecutive bull bars to increase the odds of the market trading higher.
The bears see the recent (Oct 9) move as a buy vacuum retest of the August high.
They want a reversal from a double top bear flag (Aug 19 and Oct 9), a lower high major trend reversal (Oct 9), as well as a larger double top bear flag with the February high.
The bears must create consecutive bear bars trading far below the 20-day EMA to increase the odds of a deeper pullback.
Production: SPPOMA's first 10 days increased up 6%.
Refineries' appetite to buy remains decent.
Export: Oct up 9% for the first 10 days as per ITS.
For today (Wednesday, Oct 15), traders will see if the bulls can create a retest of the October 9 high in the next few days, even if it only forms a lower high.
Or will the bears be able to create follow-through selling below the 20-day EMA? If they do, especially it is strong, it could swing the odds for a deeper pullback moving forward.
Andrew
14/10/25 Can Bulls Create Strong Retest of Oct 9 High?
Monday’s candlestick (Oct 13) was a bear bar closing in its upper half with a long tail below.
In our last report, we stated that traders would observe whether the bears could create a follow-through bear bar, even if it is only a bear doji, or if the bulls would be able to completely reverse the Friday pullback instead.
The market traded lower to test the 20-day EMA, and the bears created some follow-through selling, albeit not yet strong (long tail below the candlestick).
The bulls got a retest near the August high (Oct 9).
They see the current move as a pullback and want the 20-day EMA to act as support.
They hope to get a retest of the October 9 high, even if it only forms a lower high.
They must create a strong breakout above the August high, accompanied by follow-through buying, to increase the odds of the market trading higher.
The bears see the recent (Oct 9) move as a buy vacuum retest of the August high.
They want a reversal from a double top bear flag (Aug 19 and Oct 9), a lower high major trend reversal, as well as a larger double top bear flag with the February high.
They see the current move as a retest of the October 9 high and want it to form a lower high.
The bears must create consecutive bear bars to increase the odds of a deeper pullback.
Production: SPPOMA's first 10 days increased up 6%.
Refineries' appetite to buy remains decent.
Export: Oct up 9% for the first 10 days as per ITS.
For today (Tuesday, Oct 14), traders will see if the bulls can create a strong retest of the October 9 high in the next few days.
Or will the move lack sustained follow-through buying instead, stalling at a lower high?
Andrew
13/10/25 Can Bears Create FT Selling or Retest High Instead?
Friday’s candlestick (Oct 10) was an outside bear bar closing in its lower half with prominent tails.
In our last report, we stated that traders would observe whether the bulls can create another strong bull bar or if the bears are able to create a bear bar instead.
The market traded higher but lacked follow-through buying and reversed into a bear bar. The weekly candlestick closed with a prominent tail above.
The bulls got a retest near the August high.
They want a breakout above the August high, followed by a resumption of the trend.
They must create a strong breakout above the August high, accompanied by follow-through buying, to increase the odds of the market trading higher.
If the market trades lower, they want the 20-day EMA to act as support.
The bears see the current move as a buy vacuum retest of the August high.
They want a reversal from a double top bear flag (Aug 19 and Oct 10), as well as a larger double top bear flag with the February high.
The bears must create consecutive bear bars to increase the odds of a deeper pullback.
If the market trades higher, they want a failed breakout above the August high.
Production: fSPPOMA's first 5 days increased up 12%.
Refineries' appetite to buy remains decent.
Export: Oct up 9% for the first 10 days as per ITS.
For today (Monday, Oct 13), traders will see if the bears can create a follow-through bear bar, even if it is only a bear doji.
Or will the bears be able to completely reverse the Friday pullback instead?
Andrew
FCPO Week 42 2025: Bullish to 4700?Does price ready for the upside? It looks bullish at the moment. However there might be a retracement coming. A retracement to about 4460-4470 area should create another movement higher.
Happy trading and good luck.