Liquidity Zones Explained: Where Smart Money GoesMarkets don’t move randomly. Every candle, spike, or reversal happens for a reason and that reason is liquidity.
Liquidity is what fuels price movement. It’s where buy and sell orders are concentrated, and where large players execute positions without showing their hand.
Understanding where liquid
Related futures

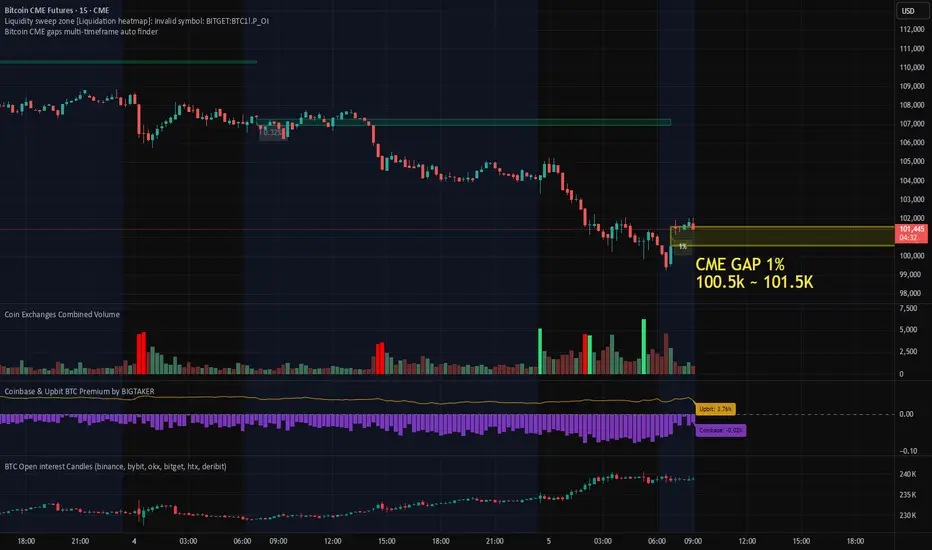
1% Bitcoin CME Gap Formed, Futures Market Data AnalysisThis morning, a ~1% gap formed on the Bitcoin CME futures chart.
Given that the gap occurred after a sharp decline, it’s important to consider the possibility of both a gap fill and a retest of recent lows in the short term.
The Coinbase Premium remains in negative territory, though it has shown sl
Bitcoin: from Pet Rock to Loan CollateralCME: Micro Bitcoin Futures ( CME:MBT1! ) and Micro Ether Futures ( CME:MET1! )
Last week, JPMorgan Chase Chairman and CEO Jamie Dimon acknowledged that crypto, blockchain, and stablecoins are "real”, and “we’ll all use them". This marks a notable shift in tone from the longtime Bitcoin critic.
I

Bitcoin Technical Breakdown: Bearish Signals BuildingToday we’re taking a closer look at Bitcoin, which is showing increasingly negative technical signals across multiple timeframes. Let’s break it down:
Daily Chart: Confirmed Downtrend
• Bitcoin is now technically in a down move, defined by a sequence of lower reaction highs and lower reaction lows

BTC1! : Possible move to the CME Gapfill at 92kDouble top with a measured target close to the CME Gap at 92k.
There could be a wick down close to this area to close the gap and release stuck liquidity before the uptrend continues,

Bitcoin Bounce Underway, But Bears May Not Be Done YetMy initial 100k downside target has been reached. While we’re seeing the almost obligatory bounce from a key level, Bitcoin could still head towards 90k. I take a fresh look at Bitcoin futures and their correlation with Wall Street.
Matt Simpson, Market Analyst at City Index

The Double Bottom Trap That Traders Might Miss1. The Comfort Zone of Classic Patterns
Few formations attract traders’ attention like a double bottom. It’s one of those timeless chart patterns that promise hope after a long decline—a visual story of selling exhaustion followed by a bullish reversal.
But markets rarely reward what’s obvious. I

BTC CME CHART INDICATES A BEARISH NOVEMBER GOING BELOW 100K BTC has two bullish CME gap unfilled, very possible the banks and governments want to liquidated traders, but the only way to the bulls below the market has to go the market will have to go back below 100K,The easy algo and other technicals indicate the the market may push to the the all time high

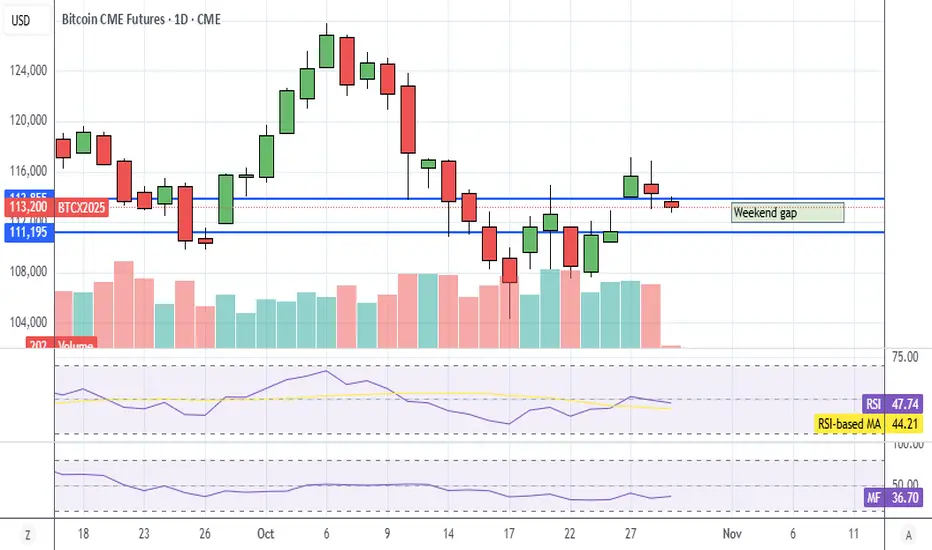
BTC Weekend Gap FillApparently futures don't like big crypto gaps, futures gaps tend to fill.
Algos punishing crypto for pumping on a weekend, which caused a big gap on Sunday open. I was kinda surprised BTC went up on Sat and Sun.
Anyways, too late to trade it now, but for future reference.
Why I'm Suspicious Of This Bitcoin BounceThe rebound in bitcoin I warned about last week has come to fruition. Yet despite its recovery above the 200-day EMA, I remain bearish on the higher timeframes. Looking at bitcoin futures, I explain why I think bears are lurking above and may be happy to fade into rallies towards 120k.
Matt Simpson

See all ideas
A representation of what an asset is worth today and what the market thinks it will be worth in the future.
Displays a symbol's price movements over previous years to identify recurring trends.
Frequently Asked Questions
The nearest expiration date for Micro Bitcoin Futures (Dec 2024) is Dec 27, 2024.
Traders prefer to sell futures contracts when they've already made money on the investment, but still have plenty of time left before the expiration date. Thus, many consider it a good option to sell Micro Bitcoin Futures (Dec 2024) before Dec 27, 2024.