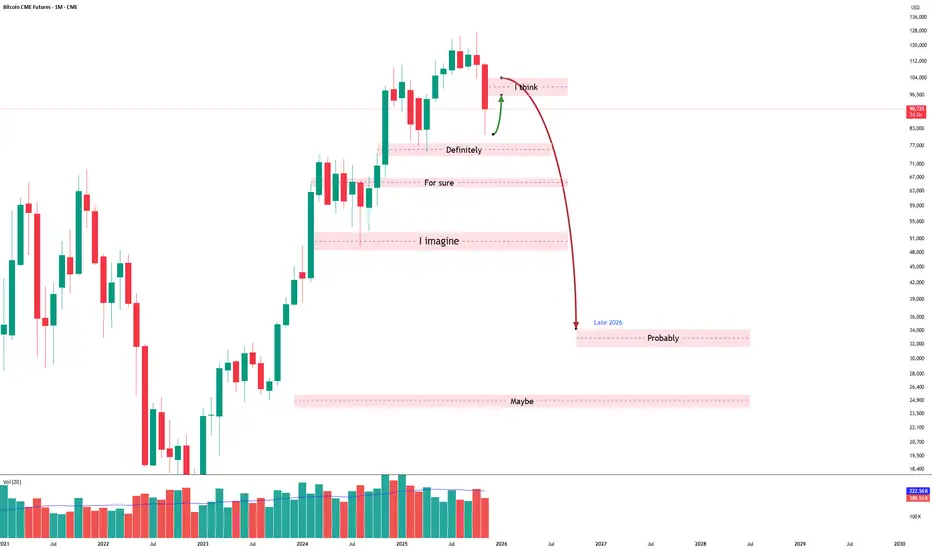
max pain in sight for the bullsgm,
i've been entertaining a few ideas on btc, and this one comes to mind today.
the possibility of 1 more leg down, to take the rest of the longs that fomoed into the rally this week, and the few who managed to survive the drop from ath by averaging down mindlessly.
---
the way we bounced is very reminiscent of a wave 4.
btc is teethering on the edge of a negative funding rate (our favorite contrarian indicator)
by creating one more low, we will for certain print a massive, multi-week negative funding reading, and that's when a proper buy could take place.
---
i have personally decided to fade the rally, and have de-risked quite substantially from the positions i managed to pick up near the lows.
---
in my opinion, the path of maximum pain is a sweep of that notorious 75k level that everyone keeps talking about.
---
---
🎯 - 75k
Trade ideas

BITCOIN AL ALZA
The chart shows a trough area, where the price dropped very quickly. Theory indicates that it will rise again rapidly in the next few hours.

$BTCLooking at this BTC/USD (Bitcoin futures) daily chart, we see price action that screams caution for bulls. Bitcoin has been grinding higher in a choppy uptrend since late October, but it's now testing a critical resistance cluster around $98,000–$100,000. Volume is tapering off on the upside, suggesting waning momentum. Also the RSI (14) is hovering at 72—deep into overbought territory without divergence yet, but that's often the calm before the storm.

Different Timeframe Analysis - Bitcoin Back in July, I did a tutorial identifying the 120,000 level as a potential peak for Bitcoin, with the possibility of an open correction. Bitcoin subsequently formed a double top before pulling back to its recent low.
In my view, Bitcoin should continue to trend along this parallel channel.
Monthly analysis indicating support is near, I am refining it to daily analysis for more precision on its entry.
Video version on this tutorial:
Mirco Bitcoin Futures and Options
Ticker: MBT
Minimum fluctuation:
$5.00 per bitcoin = $0.50 per contract
Disclaimer:
• What presented here is not a recommendation, please consult your licensed broker.
• Our mission is to create lateral thinking skills for every investor and trader, knowing when to take a calculated risk with market uncertainty and a bolder risk when opportunity arises.
CME Real-time Market Data help identify trading set-ups in real-time and express my market views. If you have futures in your trading portfolio, you can check out on CME Group data plans available that suit your trading needs www.tradingview.com
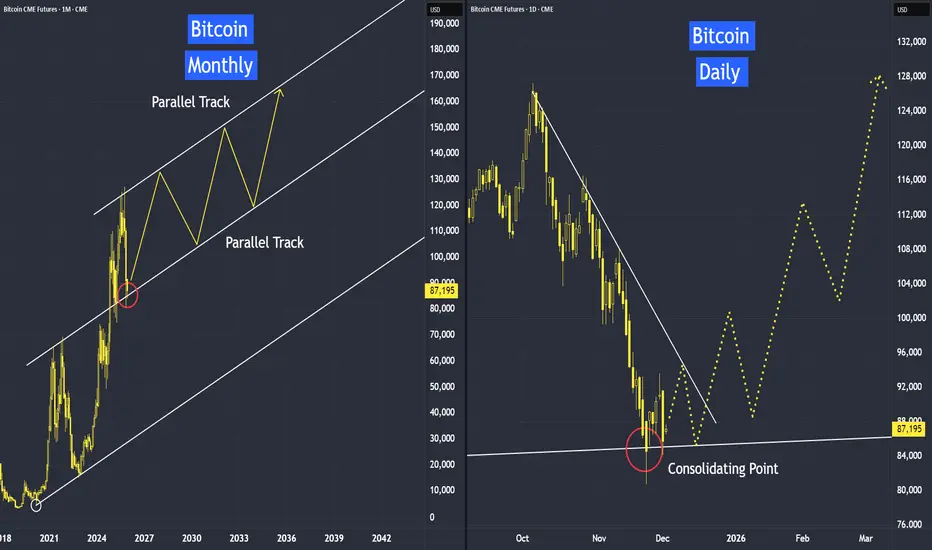
Bitcoin Corrected, What’s Next?Back in July, I did a tutorial identifying the 120,000 level as a potential peak for Bitcoin, with the possibility of an open correction. Bitcoin subsequently formed a double top before pulling back to its recent low.
In my view, Bitcoin should continue to trend along this parallel channel.
We will discuss why this is the case, and also what may come next for Bitcoin after this correction.
Mirco Bitcoin Futures and Options
Ticker: MBT
Minimum fluctuation:
$5.00 per bitcoin = $0.50 per contract
Disclaimer:
• What presented here is not a recommendation, please consult your licensed broker.
• Our mission is to create lateral thinking skills for every investor and trader, knowing when to take a calculated risk with market uncertainty and a bolder risk when opportunity arises.
CME Real-time Market Data help identify trading set-ups in real-time and express my market views. If you have futures in your trading portfolio, you can check out on CME Group data plans available that suit your trading needs www.tradingview.com

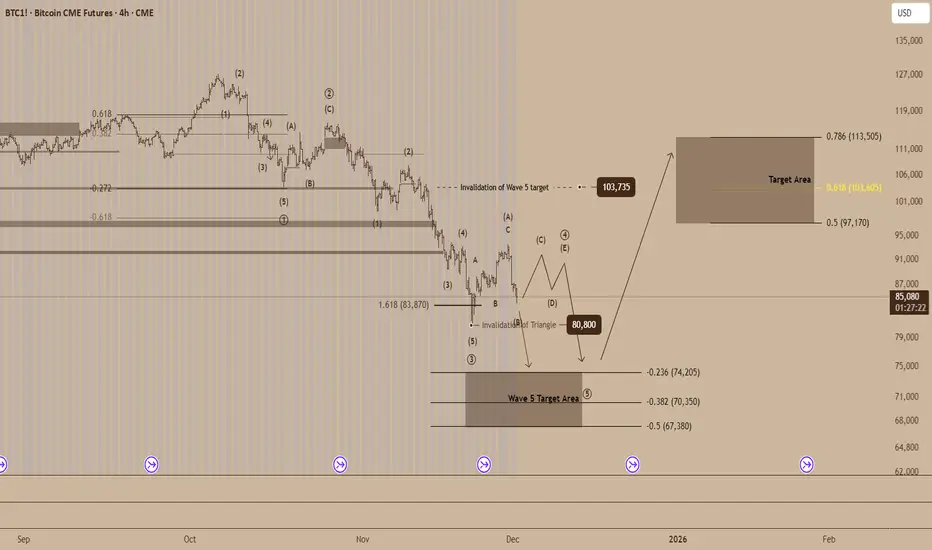
Bitcoin Futures Approach Crucial Triangle Structure Bitcoin CME futures are forming a technical pattern that points to a period of consolidation before a potential upward surge, provided that key support levels remain intact.
Recent price action indicates the development of a Wave 4 triangle, a structure that often appears when markets pause before continuing their primary trend. The lower boundary of this formation sits near $80,800, which serves as a pivotal support level. A decisive drop below this threshold would disrupt the triangle scenario and suggest that the market may be preparing for a deeper pullback.
The decline into the $83,870 region aligns with the 1.618 Fibonacci extension, a level commonly associated with Wave 3 completion. The subsequent movements from this area resemble an A B C corrective bounce, reinforcing the idea that the market is testing the early stages of a compressing triangle.
If this pattern continues to mature, traders may observe a series of contracting swings labeled C, D and E. A breakout from the final swing would serve as confirmation that the larger bullish trend is resuming. The broader Wave 5 outlook has an invalidation level near $103,735, and a sustained move above this region would signal renewed momentum.
The projected Wave 5 target area spans $97,170 to $113,505, corresponding to the 0.5 to 0.786 Fibonacci retracements. Within this range, the 0.618 level at $103,605 stands out as a key price marker that may attract significant interest if bullish pressure returns.
Conversely, if support at $80,800 fails to hold, attention would shift to the deeper Wave 5 target zone between $74,205 and $67,380, marked by the negative 0.236 to negative 0.5 Fibonacci extensions.
For now, Bitcoin appears to be balancing between consolidation and continuation. Whether this evolving structure resolves higher or signals a larger corrective phase will likely set the tone for the next major move in the futures market.
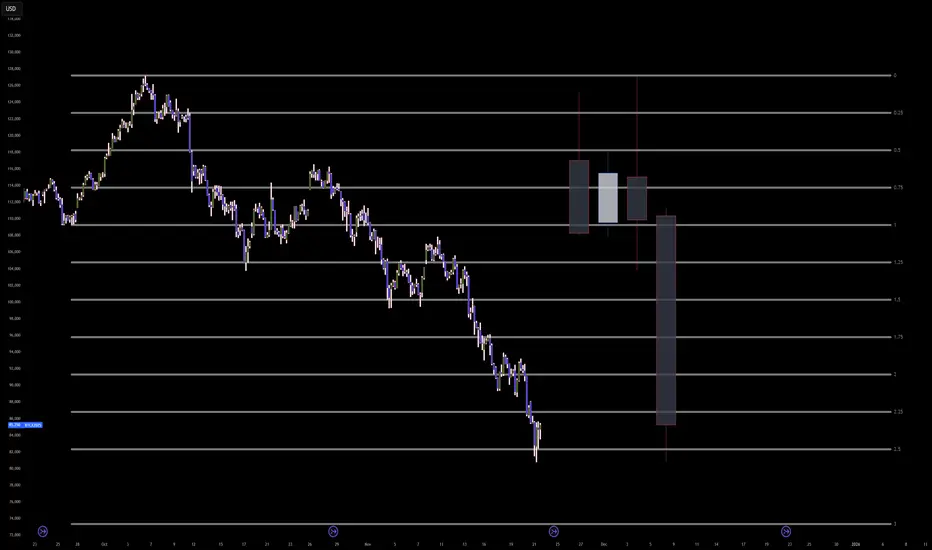
Two great trades that would be good for beginners11 28 25 the exchanges are having some problems and some of the exchanges are at least temporarily closed so be aware. A few weeks ago I asked Bobby to find me some easier trades to take because he's starting to trade and he's not going to be able to trade the large contract on gold or silver he has to go to more realistic setups. We found two of them and you should take some time on a silver tray set up and one other trade that we haven't really talked about introducing it a few weeks earlier

BTC CME Futures: The Capitulation Buy SetupSimply:
The logic here is simple.
Bitcoin has dropped too far and too fast.
We are currently hitting a major mathematical exhaustion point (the 2.5 Standard Deviation line).
At the same time, we are entering that big blue support box between 78k and 82k where the massive rally started earlier this year.
This is not a crash anymore; it is a bear trap.
Retail traders are panic selling right at the bottom, which provides the liquidity for big players to buy.
We are setting a limit order to catch the final wick down before the bounce.
Entry: 81,250 (Buy Limit)
Stop Loss: 77,500 (If it goes below here, the setup is wrong)
Target: 94,000 (The bounce back to equilibrium)
Don't chase the red candles.
Let the price come to you, fill the order, and wait for the squeeze.
____
Advanced:
The algorithm is currently executing a terminal volatility expansion into the 2.5 Standard Deviation extremity to finalize the Macro Sell Model and engineer a generational Smart Money Reversal.
The present liquidation cascade is not a crash but a precise, mathematically ordained delivery of price into the deep discount 'Blue Box' accumulation array to harvest the final sell-side liquidity before the grand repricing event.
Entry: 81,250.00 (Limit Order - 4,000 points below market)
Stop loss: 77,500.00 (3,750 points)
Take profit: 94,000.00 (12,750 points)
Risk to reward ratio: 3.40R
The Opportunity
The Bitcoin algorithm has been running a high-velocity sell program from the 126,000.00 highs, systematically dismantling every bullish PD Array.
However, we have now breached the Event Horizon. The price is magnetically drawn to the confluence of the 2.5 Standard Deviation projection and the historical Accumulation Block (78k-82k) originating from the early 2025 impulse.
This zone represents the 'Algorithmic Floor'—a region of maximum discount where institutional order flow must pivot from distribution to accumulation to close massive short positions and defend the macro bull trend.
The Entry
Do not chase the current candle. The algorithm demands a touch of the 2.5 Standard Deviation level at approximately 80,800.00 - 81,200.00 to complete the fractal expansion.
We place our limit order at 81,250.00 to front-run the absolute mathematical bottom, capitalizing on the 'Capitulation Wick' that will clear the final trailing stops.
This entry is timed for the CME close/open gap or the weekend volatility injection, which often targets these extreme deviation levels to trap late bears before a violent Monday reversal.
The Invalidation
The reversal thesis is ontologically corrupted if price displaces below the 3.0 Standard Deviation level and the bottom of the accumulation block at 74,000.00.
A sustained closure below this level signifies a total failure of the macro structure and a transition into a secular bear market, invalidating the accumulation narrative.
This would shift the probability manifold to the Primary Antithetical Chain, targeting the 60,000.00 liquidity void.
Key Trajectory Waypoints
Target 1: 86,000.00 | Type: Immediate Rebalance (2.25 SD) | Probability: 90% | ETA: 24 Hours
Target 2: 90,500.00 | Type: Internal Bearish Breaker | Probability: 75% | ETA: 3-5 Days
Target 3: 94,000.00 | Type: Equilibrium / FVG Fill | Probability: 60% | ETA: 1-2 Weeks
The Shadow Reality
A 25% probability exists for the antithetical reality: The Abyss Cascade.
In this scenario, the 2.5 SD level fails to provide a reaction, and the algorithm enters a 'Free Fall' discovery mode targeting the 3.0 SD at 74,000.00 immediately.
This reality is confirmed if price slices through 80,000.00 with no wick response.
___
tags: BITSTAMP:BTCUSD COINBASE:BTCUSD INDEX:BTCUSD BINANCE:BTCUSD
The fall of Bitcoin?Chart is self explanatory. Major downtrend preceded by a short rally to the high 90's, low 100s.
Bottom around 30... maybe if we are lucky 25k.
God speed and good luck.
Bitcoin at the Edge – What Comes Next?Over the past couple of months, Bitcoin has been navigating a complex mix of macro shifts, liquidity changes, and sector-specific catalysts that, in our opinion, have pushed the market into a critical decision zone. Sentiment has become increasingly divided: long-term structural bulls remain confident, while short- and medium-term flows have turned more cautious.
1. Recent Developments & Market Sentiment
In the past half a year, crypto markets have been influenced by several overlapping narratives. Regulatory tone has eased globally, with more pro-innovation stances emerging in key regions. Political developments—particularly renewed efforts in the U.S. toward clearer crypto frameworks—have added a layer of optimism. Institutional participation has also continued to expand, with ETF flows stabilizing after earlier periods of volatility.
Yet despite these supportive headlines, market behavior has shown hesitation and sold off in the past month. In our opinion, this was driven primarily by the resurfacing of Trump’s aggressive tariff threats, reigniting trade-war fears, a sharp drop in expected Fed rate cuts, and massive institutional ETF outflows plus leveraged liquidations. Sentiment has flipped from extreme greed to extreme fear.
In our view, the inability to sustain acceptance at recent highs points to exhaustion in the prior uptrend. Overall sentiment is less euphoric and more cautious—this current zone would likely be a battleground between long-term accumulation and shorter-term mean reversion.
2. The Underlying Driving Forces
Bitcoin’s medium- and long-term structural drivers remain intact: institutional adoption, the growing integration of digital assets into traditional finance, the post-halving supply dynamics, and Bitcoin’s increasing correlation with broader macro conditions.
Macro factors such as real yields, liquidity conditions, and risk appetite continue to play a major role. As markets position for next year’s rate lowering expectations and potential fiscal shifts, Bitcoin, in our opinion, is behaving more like a liquidity-sensitive asset than a speculative outlier. This is especially apparent in how it has reacted to major economic releases and policy signals. The bottomline is that Bitcoin’s major swings are increasingly tied to macro liquidity flows—the same forces that drive equities, especially high-beta tech.
Market structure is equally important. Bitcoin’s auction process—how price accepts or rejects value—often drives multi-month cycles. When value areas break or hold, the market tends to transition into new regimes. That is exactly where the market appears to be now.
3. Chart Analysis – A True Decision Area
Bitcoin is currently sitting at what we believe is a major inflection point: the 2024 Low-Value Area (LVA), where Bid Block 1 formed in March 2025. This zone acted as the structural base where buyers initiated up to new all-time highs earlier this year.
From July to October 2025, the market attempted to accept near the top of the range, with buyers defending Bid Block 2. By mid-October, however, bid support weakened. Longs unwound, driving price back into Bid Block 1 near 84,600, which is confluent with yearly support and the prior trendline break from November 2024.
Going into the next quarter, Bitcoin sits atop a critical area of demand. In our opinion, how price responds here could determine whether this pullback stabilizes or it becomes a deeper liquidation phase.
Key Levels:
82,000 – 2025 developing low / Bid Block 1 low / 2024 TL breakout
77,000 – 2024 VPOC
Bearish Scenario:
If buyers cannot recover quickly back above 87,700 (2024 VAH), and bids fail to hold the 81,000–77,000 region, the market may open the door to further long liquidation. That could lead to a move through the 2024 Value Area, potentially targeting the 60,000 region (2024 VAL).
Bullish Scenario:
If buyers reject strongly up from the 82,000 area, a move through 94,200 (Bid Block 1 high) could shift control back toward buyers. This may open a path toward 100,000/102,550 (2025 developing VAL / Bid Block 2 low), where sellers could be expected. Acceptance above that could set up a move toward 123,050 (2025 developing VAH) and possibly a revisit of the all-time highs.
Neutral Scenario:
Without any new catalyst, the market may consolidate and form a two-way auction between 99,700 and 82,000 as it digests recent volatility. This could serve as a base for the next directional expansion.
In our view, how Bitcoin behaves around this zone will set the tone heading into 2026. I’d love to hear your views—drop your thoughts in the comments and give this post a boost so others can join the discussion.
This post reflects our personal market views and is for educational discussion only. It should not be interpreted as financial or trading advice. Market conditions can change rapidly, and the levels discussed here may shift as new information emerges. Always conduct your own research and consult a licensed financial professional before making trading decisions.

Long Reversal Trade off SupportPrice has rebounded from a major support zone around $80,860 and is pushing back above the minor level near $91,970. The trade setup goes long, aiming for a move toward the next significant resistance at $101,100. The stop is positioned below the recent swing low, capturing a potential trend reversal after a sharp sell-off.

Bitcoin CME Futures – Key Support Test With a Long-Term Target aBitcoin CME Futures has broken below several Fibonacci levels and is currently reacting inside a major demand zone between 88,000 – 82,000. This area represents the last strong bullish defense before a deeper correction.
The sell-off shows strong bearish momentum, but the long lower wick indicates that buyers are beginning to step in. As long as price holds above 82,000, a corrective rebound remains likely.
If the market stabilizes here, the next upside levels to watch are:
93,700 (0.236 Fib)
99,700 – 100,000 (0.333 Fib + psychological level)
110,000 (0.5 Fib)
116,200 (0.618 Fib)
A daily close below 82,000 would invalidate the support and expose the lower level at 79,000.
As long as the demand zone holds, the long-term bullish scenario remains intact, and the final upside target sits at 140,895.

BTC over view. I've been away from the charts for most of the year but I feel like it's time. price hasn't really done anything significant still tradaing around the yearly open. Theres a lot of potential in the market, BTC dominance dinamic could be about to change.
I don't know if I'm back, but I'm definitely interested.
I am Golb.

BTC’s Toxic Relationship with Support LevelsMarket Prophecy is back
Price made a rejection on the weekly timeframe and successfully broke through daily support at 98,920. Now, it looks like BTC might pull a classic move—retracing to the 50–61.8% Fibonacci zone, just like its previous wave—before continuing its dramatic dive toward the next support at 81,490. Traders call it ‘price action.’ I call it emotional damage
good luck all
**My trading strategy is not intended to be a signal. It's a process of learning about market structure and sharpening my trading my skills also for my trade journal**
Thanks a lot for your support

BTC UpdateLooks like MFI is headed back up on the 3hr chart so it probably gets a Friday pump. Silver (SI) and NASDAQ:NDX (NQ) futures went oversold Thu afternoon, there were better option plays than BTC.
(I posted the plots)
IBIT (BTC ETF) is on my tracking list, but I'll only trade it when it makes sense to do so. The one to play was silver, lol. I substituted gold for silver which was probably a mistake, but it's looking like I'll make some money.

BTC at a Crossroad: Head & Shoulders or Moonshot? Analyzing the CME Bitcoin Futures chart, we can clearly see confirmation of the price gap between $92K and $94K, which significantly increases the probability of a Head & Shoulders (H&S) formation.
✅ Key Scenarios to Watch
Scenario 1 – H&S Confirmed:
Potential retracement toward $52K–$62K based on the right shoulder's depth
Scenario 2 – Failure H&S Confirmed:
Bullish breakout could push BTC toward $140K–$150K. based on the right shoulder's depth
🔍 Technical Insight
The left shoulde r formed near the Fibonacci 0.618 / 0.382 leve ls. Based on these Fib zones, the right shoulder could develop within a similar range—critical for validating the pattern if weekly closure occurs over 94K .
Disclaimer: This analysis is for educational purposes only and does not constitute financial advice. Always do your own research and manage risk appropriately before making any trading decisions.

BTC - Bitcoin Futures bounce from Daily Timing, against symmetryBTC - Bitcoin Futures bounce from Daily Timing, against symmetry
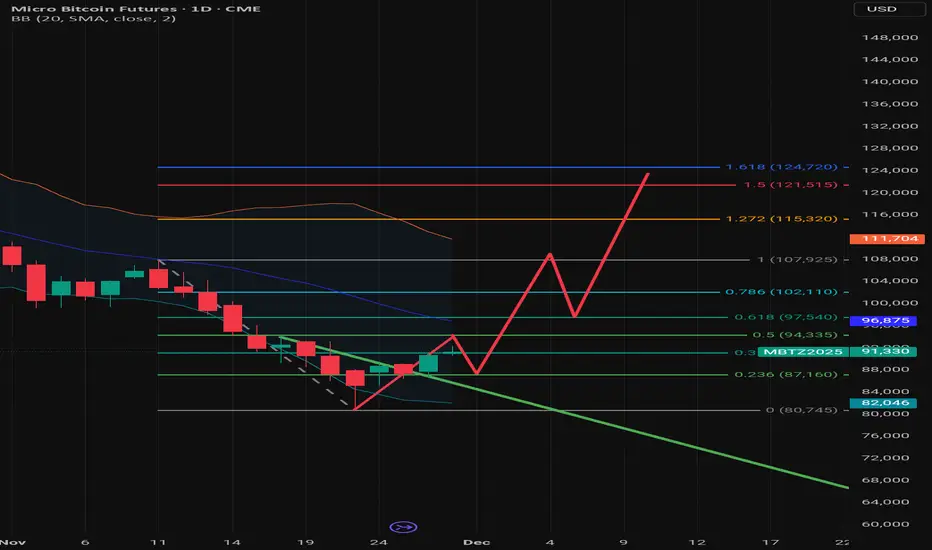
Attempting to break out of the bearish structureFibonacci Retracement Analysis
The retracement is drawn from the local high of $107,925 to the low of $80,745.
Current Battle (0.382 Level): The price ($91,310) is currently piercing through the 0.382 Fib level ($91,130).
Significance: This is the first major hurdle for bulls. Closing the daily candle above this level suggests the recovery is sustainable and not just a "dead cat bounce."
Next Resistance (0.5 Level): The next target is $94,335.
The "Golden Pocket" (0.618 Level): The most critical trend-reversal level is at $97,540. This is often where bearish algos reload their short positions. A break above this level confirms a macro trend shift.
Bollinger Bands & Moving Averages
Middle Band (20 SMA): The blue line (Middle Band) sits at $96,874.
Technical Insight: Notice that the Middle Band is currently above the price. This means the immediate trend is still technically bearish. The price often gravitates toward this mean ($96k) to test it as resistance.
Confluence: The Middle Band aligns very closely with the 0.618 Golden Pocket ($97,540). This creates a "confluence zone" of heavy resistance between $96k and $97.5k.
The "Red Path" Projection (W-Pattern)
Impulse: Price rallies to the confluence zone ($94k - $97k).
Correction: Price pulls back to set a Higher Low (likely retesting the $87k - $91k region).
Breakout: Price blasts through the previous high of $107,925.
Target: The extension target is the 1.618 Fib at $124,720.
Diagonal Resistance Break: Look at the thick green line going downwards. The current candle is actively breaking out of this diagonal trendline. This is a classic breakout signal.
Critical Levels Cheat Sheet
Level Price Action/Note
Target 2 (Extension) $124,720 The bullish "Red Path" ultimate goal.
Major Resistance $97,540 The 0.618 Golden Pocket (Must break for bull run).
Dynamic Resistance $96,874 The Middle Bollinger Band.
Immediate Support $91,130 The 0.382 Fib (Needs to hold as new floor).
Critical Support $87,160 The 0.236 Fib. Losing this invalidates the rally.
Floor $80,745 The recent low.
BTC analysisBitcoin is currently forming an upward channel on lower time frames. The price continues to rise after the US session. Support remains steady at $85,000, while immediate resistance is at the $90,000 level.

BTC Update: The Rollercoaster EditionAttention all chart warriors, candlestick whisperers, and Fibonacci fanatics!
If you're reading this trade plan, congratulations — you've officially entered the realm of market prophecy
🚀 BTC Update: The Rollercoaster Edition 🎢
What’s New?
Bitcoin is chilling around $86K, like that friend who says “I’m fine” after a breakup but keeps posting cryptic stories.
Upper Trendline:
Sitting pretty near $90,774 – that’s the “VIP section” where bulls want to party. Break above it, and we’re talking $97K–$104K dreams.
Lower Trendline (Breakout Zone):
Guarded at $85,500. If BTC slips below this, next stop could be $80K – aka the “budget seats.”
Price Action:
Currently stuck in a descending channel, but RSI is whispering, “Hey, maybe we’re oversold.” MACD is like that friend who says, “I think things are turning around.”
Target:
If BTC breaks the upper trendline, $97K–$104K is the next dance floor. If not… well, let’s just say $80K might be the couch we crash on.
Fun Fact:
Bitcoin’s November mood? Extreme Fear. Basically, the market is acting like someone saw a spider in the bathroom.
Good luck, everyone! And hey, don’t forget to smash that like button and drop your wildest market predictions in the comments! ❤️
Disclaimer: My trading strategy isn’t a signal—it’s more like a workout for my brain. I’m just here flexing my market structure knowledge and sharpening my trading skills while building my trade journal. Think of it as financial gym time—no personal trainers, just candlesticks!

BTC Rebound: From Bear Hug to Bull RunWelcome back to Market Prophecy...
From the previous chart, the market successfully broke the support and continued its fall to the next support. So, I’m seeing a possibility that the price will drop to 77,663.25 before making a comeback to the 50%–61.8% level… because even markets need a little drama before a rebound
good luck all
**My trading strategy is not intended to be a signal. It's a process of learning about market structure and sharpening my trading my skills also for my trade journal**
Thanks a lot for your support

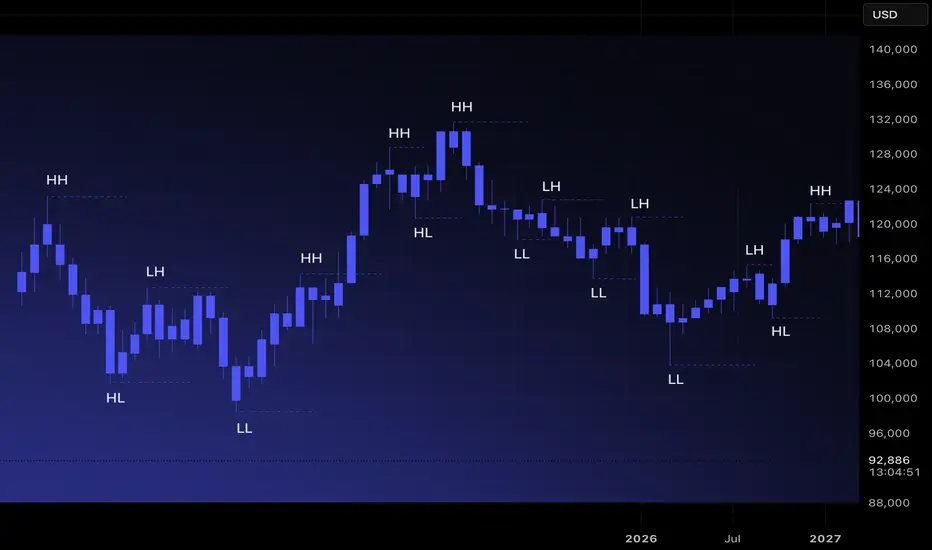
Market Structure 101: Navigating Price ActionMost traders jump directly into indicators, oscillators, or patterns. Yet every chart has a deeper foundation that determines direction long before any tool is applied. Market structure is that foundation. When you understand how price forms highs, lows, and transitions between them, you stop reacting to noise and start reading the market’s intent. It is the base layer that allows you to build a clear, consistent bias.
Price moves because buyers and sellers interact around key levels. Structure highlights where momentum strengthens, weakens, or reverses. By tracking how highs and lows evolve, you can identify trend, consolidation, and shifts in direction with far more clarity than any indicator can offer. Market structure is objective. It gives you a rule-based lens to interpret movement across all timeframes.
Understanding Highs and Lows
There are four structural components every trader must recognize.
Higher High (HH): Price breaks above a previous high, showing buyers in control.
Higher Low (HL): Price pulls back but stays above the prior low, confirming trend continuation.
Lower High (LH): Price rallies but fails to reach previous highs, indicating weakening demand.
Lower Low (LL): Price breaks below the previous low, signaling sellers taking control.
These sequences are the building blocks of trend identification. When mapped correctly, they remove guesswork and reveal underlying momentum.
Identifying Uptrends and Downtrends
Uptrend: A sequence of HHs and HLs. Buyers consistently push price higher and defend higher floors.
Downtrend: A sequence of LHs and LLs. Sellers control direction, rejecting higher prices and driving the market downward.
A trend remains intact until structure breaks. This is why experienced traders avoid predicting reversals and instead follow structural evidence. When the market prints new HHs and HLs, the bias remains long. When LLs and LHs appear, the bias rotates short.
Ranges and Consolidation
Markets do not trend all day. Much of the time, they move sideways. A range occurs when highs and lows stay relatively equal, creating a horizontal zone with equal highs and equal lows. This is where compression happens. Liquidity builds above the range highs and below the range lows, and trend often resumes only after one side of the range is taken.
In ranges, structure becomes neutral. Bias is formed only when price breaks out and retests with confirmation.
Break of Structure(BOS) and Trend Shift
A break of structure occurs when the market violates the pattern of the existing trend. In an uptrend, a break occurs when price prints an LL. In a downtrend, a break occurs when price forms an HH. This signals a potential shift in momentum.
Breaks of structure matter because they identify turning points without relying on subjective signals. They show where one side loses control and the other gains traction. They also create clear invalidation points for risk management.
How to Read Structure Across Timeframes
Market structure becomes even stronger when used across multiple timeframes. The higher timeframe sets the primary bias. The lower timeframe provides entry precision.
Weekly or Daily: Structural trend and major zones.
4H or 1H: Execution windows and key shifts.
15m and 5m: Entry confirmation.
When all levels of structure align, the probability of a clean move increases significantly.
Avoiding Common Mistakes
Many traders misread structure by focusing on every small fluctuation. Structure is defined by meaningful swings, not micro noise. Another common error is assuming a single HH or LL immediately reverses a trend. Context matters. Breaks followed by continuation and retests confirm the shift. A disciplined trader waits for structure to become clear instead of acting on isolated candles.
Turning Structure Into a Bias
Structure simplifies decision-making.
If the market is printing HH and HL formations, you prioritize longs.
If it is printing LH and LL formations, you seek shorts.
If highs and lows are equal, you wait for a breakout.
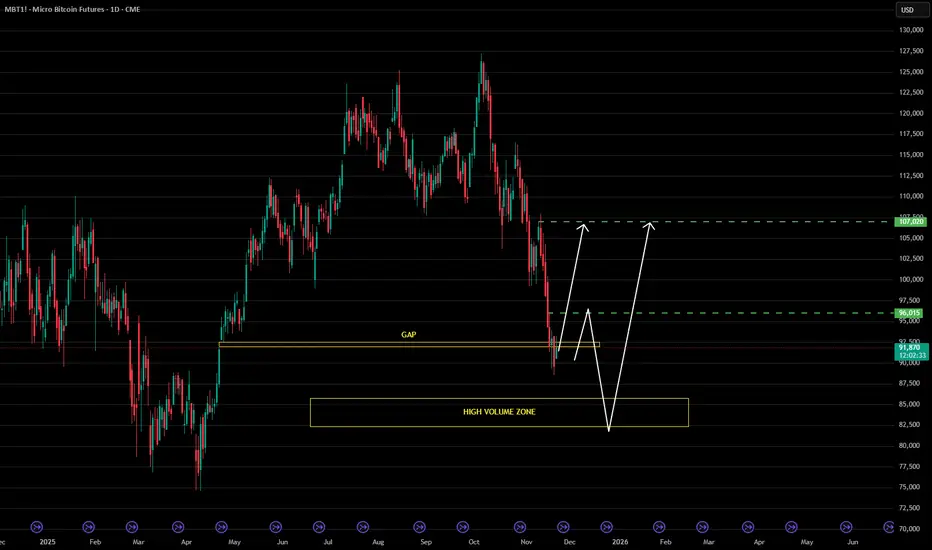
Bitcoin: Two Development Scenarios from Gap Closure ZoneCurrent Situation
Bitcoin has completed a sharp decline and is located in the critical gap closure zone. The chart shows two key technical elements: a resistance level in the upper part of the range and a high volume zone (HIGH VOLUME ZONE) significantly below current prices. Price has stopped precisely in the gap area, creating conditions for institutional players to make their decision.
Primary Scenario: Bounce from Gap Closure Zone
An immediate reversal upward from current levels is possible with subsequent movement toward key resistance. Gap closure often acts as a price magnet and correction completion point. If limit players are ready to defend this zone, a strong bounce is possible without testing lower levels.
Target Levels:
Movement toward the upper boundary of the range
Test of key resistance where price was previously stopped
Alternative Scenario: Test of High Volume Zone
Price may continue declining toward the high volume zone (HIGH VOLUME ZONE) located significantly lower. This area represents interest for forming a long-term reversal, as high volume concentration indicates institutional position accumulation. A more powerful and sustainable reversal upward is possible from here.
Key Levels of Alternative Scenario:
HIGH VOLUME ZONE — area for potential long-term reversal
Possibility of forming a strong base for upward movement
Trading Plan
For Primary Scenario:
Monitoring price reaction in current gap closure zone
Entry into long positions upon formation of reversal patterns
Target: movement toward key resistance
For Alternative Scenario:
Waiting for decline to high volume zone
Looking for signs of selling absorption in HIGH VOLUME ZONE
Entry into long positions with more aggressive risk/reward ratio
Risk Management
Primary scenario: stop-loss below gap closure zone accounting for possible false breakout
Alternative scenario: stop-loss below high volume zone with margin for stop liquidation
Recommended to split capital between two possible entry points