BTC1! price dropafter the creation of a Double Top reversal figure and the break of the neckline with force we will see a price drop
MBT1! trade ideas

BEARISH BTC CME EW COUNTBearish EW count, looking at the possibility of a weekend spill over after another push up attempting to reclaim 20K, but ultimate failure this weekend given over all bearish market conditions on quarterly close, with 15350-650 targets, followed by a relief rally for a B wave

BTC CME Futures - CheckToday lets take a quick look at the futures (which never got as low as spot)
We can see
1) Double bottom on 1.886
2) Locally (red count) wave 5 hit 4.236 and wave 3 2.618
3) Intermediate (yellow) looks like truncated 5th
Conclusion:
A) As long as no new low is set, chances are high to break the downtrend and get at least a relief rally
B) A new low will ultimately trigger a 5th major wave (white count) down targeting 2.618 down there
Hold my beer pls
----
No financial advice, do your own research, don't be stupid

BTC UpdateBeen holding 19k support pretty well, but I think it's just waiting for the stock market to catch up. If $NDX breaks support and heads to a new low for the year, so will BTC
Not sure when it will happen but it will happen.
No position, AAPL is dropping faster than this PoS, lol.

BTC short term ok, maybe 24k by eoy. Long term, not good
$BTC showing life, trades above RED MOVING avg
Let's see how it closes today
&
Would like 2c BULLISH moving avg crossover
(red > Green)
Weekly #BTC need 2c CLOSE above, @ least, the red moving avg (lot's of data on chart)
#Bitcoin does look poised for pump

Bitcoin continue with the DowntrendOn Bitcoin is nice to see strong sell-off from the price 20100 , there are nice to see strong volume area....
Where is lot of contract accumulated...
I thing that sellers from this area will be defend this short position...
and when the price come back to this area, strong sellers will be push down the market again...
Rejection of higher prices + Strong volume area is my mainly reason for this short trade....
Happy trading
Dale

Inside Day on Bitcoin futures triggered a long tradeNasdaq, BTC, Soybean(oil), Natural Gas have positive backtested outcome if you trade the break of the inside bar height
now trailing the stop below prior days low...

Bitcoin Futures TIMEFIBSTImeFibs are there to decrypt the cycles and warn ahead of market reversals.
Nearest TimeFibs:
1.618 at 20 Jul '22
1.786 at 6 Sep '22


BTC Market Analysis 09/2022BTC moving in a symmetrical triangle. There is a tug of war between bulls and bears. Complete indecision in the market. Weekly close is near high volatility can be seen.
In order to decide for orderbooks we have to keep an eye on a successful breakout with a good volume or a retest, which will confirm the next move of BTC. Currently its swinging between the weekly close and high.
Currently the DXY is moving to higher highs which has a complete reverse effect on BTC movement, so we have to keep a look on DXY too because Bitcoin moves completely in opposite direction to DXY & we all know whats happening with US $.
Best of luck!

BITCOIN - CME SHOWS BOTTOM IS IN?Seems nobody noticed that on CME Bitcoin already took lows and broke from the wedge .
No looks like tested break out forming double bottom .
The range is clear here, if we reclaim mid range then 25 k should b next as range high. That would also mean we broke trend line from ath what would be another confirmation that current range is accumulation one.

BTC FUTURES LONG Trendline break signals a long position here. I wouldn't put to much thought into this. I mean we dropped from 60k how much longer do we need to wait for a pop. Crypto prices are in shambles. Maybe fair value is a little lower around 15k but regardless we found massive support at 17k a few months ago and we haven't broken that since, we know that we know a lot of buyers are waiting there and we also know anyone selling from 29k or even 25k or 20k is going to have to their take profit at new lows or at 15k//16k. I don't think anyone actually see's this touching 10k ever again. I could be completely wrong. It is possible the crypto is a massive bubble, Its possible laws crack down on it but i think the community is too strong. Ever since Luna crashed and Do KWON made off with billions - a lot of faith has been lost. Its clear we are at a standstill. Prices have been going sideways for eternity. If you are not good at trending ranges or smaller timeframes on leverage then you really have had no chance to beat the market since June. the volume just isn't there. The total market cap for crypto is hitting the lows of 2020 pre pandemic levels. We saw a Rise in tech like never before. sadly its looking like a bubble now. But historically if we compare it to the .com bubble or what not. Even though there was a tech bubble, we all now still use internet today. investing in top companies like apple, Microsoft, yahoo, whoever else were some if the biggest opportunities in modern history to secure your retirement. It would be the opposite of smart to not consider these top coins as serious investment opportunities to buy and hold. Buying these dips is the best thing you can do over the long term and create the best opportunities. that being said if your on margin or leverage. This trade I am posting is worth a shot at with a tight stop loss on new lows.
IF you want more signals for any other charts please comment below. Subscribe to see more scalps for crypto, forex, stocks, ETF , commodities. Thanks for your support! Happy trading!

BTC UpdateFed meeting next week, rut ruh...
Bought a few OTM BITO puts for next week, just a small play

BTC Futures- The Perfect ChartThis is the ultimate chart to watch. Opposed to the regular market we have formed a perfect bear flag on the CME futures chart. We have had multiple picture perfect tests on our red line of resistance and multiple picture perfect tests on our green line of support. Right now our resistance is between $21,400-21,800. One of two scenarios will play out from here.
The first scenario (less likely in my opinion) is we reach that resistance, end up closing above it and hold it as support. This would give us a breakout target around the $30k level.
The second scenario (more likely since this is a very bearish pattern) is we may reach our resistance first, but if we fall and close a daily candle below the $18.5k level on CME then our bear flag breakdown would be in play. This bear flag has a crazy target around $7k.
Please watch this chart when around either support or resistance to see where we close.

Bitcoin Sept 15 Minute Chartsheres my chart for tonight hoping we act neutral but pump to 22k in the next 48 hours
bitnodes.io
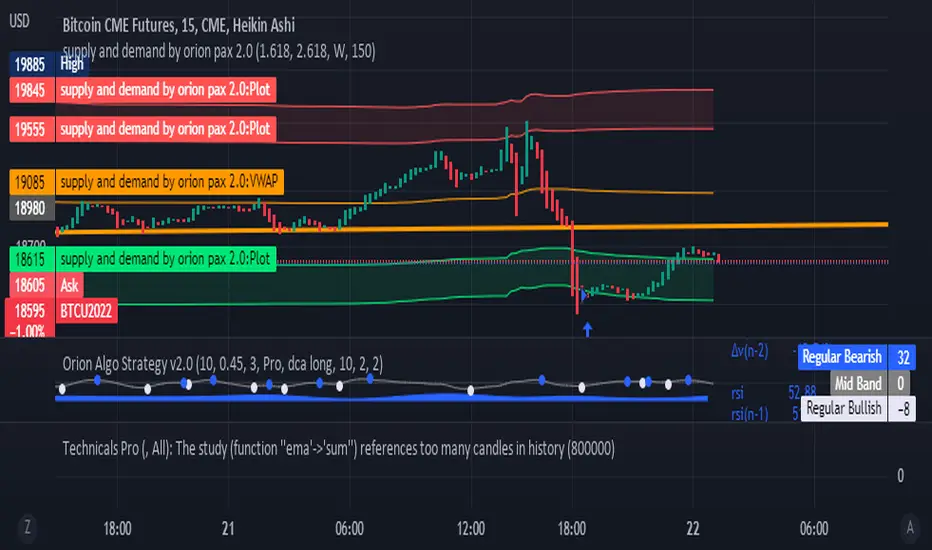
LONG BTC1Closed the previous deal SHORT from 19.08.2022 at +9.44%.
Opened a LONG trade from 21:35 on 21.09.2022 at 19455
the arrow shows the direction of the open trade and the trend, but not the final movement target

15 minute bitcoin sept 2022 heres my 15 minute chart for bitcoin going alpha neutral even though thats probably not what im doing; thinking the market will settle between 250-750-possibly 1250 rise today; maybe not but im going to bed now its already 1am.

bitcoin 15min chart heres my 15 minute chart within bitcoin for the next little while---some custom code - and indicators with a few templates that we pre designed----looking for a bounce in the near future---bitcoin will be watching this chart---and be pumping along with another chart----hope you enjoy tomorrow thanks luke@bitcoin

BTC $10,900 Potential ScenarioPut together using Volume price targets and accumulation zones on the CME futures chart.
BTC was born out of the recessionary mark crash of 2008, but has never been tested in a recession before. This is a first for BTC and uncharted territory for crypto in general. Here is my potential scenario for BTC, with an accumulation BUY zone shown by the blue line for a dead cat bounce scenario. I will have to make up my mind closer to the time, but I am be buying BTC on that blue line when we approach for a potential bounce area before heading down to that $10,900 target. BE under no illusion, there is no way of really telling the bottom for BTC, it could possible smash right on through that 10k mark and down to the 5k area.

bitcoin looks awfulbitcoin looks awful
if we break down into the green it really is free fall.
I'm not sure what planet Micheal saylor is on


Long BTC/USD H4/D1Whilst BTC was having tough days in July-August, altcoin market started to recover a litlle bit. Thus, it was and is (at this time) a leading indicator for the whole crypto market (f.ex. see my previous ATOM/USDT trading idea back in July).
On September 6-7 we saw an attempt to test liquidity below previous lows (18600) but btc had a pullback today and broke a recent consolidation (26 aug - 6 sept, price range - 19500-20400).
Thus, I see a good opportunity for a following trade:
Entry - 20300
SL - 18300
TP1 - 24000
TP2 - 28000
