BTC Update📊 CRYPTOCAP:BTC Update
Remember guys — BTC can still move toward the $92,000 area 💰
This level lines up with the CME gap that could be filled 🔄
Nothing guaranteed, but it remains a possible target if the trend continues 📈
Trade ideas

Diversified Futures Paper Trading Setup: 5 Instruments, BalancedDetails / Description:
Today, I set up a paper trading portfolio on TradingView using 5 instruments from different sectors/industries to practice diversification, risk management, and leverage.
Strategy Highlights:
Selected 1 instrument from each industry to reduce sector-specific risk.
CME:MBT1! – Industrial / Metals
CME_MINI:ES1! – S&P 500 Index
CME_MINI:MNQ1! – Nasdaq 100 Index
COMEX_MINI:MGC1! – Gold Mini Contract
NYMEX:MCL1! – Crude Oil Mini Contract
Used market orders for immediate entries.
Set Take Profit and Stop Loss for each position with a rough 1:3 risk-reward ratio.
Let positions run for the medium term (days to weeks) without constant monitoring.
Margin and available funds carefully managed to ensure all positions can stay open safely.
Purpose / Learning Goal:
Practice portfolio diversification across different industries.
Learn position sizing, risk-reward, and leverage management.
Observe how unrealized and realized P/L evolve over time.
Understand how stop losses and take profits help automate risk management.
Next Steps:
Monitor daily or via alerts, but avoid constant screen watching.
Adjust future trades based on performance and market conditions.
BTC Death Cross and Filling CME GapHello traders,
Well BTC is in a pickle.. Its lost 100K and the death cross is about to occur by Sunday 11-16-2025. A deathcross is when the 50DMA crosses the 200DMA. Sounds ominous but for bitcoin many times it has market the bottom before it reverses higher. Whats even more crazy is Bitcoin always fills the CME gaps and that could be its Target Sunday when futures open or this week and once it fills the gap Bitcoin has no must hit targets below that... So Im predicting that it bottoms and then we head higher from there. Everyone is dooming right now on twitter and chats...Let's see what happens.

Liquidity Zones Explained: Where Smart Money GoesMarkets don’t move randomly. Every candle, spike, or reversal happens for a reason and that reason is liquidity.
Liquidity is what fuels price movement. It’s where buy and sell orders are concentrated, and where large players execute positions without showing their hand.
Understanding where liquidity lies gives traders a major advantage, because price doesn’t move to levels by accident. It moves there to fill orders.
Liquidity represents the pool of resting orders waiting to be filled — stop losses, pending buys, or sells.
When price reaches these areas, volume spikes, and the market finds enough counterparties for large players to enter or exit positions.
Liquidity isn’t just numbers on the book. It’s the invisible map of trader behavior:
– Stops above highs (where breakout traders get trapped)
– Stops below lows (where panic selling occurs)
– Consolidation zones (where both sides accumulate orders)
These areas become magnets for price movement.
When you see sharp wicks above or below key levels, it’s often not manipulation — it’s collection.
Smart money drives price into these zones to trigger stop losses and capture liquidity before reversing in the true direction.
The move looks random, but it’s calculated.
The goal is to fill large positions efficiently, using retail orders as exit liquidity.
Instead of chasing price, learn to wait for liquidity grabs.
The simplest method is to mark obvious highs and lows and observe how price reacts when those levels are taken.
If price breaks a key high but fails to continue — and momentum shifts back down — it’s often a sign of a liquidity sweep, not a breakout.
These moments reveal where the real players are positioning themselves.
Trading liquidity is about reaction, not prediction.
Liquidity zones reveal where traders are trapped and where professionals engage.
If you stop focusing on where price is and start paying attention to why it moves there, you’ll see the market with far more clarity.

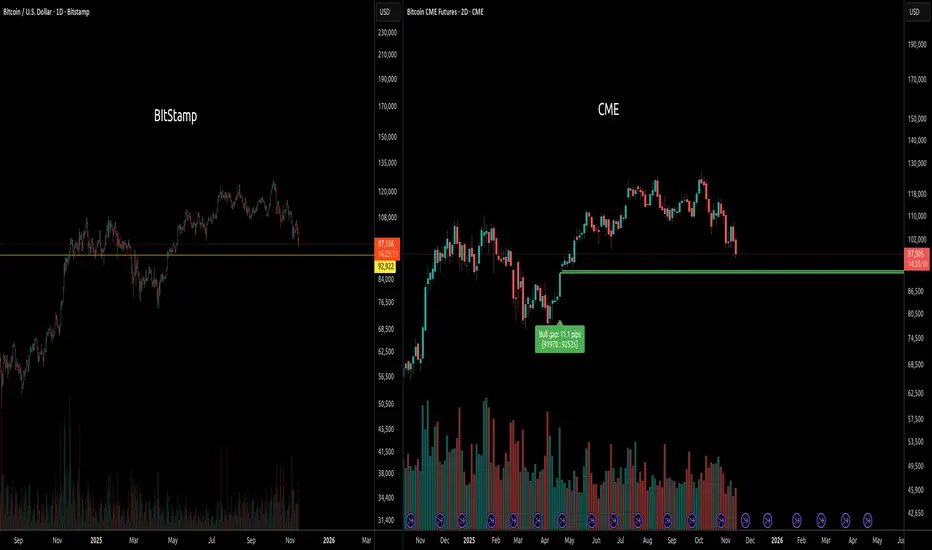
BTC Analysis | CME GapHello friends
Bitcoin’s critical gap between $91,500 and $92,500 could serve as a short-term correction target if selling pressure continues.
A gap that closes could set the stage for a bottom and a continuation of the uptrend.
The price’s reaction to this area will determine the market’s next direction.
Don't forget risk and capital management.
*Trade safely with us*

Bitcoin Technical Breakdown: Still Bearish We revisited Bitcoin We revisited Bitcoin recently and the technicals remain grim:
- 200-day MA erosion continues
- RSI stays low = persistent weakness
- Price & lagging line both below the Ichimoku cloud
- MACD still negative
- Lower highs, lower lows = downtrend intact
So why watch this chart?
If you're already short, the key question is: when do you add to your position?
🔍 Watch for this combo:
- Weekly close below the 55-week MA (currently at 12,027)
- Breakdown of weekly RSI support
📌 That’s your next sell signal. If it triggers, it’s time to scale into your short.
Stay sharp. Trade smart.
#Bitcoin #CryptoTrading #TechnicalAnalysis #BTC #BearishSetup #Ichimoku #RSI #MACD #CryptoStrategy
Disclaimer:
The information posted on Trading View is for informative purposes and is not intended to constitute advice in any form, including but not limited to investment, accounting, tax, legal or regulatory advice. The information therefore has no regard to the specific investment objectives, financial situation or particular needs of any specific recipient. Opinions expressed are our current opinions as of the date appearing on Trading View only. All illustrations, forecasts or hypothetical data are for illustrative purposes only. The Society of Technical Analysts Ltd does not make representation that the information provided is appropriate for use in all jurisdictions or by all Investors or other potential Investors. Parties are therefore responsible for compliance with applicable local laws and regulations. The Society of Technical Analysts will not be held liable for any loss or damage resulting directly or indirectly from the use of any information on this site.

CME Gap closure at 92k early DecemberGotta close them all. Fractal analysis, an update to my previous chart.

BTC: Possible double top targeting 92k CME GapViewing the chart below, this looks like a Double Top with a measured target close to the CME Gap at 92k.
There could be a wick down close to this area to close the gap before price continues back upwards.
These don't always play out, however with low liquidity in the market, CME may choose to drop price to free up stuck liquidity at the 92K Level.
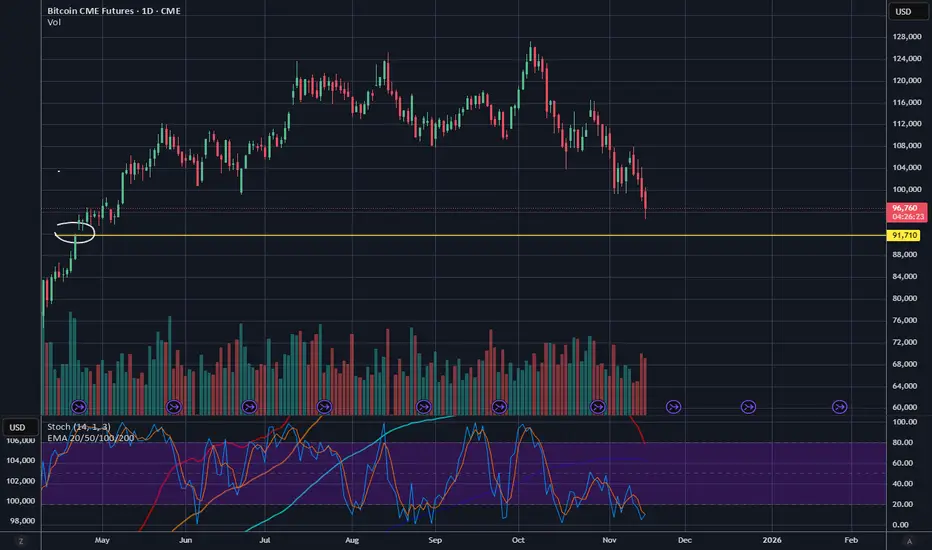
BTC CME - One final push down to close the gap?There is unfilled CME gap at $91,700 that remains unfilled. Could we have one more push down to fill it?
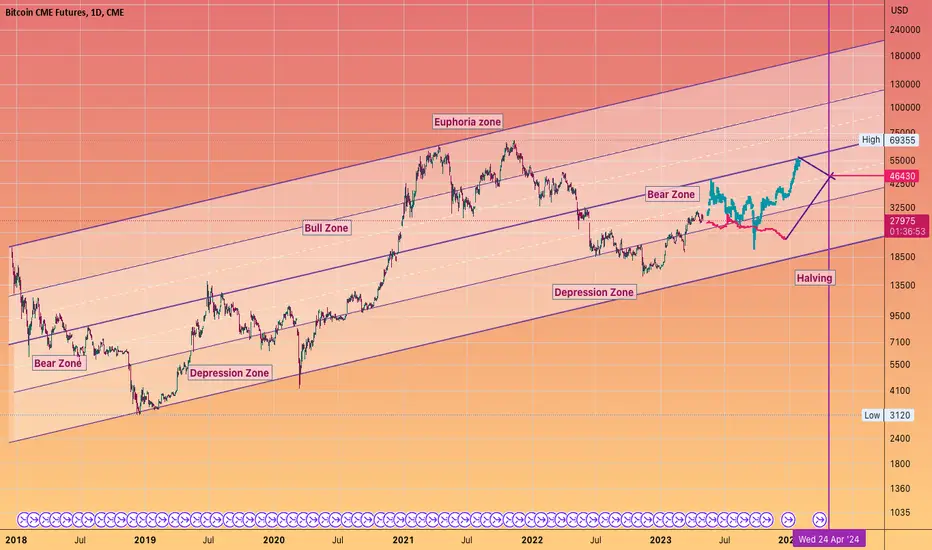
#BITCOIN pathways for the halveningroute 1
or route 2
or a new pathway (Most likely)
next April we will be at $50k
_Bitcoin CME Gap Update
CME Gap is open and almost ready to fill ranging at 92,600 - 92,115 panda fam possible one reason why price aggressively drop in recent days, week, & months. 🚩
Same time panda fam yung main own strat natin na PBr1 also at 95,835 - 93,525 possible price will bounce same time but wag lang sana bounce agad we need some liquidity hunt muna sa baba para ma fill at bounce yun yung much better movement para pwede tayo mag expect ng possible reversal bounce on next IMPULSE rally ✍️
Conclusion always watch and observe our PBr1 that is our ideal keylevel of bouncing point maganda ang pinapakita ng price movement ngayon confluence and backed by PBr1 and CME Gap 🔥

BITCOIN : WEEKLY TRADE STRUCTUREAttention all chart warriors, candlestick whisperers, and Fibonacci fanatics!
If you're reading this trade plan, congratulations — you've officially entered the realm of market prophecy
Here is my view on the current BTC/USD trade structure. Looking at the weekly chart, the price has successfully broken out of resistance and the trendline. Therefore, the current decline is a correction before a potential upward move resumes. However, if the price manages to break below the support level of 90862.16, this structure will change
good luck all
**My trading strategy is not intended to be a signal. It's a process of learning about market structure and sharpening my trading my skills also for my trade journal**
Thanks a lot for your support

BTC (MBT) on the way ot 86'000Price reacted very well at the white and red fork lines (see arrows).
We have left the white centerline, and now price is hovering around the red one. If we get an open and close below it, we’ll have a new target: the WL1 of the white fork, which unsurprisingly, lines up with the red L-MLH.
Rough times ahead...

The Pattern That Looked Bullish… Until It Didn’t1. The “Too Good to Be True” Setup
You’ve seen it a hundred times — that shiny W-shaped pattern that screams reversal.
Traders spot it, celebrate it, and rush in before it even completes.
But not every double bottom deserves a standing ovation. Sometimes, what looks like a powerful comeback is actually the calm before another dip.
2. Meet the Real Players: FO vs. UFO
Behind every pattern hides a tug-of-war between two invisible forces:
FO (Filled Orders): Where buyers already did their job. The gas tank’s empty.
UFO (UnFilled Orders): Where fresh buyers are still waiting. That’s where the real fuel sits.
In our current setup, price bounced from an FO zone that already spent its energy.
The next UFO zone — the untouched demand — sits lower.
Translation? The market might need one more leg down to refuel before any real rally begins.
3. The Bear Hiding Inside the Bull
Chart shapes can lie.
Order flow doesn’t tend to.
When price sits on an FO support and the next UFO level is far below, odds tilt toward a break, not a bounce.
It’s like jumping on a trampoline that’s already been stretched too far — it might not spring you up again this time.
4. Rethink “Confirmation”
Pattern traders often buy the moment they spot symmetry. Smart traders wait for liquidity confirmation — the moment unfilled demand actually engages.
If that doesn’t happen, all you’ve got is a good-looking shape on a tired level.
5. The Real Lesson
Patterns attract attention.
Order flow reveals intent.
Patience separates analysis from impulse.
The next time a chart whispers “reversal,” ask yourself: Is it running on new energy or recycled hope?
Want More Depth?
If you’d like to go deeper into the building blocks of trading, check out our From Mystery to Mastery trilogy, three cornerstone articles that complement this one:
🔗 From Mystery to Mastery: Trading Essentials
🔗 From Mystery to Mastery: Futures Explained
🔗 From Mystery to Mastery: Options Explained
When charting futures, the data provided could be delayed. Traders working with the ticker symbols discussed in this idea may prefer to use CME Group real-time data plan on TradingView: www.tradingview.com - This consideration is particularly important for shorter-term traders, whereas it may be less critical for those focused on longer-term trading strategies.
General Disclaimer:
The trade ideas presented herein are solely for illustrative purposes forming a part of a case study intended to demonstrate key principles in risk management within the context of the specific market scenarios discussed. These ideas are not to be interpreted as investment recommendations or financial advice. They do not endorse or promote any specific trading strategies, financial products, or services. The information provided is based on data believed to be reliable; however, its accuracy or completeness cannot be guaranteed. Trading in financial markets involves risks, including the potential loss of principal. Each individual should conduct their own research and consult with professional financial advisors before making any investment decisions. The author or publisher of this content bears no responsibility for any actions taken based on the information provided or for any resultant financial or other losses.
The Double Bottom Trap That Traders Might Miss1. The Comfort Zone of Classic Patterns
Few formations attract traders’ attention like a double bottom. It’s one of those timeless chart patterns that promise hope after a long decline—a visual story of selling exhaustion followed by a bullish reversal.
But markets rarely reward what’s obvious. In futures trading, especially when examining instruments like Bitcoin Futures (BTC) and Micro Bitcoin Futures (MBT), patterns are only half the story. What truly moves price isn’t just the shape on the chart—it’s the order flow behind it.
That’s where understanding FO (Filled Orders) and UFO (UnFilled Orders) becomes essential. Both represent past and potential liquidity imbalances, and reading their relationship can transform how traders interpret “classic” setups.
2. The Bitcoin Setup: A Tale of Two Bottoms
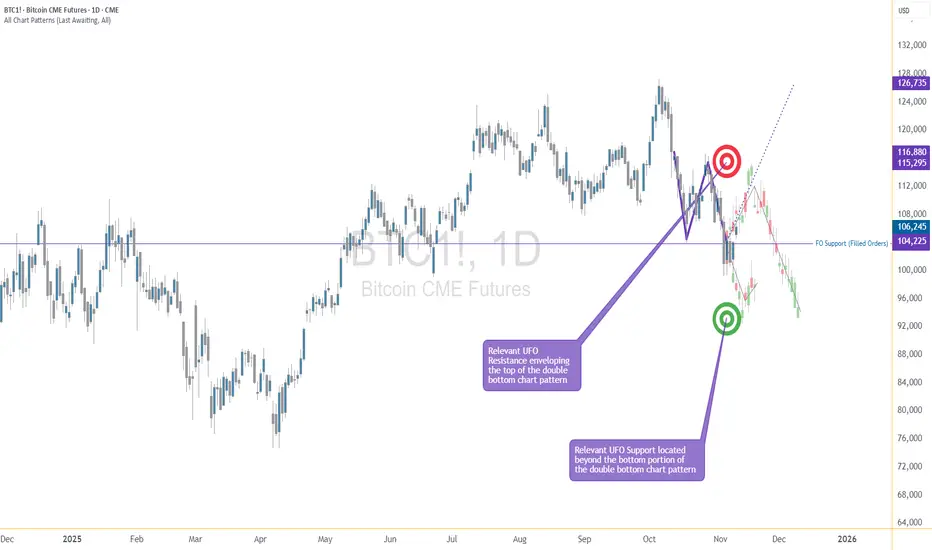
The current BTC daily chart paints what seems like a textbook double bottom. Two price troughs form near the same horizontal area around $104,000, setting up the typical “W” shape many traders see as a bullish reversal pattern.
However, when we dig deeper into the order flow structure, the illusion begins to fade.
A FO Support level exists near $103,860, meaning that this area previously attracted enough buyers to halt a decline—but those orders have already been filled and we know this given the fact that price turned at that price level before.
The next UFO Support zone sits much lower, around $95,640. That’s where unfilled buy orders are expected to remain waiting, untouched.
This distinction matters. While FO zones mark previous turning points, UFO zones highlight potential turning points that still contain resting liquidity. In simple terms, FO areas represent “used energy,” while UFO areas represent “stored energy.”
3. FO vs. UFO – The Order Flow Reality Check
Let’s define these two concepts with precision:
FO (Filled Orders): Price zones where significant buying or selling already occurred. These levels once reversed price, but because those orders were executed, fewer remain to defend the level again.
UFO (UnFilled Orders): Price zones containing pending buy or sell orders not yet triggered. They represent areas of fresh imbalance and therefore carry a higher probability of influencing future price moves.
In our Bitcoin case, the FO Support around $103,860 has done its job already—it stopped price before. But now, the unfilled buying interest lies lower, implying that the market may need to travel down to reach fresh demand at $95,640.
On the other side, UFO Resistance hovers near $112,410, enveloping the top of the double bottom structure. Should the price rebound toward that level, sellers waiting there could re-enter the scene, potentially capping any bullish recovery.
The conclusion? This pattern isn’t as bullish as it looks.
4. When Bullish Shapes Hide Bearish Probabilities
Most traders spot the double bottom and immediately think “trend reversal.” Yet, the distance between FO and UFO levels tells a more subtle story.
Since FO Support levels carry reduced strength after being tested, they’re more likely to break than hold. In this context, the probability favors a downside continuation rather than an immediate bounce.
If price breaches $103,860, the next probable destination becomes the UFO Support at $95,640. Only then, after reaching that pocket of unfilled demand, might a significant rebound have higher odds.
It’s a reminder that technical patterns, while valuable, must always be filtered through liquidity context. A pattern without order flow validation is like reading the market’s outline without its story.
5. Quantitative Insight: A Probabilistic Lens
Think of this in probabilistic terms:
When FO zones sit above UFO zones, the market often continues toward the unfilled liquidity.
When UFO zones lie closer to current price, reversals occur faster because demand (or supply) is still waiting to be executed.
In our example, BTC shows a larger gap between FO and UFO support levels, signaling lower immediate reversal odds. The chart may appear bullish, but the underlying order flow distribution points to weakness first, strength later.
This is not a prediction—it’s an observation of potential. It allows traders to structure their expectations based on where fresh participation is more likely to emerge.
6. Risk Management: Navigating the Trap
For traders considering setups around this structure, risk management is crucial.
Entry awareness: Avoid entering long positions purely because a double bottom “looks bullish.” Consider waiting for evidence of unfilled demand being triggered (confirmation at or near UFO Support).
Stop-loss placement: Stops below FO Support can easily be hunted in liquidity sweeps; better to align risk control with genuine unfilled demand areas.
Reward-to-risk thinking: A test of the UFO Support near $95,640 could later offer a more favorable upside-to-downside ratio than buying prematurely at $104,000.
Remember, pattern-based entries without liquidity confirmation often carry poor asymmetry—small upside with large downside risk.
7. Futures Structure and Margin Awareness
Both BTC and MBT represent Bitcoin exposure via futures contracts, but their sizing differs dramatically.
BTC equals 5 Bitcoin per contract, making it suitable for larger, institutional players. (1 Tick = 5 = $25. Required Margin = $132,500)
MBT, the Micro Bitcoin Futures, equals 0.1 Bitcoin per contract, offering flexibility for smaller accounts and finer position scaling. (1 Tick = 5 = $0.50. Required Margin = $2,600)
Understanding margin requirements is essential—these products are leveraged instruments, and small price changes can result in large percentage gains or losses.
8. Key Takeaway: The Hidden Lesson
This entire setup illustrates a powerful educational point:
Chart patterns may draw the eye, but order flow tells the truth.
The double bottom may invite buyers, but the imbalance between FO and UFO zones exposes an underlying weakness. Traders who rely solely on visual patterns may walk straight into a trap. Those who align patterns with liquidity insights, however, read the market at a deeper level.
In the current context, BTC and MBT might need to visit lower support levels before finding true stability. Watching how price behaves around these unfilled order zones will reveal whether this double bottom turns into a lasting floor—or just another false start.
When charting futures, the data provided could be delayed. Traders working with the ticker symbols discussed in this idea may prefer to use CME Group real-time data plan on TradingView: www.tradingview.com - This consideration is particularly important for shorter-term traders, whereas it may be less critical for those focused on longer-term trading strategies.
General Disclaimer:
The trade ideas presented herein are solely for illustrative purposes forming a part of a case study intended to demonstrate key principles in risk management within the context of the specific market scenarios discussed. These ideas are not to be interpreted as investment recommendations or financial advice. They do not endorse or promote any specific trading strategies, financial products, or services. The information provided is based on data believed to be reliable; however, its accuracy or completeness cannot be guaranteed. Trading in financial markets involves risks, including the potential loss of principal. Each individual should conduct their own research and consult with professional financial advisors before making any investment decisions. The author or publisher of this content bears no responsibility for any actions taken based on the information provided or for any resultant financial or other losses.

BTC1! : Possible move to the CME Gapfill at 92kDouble top with a measured target close to the CME Gap at 92k.
There could be a wick down close to this area to close the gap and release stuck liquidity before the uptrend continues,

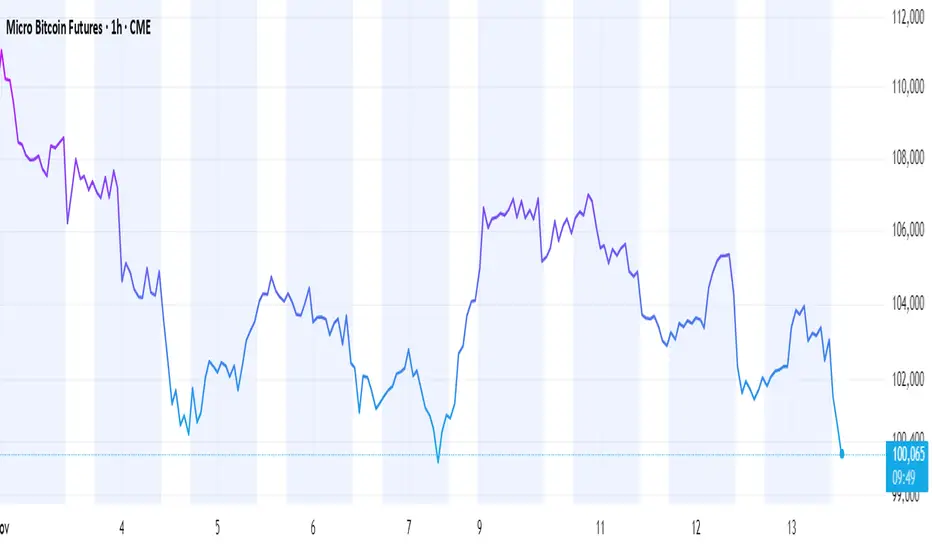
Bitcoin’s battle to stay above $100KLast time Bitcoin was at $100K, it ran up another $24K over the course of about 3 weeks. That retest of that price was a single day’s price action. Bitcoin has been hovering around $100K this entire week after falling. If it breaks below and closes then I can see some major selling pressure coming in immediately after due to fear. I’m going to focus on the price action this upcoming week because it should be making a decision to move away from $100K or fall below for the first time in a while.

Bitcoin Technical Breakdown: Bearish Signals BuildingToday we’re taking a closer look at Bitcoin, which is showing increasingly negative technical signals across multiple timeframes. Let’s break it down:
Daily Chart: Confirmed Downtrend
• Bitcoin is now technically in a down move, defined by a sequence of lower reaction highs and lower reaction lows—a structure that’s been in place since early October.
• Price has closed below the 200-day moving average (turquoise line), a key long-term support level. This breakdown adds weight to the bearish bias.
• The Ichimoku Cloud setup confirms a sell signal:
o Lagging line is below both the cloud and price.
o Price remains below a red cloud, reinforcing bearish momentum.
• The RSI is relatively low, suggesting weak bullish strength. Any short-term bounces are likely to be capped by the top of the cloud, which aligns with the recent high near 16,570.
Weekly Chart: Critical Support in Play
• The 55-week moving average has provided strong support since early 2023, with multiple successful tests.
• However, price is now threatening to break below this level again. A weekly close below 101,337 would be a significant bearish development.
• If confirmed, this could open the door to a deeper retracement toward the midpoint of the range, around the 85,000=80,000 area.
Summary
Bitcoin is currently in a confirmed downtrend, trading below key moving averages and cloud resistance. Unless bulls reclaim these levels, the path of least resistance remains to the downside.
Watch Friday’s weekly close closely—it could be pivotal.
Disclaimer:
The information posted on Trading View is for informative purposes and is not intended to constitute advice in any form, including but not limited to investment, accounting, tax, legal or regulatory advice. The information therefore has no regard to the specific investment objectives, financial situation or particular needs of any specific recipient. Opinions expressed are our current opinions as of the date appearing on Trading View only. All illustrations, forecasts or hypothetical data are for illustrative purposes only. The Society of Technical Analysts Ltd does not make representation that the information provided is appropriate for use in all jurisdictions or by all Investors or other potential Investors. Parties are therefore responsible for compliance with applicable local laws and regulations. The Society of Technical Analysts will not be held liable for any loss or damage resulting directly or indirectly from the use of any information on this site.

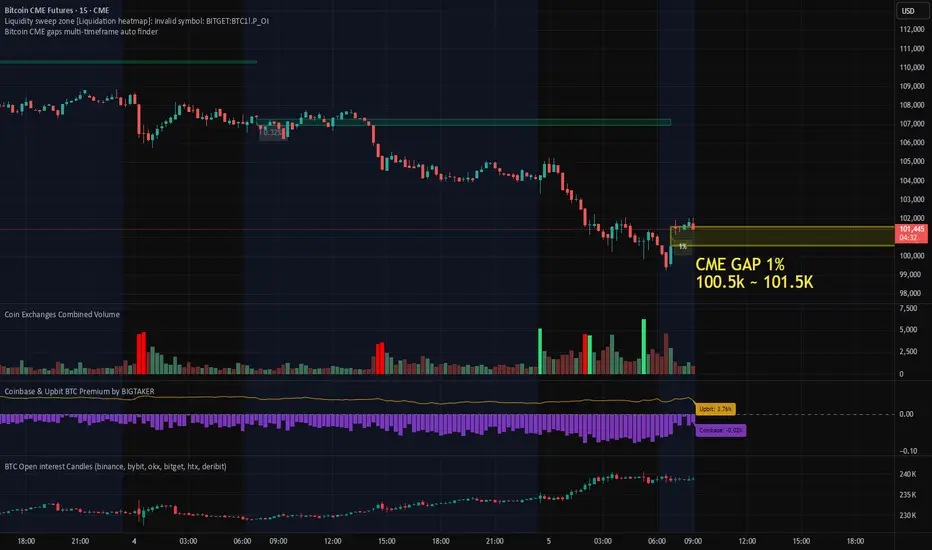
1% Bitcoin CME Gap Formed, Futures Market Data AnalysisThis morning, a ~1% gap formed on the Bitcoin CME futures chart.
Given that the gap occurred after a sharp decline, it’s important to consider the possibility of both a gap fill and a retest of recent lows in the short term.
The Coinbase Premium remains in negative territory, though it has shown slight improvement compared to yesterday, suggesting that U.S. spot selling pressure has somewhat eased.
In addition, Open Interest has increased, with data indicating a rise in short positions.
This suggests that selling pressure has been building during the recent decline, which may lead to a period of heightened short-term volatility and consolidation before the gap is fully filled.
Summary:
CME Gap Range: Approximately 1%
Market Structure: Short-term downtrend followed by consolidation
Coinbase Premium: Still negative, but slightly improved
Open Interest: Increasing (inflow of short positions)
📍In the short term, it is crucial to monitor whether the price enters the gap fill zone and retests the recent lows, while maintaining support at 98K, which remains a key short-term level.
Bitcoin Bounce Underway, But Bears May Not Be Done YetMy initial 100k downside target has been reached. While we’re seeing the almost obligatory bounce from a key level, Bitcoin could still head towards 90k. I take a fresh look at Bitcoin futures and their correlation with Wall Street.
Matt Simpson, Market Analyst at City Index

Triple Gap and yearly BounceThere's quite a bundle of supports here and if we get a bounce the target will most likely be the unclosed CME gap at 117k. The price could still go a bit lower but I don't think by that much. I don't expect this rally to be as strong as the last BTC idea I had but I expect alts to go up if we get a bounce here

BTCUSD LongNow or never for BTC.
I’m bullish from this level but I think it’s possible the peak might be in - so the yellow path would be what I can see happening in the case.
Alternatively if the peak is not in I can see it heading up to $140k and possibly peaking around there.

The Pivotal Moment of 2025Bitcoin Futures have tested the 50 weekly MA multiple times, in the last 2 years. Every intance, within that time frame, temporarily wicked below it but closed at or above it. Today, if this cycle is still to remain alive, it must reclaim that 50 MA. This weekly close is extremely important. CME:BTC1!
