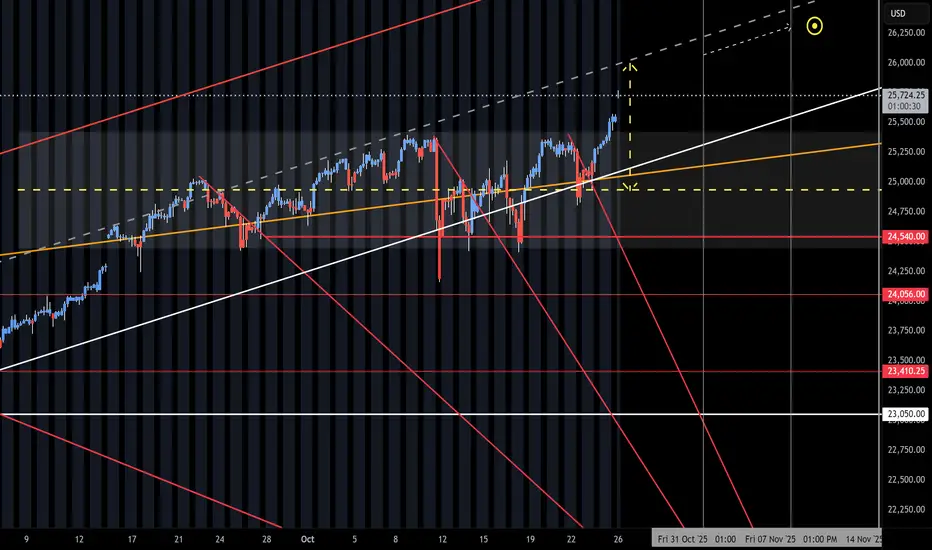
NQ Short (10-27-25, Week 5)NAZ with O/N Gap open to lock in the Long chase and clean out the short stops. Regarding Friday short, I always go flat into the close. The O/N continues be used to lift it with ease. This may be blow off top day into balance of Friday - Monday Long Play. Netflix had the -10% move and has not recove
About NASDAQ 100 E-mini Futures
An index composed of the 100 largest, most actively traded US companies listed on the Nasdaq stock exchange. This index includes companies from a broad range of industries with the exception of those that operate in the financial industry, such as banks and investment companies.
Related futures
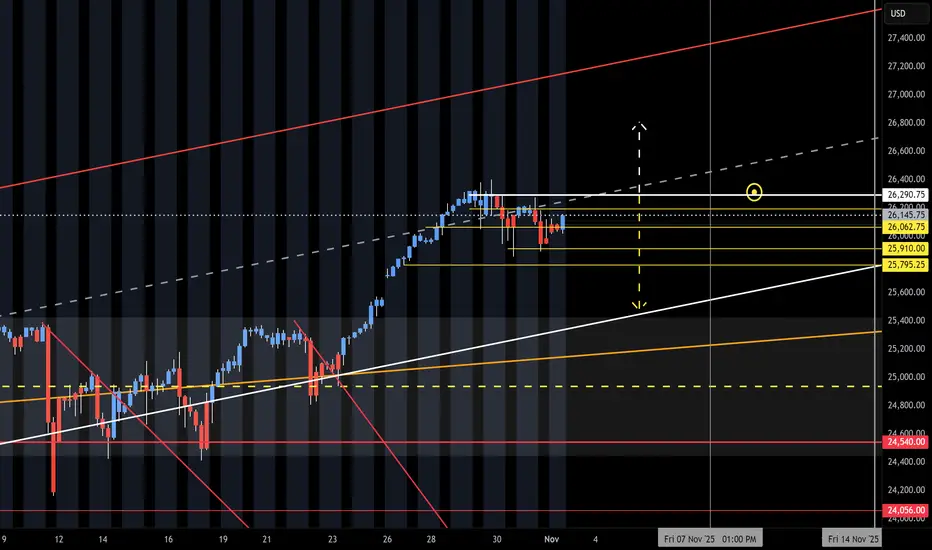
NQ Range (11-03-25, Week 6)The F-M Long move is on with new month and O/N Gap Open UP. Curveball form Friday Close and late head fake. Again, the NAZ will have to use the O/N to lift it back up. Need to see how the Open Drive and Reg Session reacts to the low volume O/N lift. Run up to upper target above KL 26,290 and Short
HOW TO TRADE THE LONG TERM TREND BY DRAWING TRENDLINES!Hey Traders so today wanted to make a quick video that explains how to trade the long term trend early. Also when to move your trendline to stay with the market for as long as possible in long term trends.
Hope This Helps Your Trading 😃
Clifford

NQ UpdateWaaaay overbought and they're still trying to pump NQ. I think Powell tanks the market tomorrow. If not Trump will Friday.
If there was ever a time to try to short QQQ or SPY, this is probably it, but options premiums are high so the return won't be very good. If you get next Friday's puts, you'

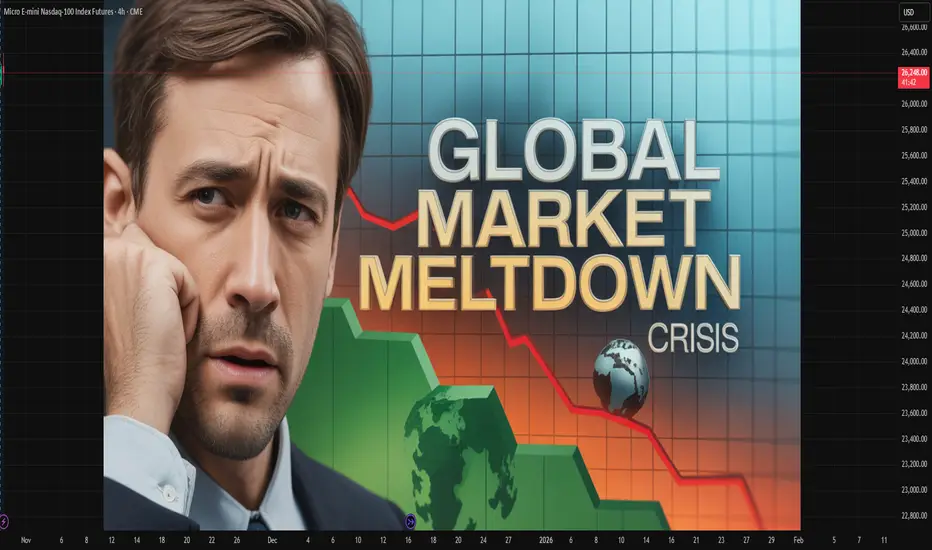
Lessons Learned from Past Meltdowns (2008, 2020, etc.)1. The 2008 Financial Crisis: A Wake-Up Call for Systemic Risk
The 2008 Global Financial Crisis (GFC) was triggered by the collapse of the U.S. housing bubble, excessive leverage in financial institutions, and the widespread use of complex derivatives such as mortgage-backed securities (MBS) and co
Bullish Bias on NQ for TodayBias: Bullish
Draw on Liquidity: All-Time High
Until 1H BISI/FVG made on Yesterday is not violated, We are Bullish on NQ.

IYMP Market Pulse Monday Nov 3rd - NQ TGIF bias stays active till Tuesday morning, so expect some sharp moves! 🔥
Scanners are lighting up — 195-minute intervals on NQ and ES showing solid momentum buildup.
Upside focus — 26,283, last Friday’s high, and 26,580 if momentum keeps pushing.
If we pull back — 25,770 is your first key suppo

The Empty Feeling After A WinA trader messaged me recently after closing a big win.
He said, “I should’ve felt great but I just felt… flat.”
That sudden emptiness after the high it’s more common than you think.
Follow along. I hope this helps.
BUT FIRST
NOTE – This is a post on mindset and emotion. It’s not a trade idea

NQ GOES TECH PARTY LIKE IT'S 1999, AHEAD OF ITS FINAL CRASHI was dreamin' when I wrote this
So sue me if I go too fast
But life is just a party
And parties weren't meant to last
...
I got a lion in my pocket
And, baby, he's ready to roar, yeah, yeah
Everybody's got a bomb
We could all die any day, oh
But before I'll let that happen
I'll dance my life a

NASDAQ LongsLook for longs in Nasdaq once price either takes Sell side marked during 9:30 open and target Midnight open.
Price can also leave to the upside directly from here.

See all ideas
Summarizing what the indicators are suggesting.
Neutral
SellBuy
Strong sellStrong buy
Strong sellSellNeutralBuyStrong buy
Neutral
SellBuy
Strong sellStrong buy
Strong sellSellNeutralBuyStrong buy
Neutral
SellBuy
Strong sellStrong buy
Strong sellSellNeutralBuyStrong buy
A representation of what an asset is worth today and what the market thinks it will be worth in the future.
Displays a symbol's price movements over previous years to identify recurring trends.
Frequently Asked Questions
The current price of NASDAQ 100 E-mini Futures is 25,477.50 USD — it has fallen −2.18% in the past 24 hours. Watch NASDAQ 100 E-mini Futures price in more detail on the chart.
The volume of NASDAQ 100 E-mini Futures is 10.49 K. Track more important stats on the NASDAQ 100 E-mini Futures chart.
Open interest is the number of contracts held by traders in active positions — they're not closed or expired. For NASDAQ 100 E-mini Futures this number is 291.74 K. You can use it to track a prevailing market trend and adjust your own strategy: declining open interest for NASDAQ 100 E-mini Futures shows that traders are closing their positions, which means a weakening trend.
Buying or selling futures contracts depends on many factors: season, underlying commodity, your own trading strategy. So mostly it's up to you, but if you look for some certain calculations to take into account, you can study technical analysis for NASDAQ 100 E-mini Futures. Today its technical rating is buy, but remember that market conditions change all the time, so it's always crucial to do your own research. See more of NASDAQ 100 E-mini Futures technicals for a more comprehensive analysis.