NQ Targets (09-29-25 Week 1)Add on to Published "7 week Post". This week's Churn Zone. Will update daily with any calls, as usual. Other Post is just bigger picture of forecast.
GoFED, BTD/FOMO with captain Tweety.
About NASDAQ 100 E-mini Futures
An index composed of the 100 largest, most actively traded US companies listed on the Nasdaq stock exchange. This index includes companies from a broad range of industries with the exception of those that operate in the financial industry, such as banks and investment companies.
Related futures

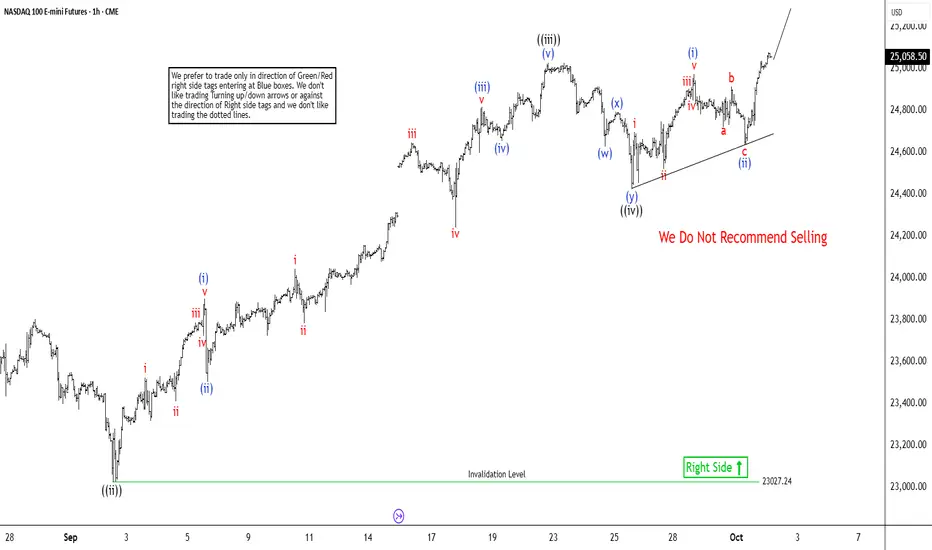
Nasdaq (NQ) on Track for Higher Wave 5 FinishThe short-term Elliott Wave analysis for the Nasdaq (NQ) reveals a bullish cycle initiated from the August 2, 2025, low, progressing as a five-wave impulse structure. Wave ((i)) surged to 24,068.5. The corrective wave ((ii)) concluded at 23,025.25, as depicted in the one-hour chart. The Index then a
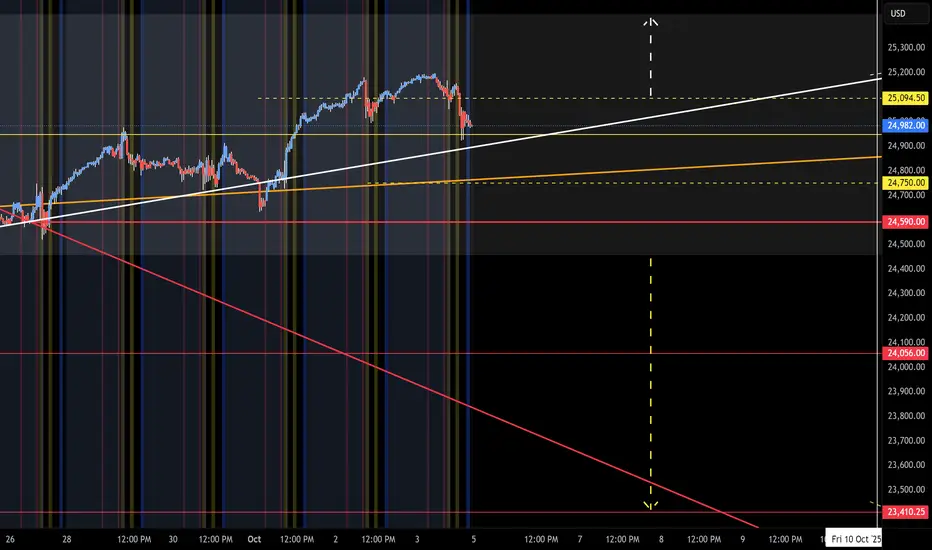
NQ Targets (09-29-25)Moving into October, 7 week range forecast. Basically, 23,050 is 50% retracement of YTD lift. Looking for a retest of that, no hold and keep going to the YTD Open or circle below (yellow arrow path). White arrow path has two targets, these are potential drop/rejection zones (to yellow arrow path). K

NQ Range (10-06-25, Week 2)Churning in the Churn Zone, back at Mid Level (ML) of range. Watch the 2 yellow dash levels, break to upper/lower churn range is redirect or counter move. Example, White arrow range play stall at 425 should reject to start or lower yellow arrow. Reverse that should NAZ drop to the start or yellow ar
Target areas - NQ price for Market open.10/1/25 - These are the target areas - NQ price for Market open depending if price moves up or down. Will look for trades into these areas.
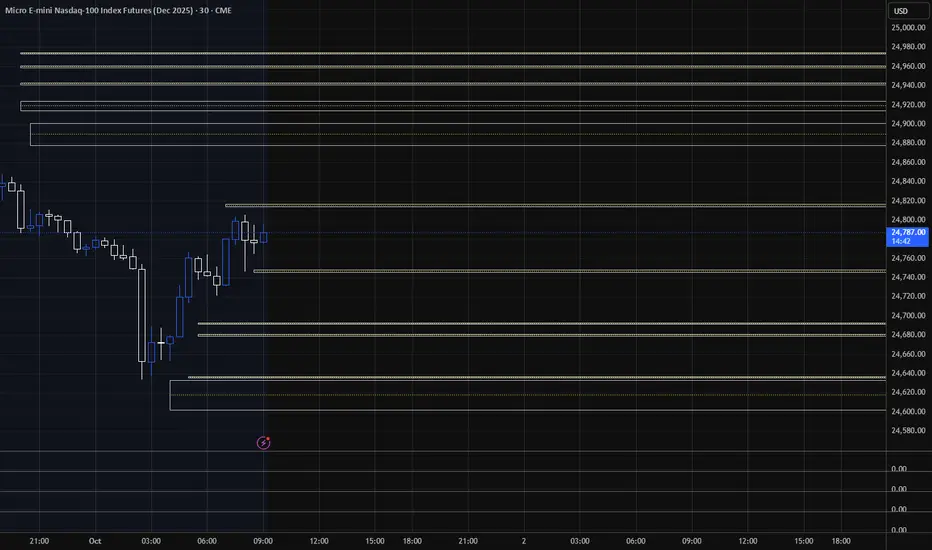

Short Trade Idea for 9/30 | NQI’m anticipating price to either push into the 1H bearish imbalance at 24,894 or reject from the NWOG around the 24,856 range before turning lower toward the 24,640.00 range. My bias is firmly short for now — but I’ll reassess as we approach the open.

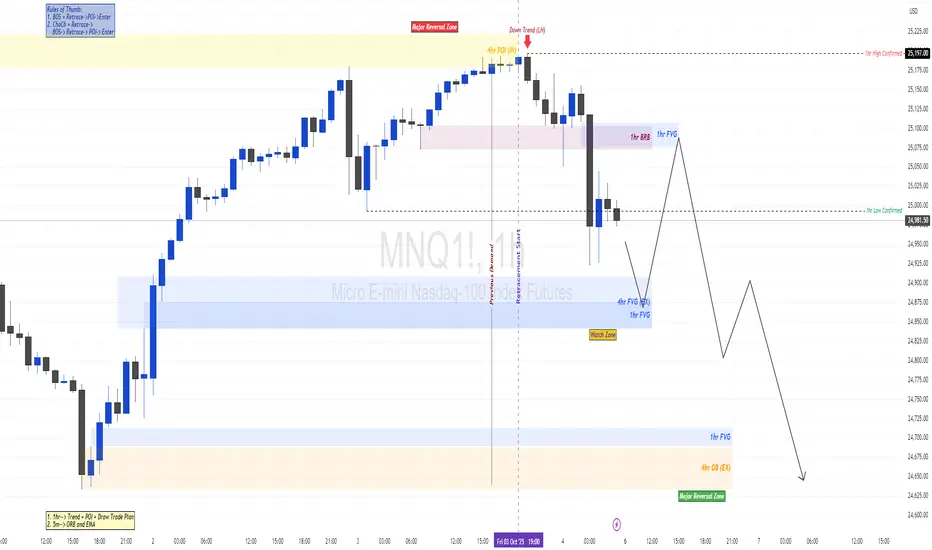
MNQ (NASDAQ Futures) – Bullish Setup Plan | 4H + 1H ConfluenceDescription / Analysis:
This is my structured outlook for MNQ (Micro E-mini Nasdaq-100 Futures) for the coming week.
4H Chart Outlook
The 4H trend remains in an uptrend (higher lows).
Price has reacted from a 4H supply zone and is now retracing lower.
Focus is on the overlap between 4H dem
Nasdaq to 25,300? | Long Idea 10/3I believe Nasdaq still has room to climb, with the 25,300 range in sight to finish off the week. The price action closely mirrors the pattern from September 5th–9th, 2025, and I wouldn’t be surprised to see history repeat itself here.
I’m planning to go long from the 25,105 imbalance, holding throu

Nasdaq Buy idea Based on previous data Nasdaq should expect a push upwards. I’ve marked charts with reasoning and added SL and TP levels. Good luck

See all ideas
Summarizing what the indicators are suggesting.
Neutral
SellBuy
Strong sellStrong buy
Strong sellSellNeutralBuyStrong buy
Neutral
SellBuy
Strong sellStrong buy
Strong sellSellNeutralBuyStrong buy
Neutral
SellBuy
Strong sellStrong buy
Strong sellSellNeutralBuyStrong buy
A representation of what an asset is worth today and what the market thinks it will be worth in the future.
Displays a symbol's price movements over previous years to identify recurring trends.
Frequently Asked Questions
The current price of NASDAQ 100 E-mini Futures is 25,061.00 USD — it has fallen −0.47% in the past 24 hours. Watch NASDAQ 100 E-mini Futures price in more detail on the chart.
The volume of NASDAQ 100 E-mini Futures is 5.50 K. Track more important stats on the NASDAQ 100 E-mini Futures chart.
Open interest is the number of contracts held by traders in active positions — they're not closed or expired. For NASDAQ 100 E-mini Futures this number is 280.78 K. You can use it to track a prevailing market trend and adjust your own strategy: declining open interest for NASDAQ 100 E-mini Futures shows that traders are closing their positions, which means a weakening trend.
Buying or selling futures contracts depends on many factors: season, underlying commodity, your own trading strategy. So mostly it's up to you, but if you look for some certain calculations to take into account, you can study technical analysis for NASDAQ 100 E-mini Futures. Today its technical rating is buy, but remember that market conditions change all the time, so it's always crucial to do your own research. See more of NASDAQ 100 E-mini Futures technicals for a more comprehensive analysis.