ES1 - Can A Fartcoin Predict A FOMC CorrectionThis is not a high certainty call but there are warning in lower dominance meme coins that may perhaps be signalling bearish action in the crypto that may be part of a canon to signal bearish action post FOMC.
So, a speculative call, but I have adjusted risk based on this.
This analysis is shared
S&P 500 E-mini Futures
No trades
About S&P 500 E-mini Futures
S&P 500 — short for Standard and Poor's 500, is a United States stock market index based on the market capitalizations of the top 500 companies that have common stock listed on the New York Stock Exchange or NASDAQ. With its headquarters in New York City and dating back to 1860, Standard and Poor's has offices in 23 countries and maintains the SP 500 index. Over $1.25 trillion USD is indexed to Standard and Poor's portfolio of indices, which includes the S&P 500. The S&P 500 index seeks to reflect the status of the whole stock market by tracking the return and volatility of the 500 most commonly held large cap company stocks on the NYSE, capturing approximately 80% of total market capitalization. The 500 companies comprising the SP500 span all major industries and are selected based on their market capitalization, liquidity, ability to be traded, as well as other factors. Additionally, the importance of the SP500 is highlighted by its use as an economic indicator of the health of the United States economy.
Related futures

ES UpdateI think ES bounces when NA hits oversold, but there is a chance that ES needs to go oversold too.
Recommend waiting until Monday to go long.

From Shutdown Relief to AI Anxiety — Two Narratives Driving ESMarket Theme
The week began on a strong footing, driven by a bullish Sunday reopen in ES after news broke that the 43-day government shutdown was set to end, following the Senate’s late-night support for a potential agreement on November 9th. This relief catalyst created early upside momentum, pus

ES (SPX, SPY) Analysis, Levels, Setups for Fri (Dec 12)CONFIRMED EVENTS - FRI 12/12 (ET)
13:00 - Baker Hughes U.S. rig count
15:30 - CFTC Commitments of Traders (COT) release (usual time)
Theme risk: liquidity headlines remain in play with the Fed starting reserve-management T-bill buying on 12/12 (not a data print, but worth respecting).
Market Analy
ES - December 11th - Daily Trade PlanDecember 11th- Daily Trade Plan - 6:45am
*Before reading this trade plan, if you did not read yesterday's take the time to read it first! (You can view the posts in the related publication section) *
If my posts provide quality information that has helped you with your trading journey. Feel free t

SP500 Remains Bullish After The FED MeetingS&P 500 has made a very nice retracement recently; in fact for almost the whole November we have seen a pullback of around 5 to 6%, which is quite a lot for the S&P 500, and what is really important is that the market has stopped around the 6500 area, which basically goes back to October 10th when w

AMP Futures - How to set alerts for Volume footprint chartsIn this idea we will demonstrate how to set alerts with Volume footprint charts.

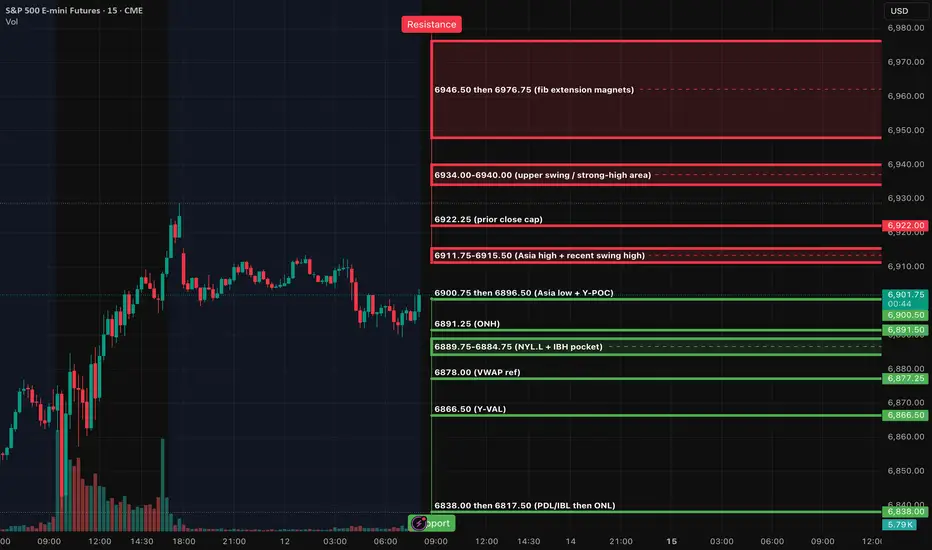
ES (SPX, SPY) Week-Ahead Analysis (Dec 15-19, 2025)Market Overview: The Week Ahead
This week marks a pivotal moment for the markets as focus shifts from narratives to hard data. Key economic indicators will be released, including U.S. jobs figures on Tuesday and the Consumer Price Index (CPI) on Thursday, both scheduled for 8:30 AM ET. Additionall

ES (SPX, SPY) Analyses, Key Levels, Setups for Tue (Dec 16th)
As we head into Tuesday, ES is showing signs of structural weakness following a significant sell-off, culminating in a late dip into the 6845-6840 demand zone. The prevailing trend appears to be downward as long as prices remain beneath the resistance range of 6863-6874. However, the 6845-6840 supp

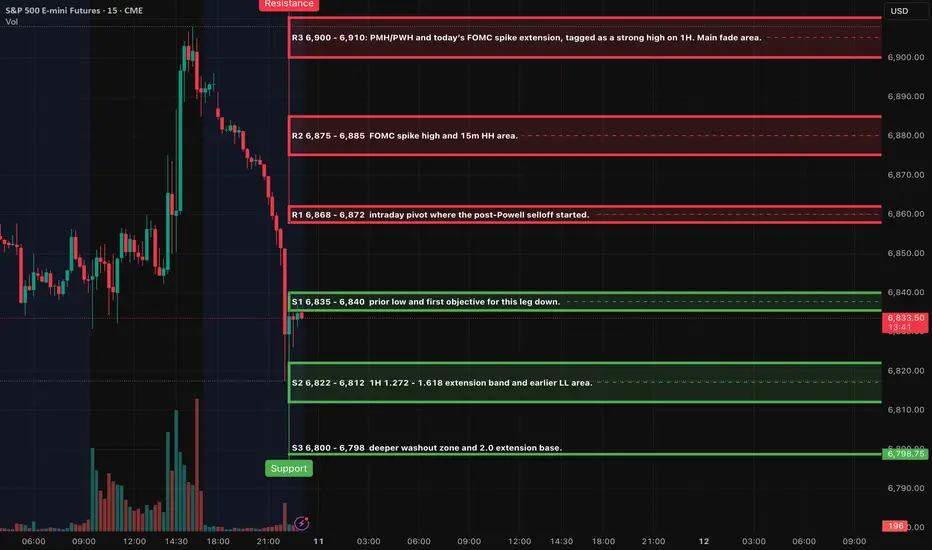
ES (SPX, SPY) Analysis, Key Levels for Thu (Dec 11th)The recent market decline has evolved into a significant liquidation wave rather than a standard pullback. Following the FOMC's interest rate cut and Jerome Powell's cautious commentary, the E-mini S&P 500 (ES) initially surged to a post-Fed high around 6,908 but then experienced a sharp reversal. T
See all ideas
Summarizing what the indicators are suggesting.
Neutral
SellBuy
Strong sellStrong buy
Strong sellSellNeutralBuyStrong buy
Neutral
SellBuy
Strong sellStrong buy
Strong sellSellNeutralBuyStrong buy
Neutral
SellBuy
Strong sellStrong buy
Strong sellSellNeutralBuyStrong buy
A representation of what an asset is worth today and what the market thinks it will be worth in the future.
Displays a symbol's price movements over previous years to identify recurring trends.
Frequently Asked Questions
The current price of S&P 500 E-mini Futures is 6,850.75 USD — it has risen 0.26% in the past 24 hours. Watch S&P 500 E-mini Futures price in more detail on the chart.
The volume of S&P 500 E-mini Futures is 5.47 K. Track more important stats on the S&P 500 E-mini Futures chart.
Open interest is the number of contracts held by traders in active positions — they're not closed or expired. For S&P 500 E-mini Futures this number is 1.59 M. You can use it to track a prevailing market trend and adjust your own strategy: declining open interest for S&P 500 E-mini Futures shows that traders are closing their positions, which means a weakening trend.
Buying or selling futures contracts depends on many factors: season, underlying commodity, your own trading strategy. So mostly it's up to you, but if you look for some certain calculations to take into account, you can study technical analysis for S&P 500 E-mini Futures. Today its technical rating is buy, but remember that market conditions change all the time, so it's always crucial to do your own research. See more of S&P 500 E-mini Futures technicals for a more comprehensive analysis.