Day 58 — Trading Only S&P Futures | +$304 & Easy FOMC GainsRecap & Trades
Day 58 — clean and easy.
We had some conflicting signals early, but once the structure aligned, it became a straightforward session.
The key takeaway today was how FOMC movement tends to cap between 30–60 points, which makes it easy to plan trades if you size stops properly.
Overall, simple setups, small size, steady gain — +$304 for the day.
Lesson & Mindset
You don’t have to trade aggressively to make progress.
Low-effort, high-consistency days are often where real edge compounds.
I’m learning that keeping your head calm on choppy news-driven days is what separates pros from gamblers.
News & Levels
Powell’s comments cooled expectations for further rate cuts, causing the Dow to fade late in the session.
Tomorrow’s levels: Above 6885 bullish, below 6840 bearish.
Trade ideas

ES - October 24th - Daily Trade PlanOctober 24th - 6:35am
*Before reading this trade plan, IF, you did not read yesterdays, or the Weekly Trade Plan take the time to read it first! (You can see both posts in the related publication section) *
If my posts provide quality information that has helped you with your trading journey. Feel free to boost it for others to find and learn, also!
My daily trade plan and real-time notes that I post are intended for myself to easily be able to go back and review my plan and how I did from an execution perspective.
----------------------------------------------------------------------------------------------------------------
Yesterday, I stated "IF price can reclaim 6751 area, we should back test to the 6768-70 level. Above 6750 and bulls are back in control. My general lean is that we need to at least retest 6717 level and reclaim we should get a few quick points. IF price loses 6717, we most likely retest the 6695 level and 6674, 6653 are 2 main levels I would be looking for a flush and reclaim to grab points."
We dropped to 6719, cleared 6726 (Which was a strong support level as you can see on the 15min chart overnight at 8pm a massive institutional candle that held 6717 support) and we came back down, grabbed liquidity and then rallied into 6750 resistance, sold off to retest that level and we rallied all day and overnight.
-------------------------------------------------------------------------------------------------------------------
Overnight low is 6777 and overnight high is 6798. We have tested this 6798 level 2x overnight and we should get a pull back and then clear on next attempt. We have CPI at 8:30am. While price should hold 6777 and continue higher, we have rallied nearly 100pts into a big data event and we need to be cautious as it could get volatile.
Key Levels Today -
1. Loss of 6784 and reclaim
2. Loss of 6774-77 and reclaim
3. Loss of 6763 and reclaim
4. Loss of 6758 (maybe as low as 6750) and reclaim
IF price really sells off, the loss of 6742 (maybe as low as 6736) and reclaim would be a good spot. Ideal area would be loss of 6720 and reclaim.
We have to view price action as bullish until the trend changes. That would need a loss of 6695 to change that structure. Short term, we need to hold 6750 with 6726 being the lowest or we could flush to 6690-95.
Key Support Levels - 6784, 6777, 6774, 6763, 6750, 6744, 6726, 6720, 6711, 6793, 6690
Key Resistance Levels - 6798, 6807, 6812, 6815, 6822, 6827, 6836
I will post an update around 10am EST.
----------------------------------------------------------------------------------------------------------------
Couple of things about how I color code my levels.
1. Purple shows the weekly Low
2. Red shows the current overnight session High/Low (time of post)
3. Blue shows the previous day's session Low (also other previous day's lows)
4. Yellow Levels are levels that show support and resistance levels of interest.
5. White shows the trendline from the August lows

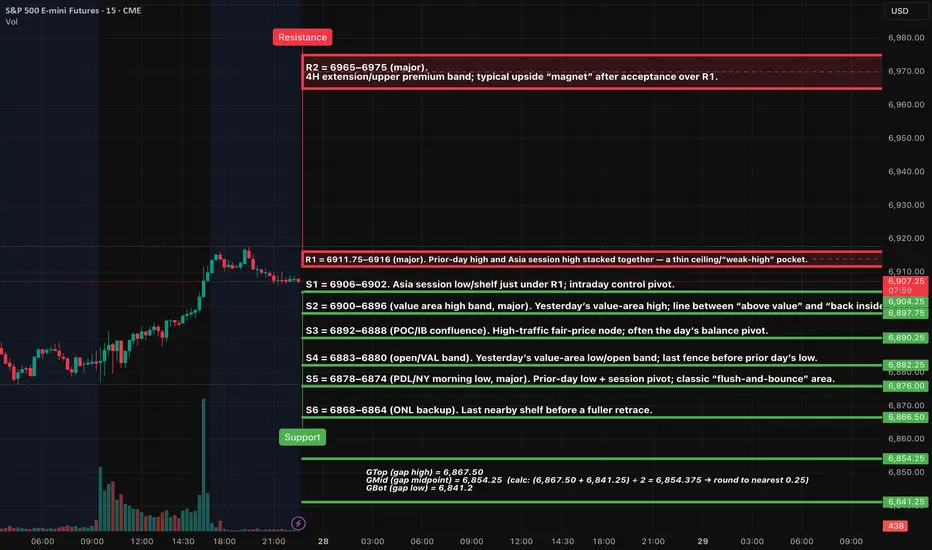
ES (SPX, SPY) Analysis, Key Levels, Setups for Wed (Oct 29)As we look at the current market conditions, the price is hovering just below the 6939-6946 resistance level. We should anticipate a test of this ceiling soon. A solid acceptance above 6946 on the 15-minute chart would likely trigger a movement towards the 6965-6975 range, which we can expect to see during the afternoon session in NY.
In terms of our range path, if we see rejection in the 6939-6946 zone, we will need to monitor for rotations between 6939, 6928, and 6916. A clean break beyond any of these levels will help establish our direction moving forward.
On the downside, a decisive 15-minute close below the 6916-6912 area could lead us back to the 6900-6896 levels. If that support fails, we could see a drop to 6892-6888, and then down to 6883-6880. Persistent acceptance below our S5 level would promote a further decline towards 6868-6864 and potentially trigger the gap references.
Lastly, I want to highlight that we should expect a compression-to-expansion behavior in the market. Thus, the first acceptance beyond R1 or below S0 will likely dictate the market's direction for the day.
Level-KZ Protocol (15/5/1). Execute inside London 02:00–05:00 (opt), NY AM 09:30–11:00, NY PM 13:30–16:00.
Working levels: R2 6965–6975; R1 6939–6946; MP 6928–6924; S0 6916–6912; S2 6900–6896; S3 6892–6888; S4 6883–6880; S5 6878–6874.
SETUP 1 — Acceptance-Continuation LONG (through R1)
Trigger: 15m close ≥ 6946, then 5m pullback holds above 6940 and re-closes; 1m HL entry.
Entry: 6942–6946 on the reclaim/HL.
SL: Hard SL below the 15m pullback wick (typically 6937–6939) ±0.25–0.50.
TP1: 6965–6975 (R2).
TP2: Leave runner only if momentum persists beyond R2 during NY PM.
Invalidation: 15m close back under 6939 with a 5m LH.
SETUP 2 — Rejection-Fade SHORT (at R1)
Trigger: Sweep into 6939–6946 that fails → 15m close back inside; 5m LH + 1m first pullback failure.
Entry: 6937–6943 on the fail.
SL: 6948–6950.
TP1: 6928–6924 (MP).
TP2: 6916–6912 (S0).
Stretch: 6900–6896 (S2) if acceptance forms below S0.
Invalidation: 15m acceptance ≥ 6946.
SETUP 3 — Quick-Reclaim Bounce LONG (MP)
Trigger: Fast flush into 6928–6924 that instantly reclaims on 1m and prints a 5m re-close.
Entry: 6926–6929 on the reclaim.
SL: 6923.25–6923.75.
TP1: 6939–6946 (R1).
TP2: 6965–6975 (R2) only after 15m acceptance through R1.
Invalidation: 15m close back below 6924.
SETUP 4 — Quick-Reclaim Bounce LONG (S0 flip)
Trigger: Sweep/flush into 6916–6912, immediate reclaim → 5m re-close.
Entry: 6917–6920 on strength back above 6916.
SL: 6911.50–6912.00.
TP1: 6928–6924 (MP).
TP2: 6939–6946 (R1).
Invalidation: 15m body-through below 6912.
SETUP 5 — Back-Inside Failure SHORT (under S2)
Trigger: 15m body close < 6896, then 5m retest of 6900–6896 holds from below.
Entry: 6898–6900 on the fail.
SL: 6903.00–6903.50.
TP1: 6892–6888 (S3).
TP2: 6883–6880 (S4).
Stretch: 6878–6874 (S5) — expect bounce attempts.
Invalidation: 15m reclaim ≥ 6900 with 5m re-close.
ES UpdateNo rate cut in December? WHo cares? META missed earnings? Who cares? MSFT down after earnings? WHo cares?
The melt up must continue until the daily gets overbought, lol. Gotta set up for the China trade deal news.
You can see that the algos did sell some today, but futures are flat right now despite META miss.
Note: 30 year bond yields went back up to Sept levels because the December cut was priced in. Mortgage rates will actually go up, not down from this cut.

Generals Charge, Soldiers Stall: Reading Bearish Divergence1. Context: The Battle Line Between Large and Small Caps
This week’s futures landscape paints a striking contrast between leadership and hesitation. In the CME equity index universe, the large caps — ES (E-mini S&P 500), NQ (E-mini NASDAQ 100), and YM (E-mini Dow Jones) — advanced as a united front, all opening above their prior week’s highs. The market generals were charging confidently uphill.
Yet, on the same battlefield, the RTY (E-mini Russell 2000) lagged behind. The small caps failed to take out the prior week’s high and opened below the aggressive gaps that marked their larger counterparts. In trader terms, breadth was narrowing. In storyteller terms, the generals were calling “forward!” — but the soldiers weren’t following.
Such divergences in participation often mark transition zones in market psychology. When large caps push while small caps stall, it doesn’t necessarily mean the campaign is lost — but it does mean confidence among the broader troops is weakening.
2. Reading the Divergence: When Breadth Narrows
The relationship between large-cap and small-cap indices often reveals more than just price action — it exposes the structure of conviction. In sustained bullish environments, small caps tend to lead or at least confirm the move. Their participation signals that risk appetite is healthy across the field, not confined to the biggest names.
When that breadth fades, the advance becomes fragile. A rally driven only by mega-cap components (the generals) can stretch further, but with decreasing participation, it becomes increasingly vulnerable to shocks. Traders who watch intermarket behavior know this phenomenon as bearish divergence — higher highs in the generals, lower or flat highs in the soldiers.
From a practical standpoint, narrowing breadth implies that fewer sectors are carrying the index higher. In other words, the market’s engine is running on fewer cylinders. This is not a timing trigger on its own, but it is a powerful contextual clue suggesting that volatility could expand when the leadership stumbles.
3. Quantifying the Risk: Supports and Market Depth
Looking beneath price, Order Flow (UnFilled Orders) provides a sense of where liquidity may reside once the current rally pauses. Key UFO support zones, acting as potential demand clusters, reveal how far the market might travel before encountering fresh buy interest.
From this week’s open:
ES shows its next support roughly 5.26% below current levels.
NQ sits around 6.25% below.
YM’s cushion lies approximately 9.39% beneath.
RTY, however, faces a much deeper air pocket — the next notable UFO support sits nearly 13.99% lower.
This asymmetry is critical. If markets retreat, small caps have the most unprotected downside terrain before reaching meaningful support. In other words, the generals may fall back a few miles, but the soldiers could tumble down the hill.
These percentages don’t guarantee a move — they outline the potential amplitude of correction if risk-off flows accelerate. The deeper the distance to support, the larger the volatility zone beneath.
4. Strategic View: Large Caps Lead, but Are They Overextended?
The current setup puts traders in a classic tactical dilemma:
Are the generals inspiring a new advance, or are they overextended and exposed?
Two plausible scenarios emerge:
Continuation scenario: If the small caps (RTY) regain strength and take out their prior week’s high, the breadth gap could close. This would validate the generals’ move and reestablish a broad-based advance.
Correction scenario: If RTY continues to stall while ES, NQ, and YM fail to sustain their gaps, it would confirm a divergence-led weakening. A close back below prior week’s highs could trigger a retreat toward the support zones identified earlier.
The idea is not to predict a reversal, but to prepare a framework in case weakness unfolds.
5. Contract Overview: E-mini and Micro Versions
To analyze or engage these markets, traders can study both E-mini and Micro E-mini contracts listed on the CME. These contracts represent standardized ways to participate in U.S. equity index movements, but at different notional sizes.
E-mini contracts (ES, NQ, YM, RTY) are the long-standing institutional benchmark instruments that track major U.S. equity indices with efficient liquidity and tight spreads.
Micro E-mini contracts (MES, MNQ, MYM, M2K) provide the same exposure pattern at one-tenth the size, offering more granularity in risk management and flexibility for smaller accounts or precise hedging.
It’s important to understand that these futures allow directional and hedging applications without requiring ownership of the underlying equities. However, as with any leveraged product, margin requirements can amplify both gains and losses. Traders should familiarize themselves with margin-to-equity ratios and maintenance requirements before participation.
S&P 500 – ES / MES
Minimum tick: 0.25 points
Tick value: $12.50 (E-mini) | $1.25 (Micro)
Typical margin: ≈ $21K (E-mini) | ≈ $2.1K (Micro)
NASDAQ 100 – NQ / MNQ
Minimum tick: 0.25 points
Tick value: $5.00 (E-mini) | $0.50 (Micro)
Typical margin: ≈ $30K (E-mini) | ≈ $3.0K (Micro)
Dow Jones – YM / MYM
Minimum tick: 1 point
Tick value: $5.00 (E-mini) | $0.50 (Micro)
Typical margin: ≈ $13K (E-mini) | ≈ $1.3K (Micro)
Russell 2000 – RTY / M2K
Minimum tick: 0.10 points
Tick value: $5.00 (E-mini) | $0.50 (Micro)
Typical margin: ≈ $9K (E-mini) | ≈ $0.9K (Micro)
Please note that all margin requirements are approximate and may be adjusted.
6. Risk Management Spotlight
Breadth divergences can test patience and positioning discipline. Managing exposure becomes as important as analyzing the signal itself.
Here are three core reminders:
Position Sizing: Adjust to volatility. If the distance to the nearest support is wide, scale down accordingly to maintain a consistent risk percentage per trade.
Stop-Loss Discipline: Predetermine exit points based on technical invalidation, not emotion.
Capital Preservation: Capital is ammunition; running out of it limits participation when true opportunity returns.
In the end, risk management isn’t about avoiding loss; it’s about surviving long enough to thrive when clarity returns. When markets are divided between generals and soldiers, maintaining balance becomes a trader’s greatest edge.
7. Educational Takeaway
The “generals vs. soldiers” analogy reminds us that market structure is not just about price—it’s about participation. When large caps surge but small caps lag, it signals a potential exhaustion point in the broader advance. The healthiest rallies are those in which all troops move in sync.
For traders and investors, breadth divergences serve as an early-warning system, not a countdown clock. They encourage a review of exposure, tighter stop placement, and a shift toward risk-awareness rather than return-chasing.
At this stage, the technical setup across U.S. index futures reads like a fragile truce: ES, NQ, and YM maintain their gains above prior-week highs, while RTY still lingers below. Should the soldiers eventually follow, confidence could rebuild. But if the generals start retreating first, the path toward their UFO supports could unfold quickly.
The core takeaway: breadth divergences don’t predict timing—they illuminate imbalance. Recognizing that imbalance early allows traders to respond intelligently instead of react emotionally when volatility expands.
When charting futures, the data provided could be delayed. Traders working with the ticker symbols discussed in this idea may prefer to use CME Group real-time data plan on TradingView: www.tradingview.com - This consideration is particularly important for shorter-term traders, whereas it may be less critical for those focused on longer-term trading strategies.
General Disclaimer:
The trade ideas presented herein are solely for illustrative purposes forming a part of a case study intended to demonstrate key principles in risk management within the context of the specific market scenarios discussed. These ideas are not to be interpreted as investment recommendations or financial advice. They do not endorse or promote any specific trading strategies, financial products, or services. The information provided is based on data believed to be reliable; however, its accuracy or completeness cannot be guaranteed. Trading in financial markets involves risks, including the potential loss of principal. Each individual should conduct their own research and consult with professional financial advisors before making any investment decisions. The author or publisher of this content bears no responsibility for any actions taken based on the information provided or for any resultant financial or other losses.

Tuesday, Oct 21st Weekly Forecast UPDATES!Welcome to the Weekly Forecast Updates!
In this video, we will analyze the following markets: DXY, EURUSD, GBPUSD, NASDAQ, S&P500
Enjoy!
May profits be upon you.
Leave any questions or comments in the comment section.
I appreciate any feedback from my viewers!
Like and/or subscribe if you want more accurate analysis.
Thank you so much
Disclaimer:
I do not provide personal investment advice and I am not a qualified licensed investment advisor.
All information found here, including any ideas, opinions, views, predictions, forecasts, commentaries, suggestions, expressed or implied herein, are for informational, entertainment or educational purposes only and should not be construed as personal investment advice. While the information provided is believed to be accurate, it may include errors or inaccuracies.
I will not and cannot be held liable for any actions you take as a result of anything you read here.
Conduct your own due diligence, or consult a licensed financial advisor or broker before making any and all investment decisions. Any investments, trades, speculations, or decisions made on the basis of any information found on this channel, expressed or implied herein, are committed at your own risk, financial or otherwise.

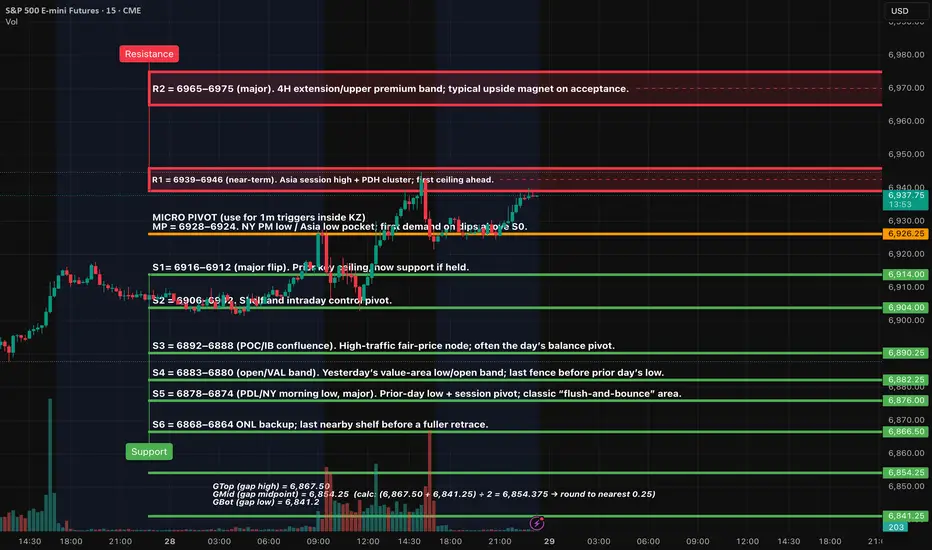
ES (SPX, SPY) Analysis, Key Levels, Setups for Tue (Oct 28th)ES Context:
The trend is upward on the higher time frame, approaching a "weak-high" area just above the previous day's high (PDH). With FOMC Day-1 and consumer confidence news approaching, I expect the Asia and London sessions to trade within a range around or below the PDH, with a risk of a sweep and retest before any potential extension. The bias is slightly bullish as long as we remain above yesterday’s value area. The invalidation point is a 15-minute close below the previous day's low (PDL).
Setup 1 — Long above R1 (acceptance continuation)
Trigger: 15m full-body close ≥ 6912, then 5m pullback holds/re-closes above 6912.
Entry: 6913–6915
Stop: 6905
TP1: 6924–6930
TP2: 6965–6975
Cancel: if retest fails to hold above 6912.
Setup 2 — Short at R1 (rejection fade)
Trigger: Probe ≥ 6912 fails; 15m closes back below 6909; 5m LH re-close.
Entry: 6907–6910
Stop: 6917
TP1: 6900–6896
TP2: 6883–6880
Runner: 6878 → 6867.50 if momentum continues.
Setup 3 — Long from GMid (partial gap-fill reclaim )
Trigger: Wick into 6852–6855, then 5m reclaim ≥ 6856.
Entry: 6856–6858
Stop: 6848
TP1: 6867.50 (GTop)
TP2: 6900–6906
Setup 4 — Long from GBot (full gap-fill reversal)
Trigger: Fast tag of 6841–6842, then 5m reclaim ≥ 6846.
Entry: 6846–6848 on retest hold
Stop: 6836
TP1: 6854.25 (GMid)
TP2: 6867.50 (GTop)
Cancel: 15m body closes back below 6841.
Execution rules
Trade inside kill-zones only (London 02:00–05:00 ET; NY AM 09:30–11:00; NY PM 13:30–16:00).
Take a setup only if TP1 ≥ 2.0R versus the stated stop.
At TP1 close 70% and set 30% runner to BE; no trailing before TP2.
Catalysts for Tue, Oct 28 (all times ET; all listed items expected to proceed despite the shutdown)
09:00 — S&P CoreLogic Case-Shiller Home Price Indices (private release).
10:00 — Conference Board Consumer Confidence (private release).
All day — FOMC Meeting (Day-1) begins; Day-2 statement/PC tomorrow.
13:00 — U.S. Treasury auctions (notes/bills as scheduled).
FYI tomorrow (Wed): 10:30 — EIA Weekly Petroleum Status (on schedule).
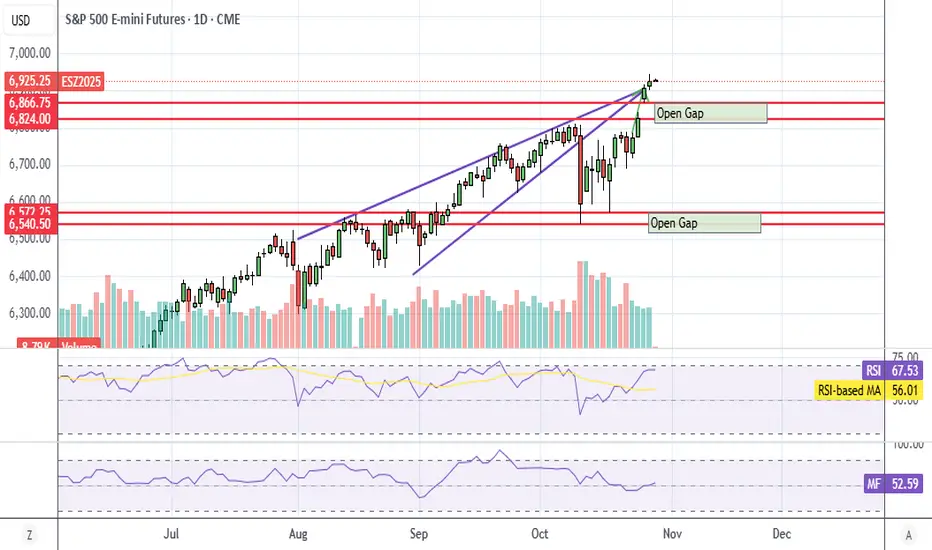
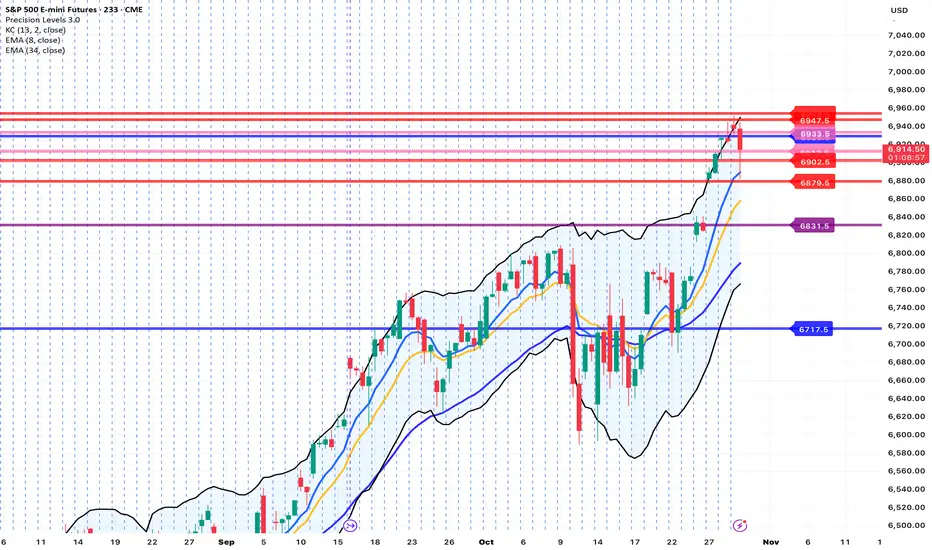
ES Daily Chart - Not Overbought YetLooks the ES is not overbought on the daily yet, so believe it or not, there's still room for a Fed pump or a China trade deal pump.
Wow.
I looked because futures are slightly green right now. Probably best not to short anything until after the Fed meeting. Watch out for China trade news Thu night.
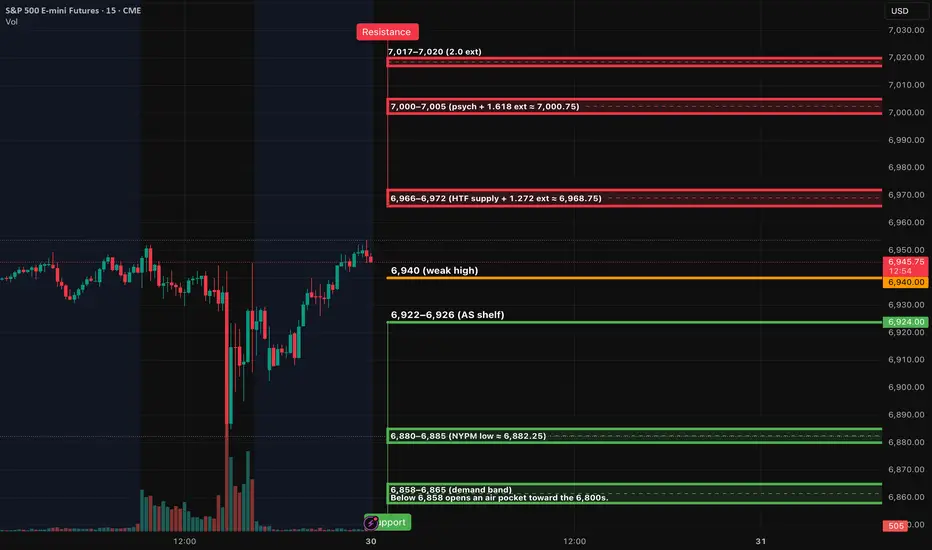
ES (SPX, SPY) Analysis, Key Zones, Setups for Thur (Oct 30th)Bias: Neutral → mild-bullish while 6,922 holds; momentum unlocks only on acceptance above the 6,966–6,972 pocket.
Setups — Rejection Fade (short): Tag 6,966–6,972 and print a 15m rejection close back inside, then a 5m re-close lower with a lower high, then take the 1m first-pullback fail. Stop = 15m wick high +0.25–0.50. TP1 = 6,940. TP2 = 6,922. Runner aims 6,885.
Setups — Acceptance Continuation (long): 15m full-body close above 6,972, 5m pullback holds and re-closes, then 1m higher-low entry. Stop = 6,966 wick. TP1 = 7,000. TP2 = 7,017. Stretch into low 7,040s if momentum persists.
Setups— Quick-Reclaim Bounce (long): Flush into 6,922–6,926 that instantly reclaims on 15m, 5m re-close confirms, then 1m higher-low entry. Stop = 6,916. TP1 = 6,940. TP2 = 6,966–6,972.
Setups — Breakdown Continuation (short): 15m body through 6,922 that holds below on a 5m retest. Stop = 6,929–6,932. TP1 = 6,900. TP2 = 6,885. Stretch 6,858 if pressure accelerates.
Management: only take a setup if TP1 is at least 2.0R using the 15m-wick stop. At TP1, close 70% and set the 30% runner to break-even; runner targets the next opposing major level. No trailing before TP2. Maximum two attempts per level per session.
Invalidation: Bull idea is invalid below 6,916 (loss of the AS shelf). Bear idea is invalid once there is 15m acceptance and hold above 6,972 with 5m higher-low structure.
Notes: Expect headline sensitivity. If we rip into 6,966–6,972 without a 15m close above, favor the fade. If we grind above and hold, ride acceptance toward 7,000 then 7,017.
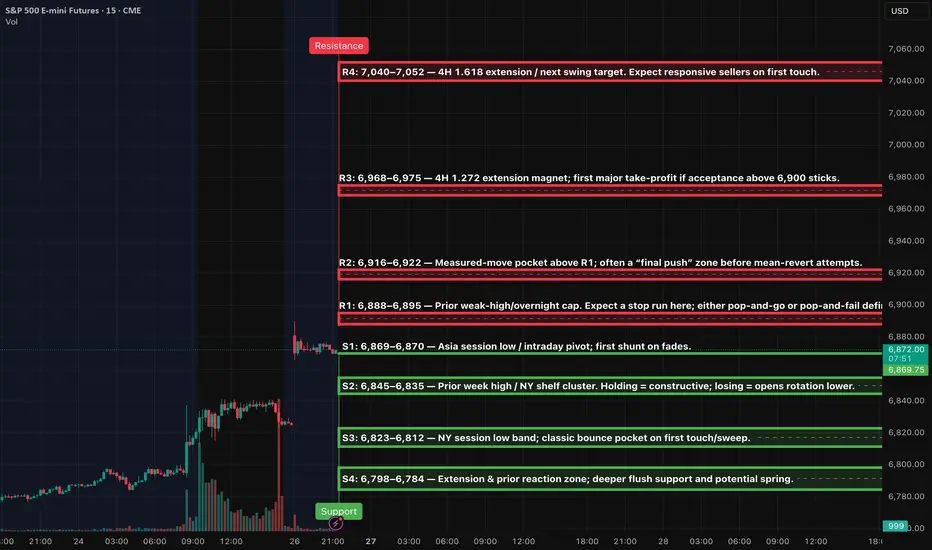
ES (SPX, SPY) - Week-Ahead Analysis, Levels Oct 27th - 31stBig picture (D/4H/1H )
Price is pressing a thin ceiling at 6,875–6,895. With ES at ATHs, the next upside extension targets sit at 6,968 → 7,044 → 7,128 on 4H. HTF trend is up, but intraday is stretched and vulnerable to a sweep-and-revert before any fresh leg.
Setups (Level-KZ Protocol 15/5/1)
1) Rejection Fade at R1 (Tier-1 A++):
Look for a sweep above 6,888–6,895, then a 15m close back inside the band → 5m re-close under ~6,885 → take the first 1m pullback that stalls below.
Entry: 6,886–6,892 on the retest from beneath
SL: above the sweep wick (15m anchor)
TP1: 6,845–6,835 (S2); TP2: 6,823–6,812 (S3); TP3: 6,798–6,784 (S4)
Viability check: TP1 ≥ ~2R vs 15m-wick SL. At TP1 close 70%, set 30% runner to BE; no trailing before TP2.
2) Acceptance Continuation above R1 (Tier-1 A++):
If 15m full-body closes ≥6,895, treat that as acceptance. 5m pullback holds 6,892–6,895 → buy the 1m HL.
Entry: 6,893–6,898 hold
SL: below 6,885 (15m wick anchor)
TP1: 6,968–6,975 (R3); TP2: 7,040–7,052 (R4)
Invalidation: 15m body back below 6,885.
3) Quick-Reclaim Bounce at S2 (Tier-2 A+):
Fast flush into 6,845–6,835, tag/sweep, then immediate 1m reclaim with a 5m re-close back above ~6,840.
Entry: on the reclaim/pullback that holds 6,838–6,842
SL: under 6,832 (15m wick)
TP1: 6,888–6,895 (R1); TP2: 6,916–6,922 (R2)
4) Exhaustion Flush Bounce at S4 (Tier-3 A):
If selling extends to 6,798–6,784 with momentum divergence/absorption, buy the first 1m reclaim that converts 6,792–6,796 into a floor.
SL: under 6,780 (15m wick)
TP1: 6,823–6,812 (S3); TP2: 6,845–6,835 (S2); optional TP3 6,888–6,895 (R1)
Week-ahead catalysts to watch (plan risk around these)
• Tue: Conference Board Consumer Confidence 10:00 ET.
• Wed (AMC): MSFT earnings.
• Thu 08:30 ET: US Q3 GDP (Advance); Thu (AMC): AAPL and AMZN earnings.
• Fri 08:30 ET: Personal Income & Outlays (incl. PCE); Fri 09:45 ET: Chicago PMI.
Expect headline-driven jolts around 08:30 ET Thu/Fri and at the big tech calls after the bell.
ES (SPX, SPY) Analysis, Key Levels, Setups for Fri (Oct 24)ES Two-Way Plan (A++) — Level-KZ 15/5/1
Calendar (ET) — Fri Oct 24:
08:30 CPI (Sept).
09:45 S&P Global flash Manufacturing/Services PMIs.
10:00 Univ. of Michigan Consumer Sentiment (final).
14:00 Federal Reserve Board open meeting.
Expect compression into 08:30 → expansion on release; execute inside NY AM 09:30–11:00 and PM 13:30–16:00 only.
Bias & overnight→NY forecast:
Into CPI, lean range-bound 6,770–6,787. A clean hold above the “weak-high” pocket should squeeze toward the 1.272–1.618 extension band; failure back inside favors a drift to the breakout shelves below. Treat the first post-CPI impulse as discovery; take the next confirmed 15m/5m/1m sequence only.
Setups - Level-KZ execution (15m→5m→1m)
1) Short Rejection Fade @ 6,785–6,787 (W3): 15m rejection closes back inside → 5m re-close below ~6,783.5 with LH → enter first 1m pullback that stalls beneath the shelf.
SL: above the 15m rejection wick ±0.25–0.50.
TP1: 6,776–6,777. TP2: 6,759–6,762. TP3: 6,739–6,744.
2) Long Acceptance Continuation > 6,797 (W3): 15m full-body close above 6,797 → 5m pullback holds/re-closes → 1m HL entry.
SL: below the 15m trigger/pullback wick ±0.25–0.50.
TP1: 6,818 (1.618). TP2: 6,830–6,835.
3) Long Quick-Reclaim Bounce @ 6,759–6,762 (W2): fast flush into the shelf → instant reclaim (15m wick, 5m re-close back above) → 1m HL entry.
SL: below the 15m flush wick ±0.25–0.50.
TP1: 6,776–6,777. TP2: 6,785–6,787.
4) Short Acceptance Breakdown < 6,759 (W2): 15m body-through below 6,759 → 5m confirms → 1m LH entry.
SL: above 15m trigger wick ±0.25–0.50.
TP1: 6,739–6,744. TP2: 6,720–6,725.

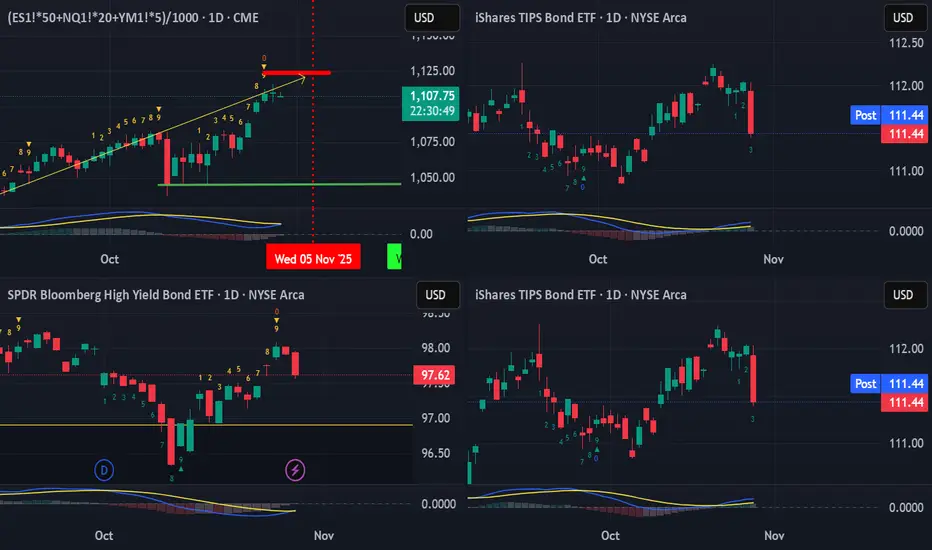
US Equities have this week left... Part IISo, yesterday heads up was given that the US Equities (and pretty much global equities generally) have this week left of bullishness.
This was observed with a TD Bear Setup perfected completion, coming into a stall. What was not mentioned was that the leading indicators of JNK, TIP and TLT were already showing signs of imminent breakdown (to understand about these three leads, refer to the book: Anatomy of the Bear by Russell Napier)
So just wanted to show it more obviously here.
While the US Equities were in a bit of a stall to close slightly positive, the three leads were clearly Bearish in the candlestick patterns with a single wipeout bearish, near marubozu, down candlestick that wiped out at least three days to two weeks of gain.
This like a slap in the morning while we are at the sweetest part of the dream.
Heads up, wake up!
Btw, with this kind of risk-off, crypto would not be spared either.
Short, sharp, sweet...
ES - October 30th - Daily Trade PlanOctober 30th - 6am
*Before reading this trade plan, IF, you did not read yesterdays, or the Weekly Trade Plan take the time to read it first! (You can see both posts in the related publication section) *
If my posts provide quality information that has helped you with your trading journey. Feel free to boost it for others to find and learn, also!
My daily trade plan and real-time notes that I post are intended for myself to easily be able to go back and review my plan and how I did from an execution perspective.
---------------------------------------------------------------------------------------------------------
Yesterday we had some afternoon volatility. Prior to 2pm EST we had a big battle at the 6930 level. This level was finally lost after FOMC and we sold off very quickly into the 6901, 6889 levels. This happened very fast and as I stated on my Daily Trade Plan that we were looking for the flush and reclaim of 6889, 6901 (6908 being the safer option). I did not take a trade in the afternoon but watching price action it would have been difficult without having a large stop loss in place.
At 5:30pm I wrote the following note:
"Price back tested the 6937 level we sold off from, and we need to hold 6908, 6894 in the overnight session. There is a bull/bear line at 6908 that was battled today. My general lean is that we need to continue lower to the 6864-67 level or close the gap at 6827 and then move higher. We are still in a bullish trend and nothing bearish changes the trend until we lose 6690. I think we can continue higher, IF price can flush lower, close the gap and then move higher and clear 6950."
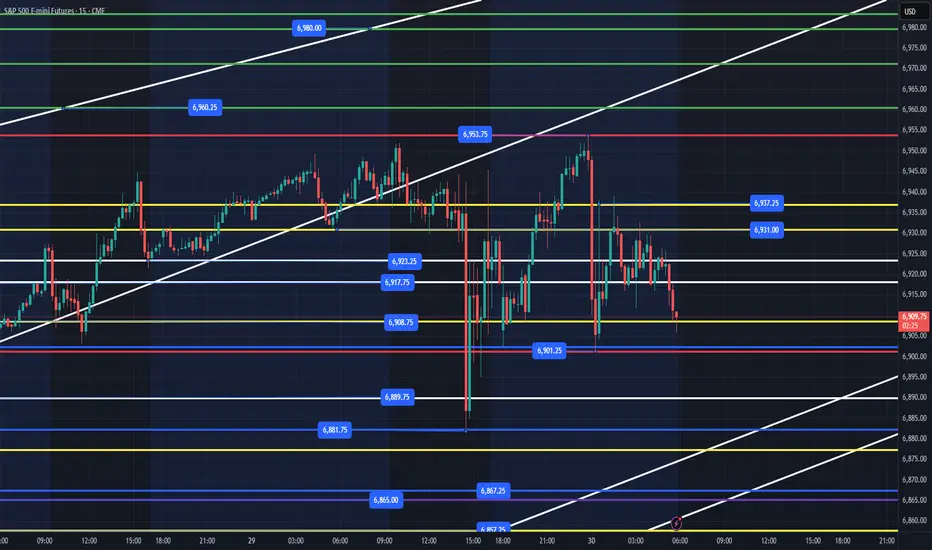
What has transpired overnight? We made our overnight high of 6953 and have held the 6901 level. As of typing this post, we are currently at 6906 and about to test the 6901 level for the 3x overnight. We may get one more bounce here or we may lose the 6901 level and have to test the 6881 (yesterday's low). We still have a large gap below that needs to be filled.
My general lean for today is that we can lose 6881 and reclaim to move higher and back test 6901. This could continue us higher. Ideally, we would get a nice flush of 6865-67 levels and reclaim to move us higher. We could have both happen today.
Key Levels Today -
1. Loss of 6908 and reclaim (This is the bull/bear line in this range between 6881-6953)
2. Loss of 6901 and reclaim (Weaker level now)
3. Loss of 6881 and reclaim
4. Loss of 6867-65 and reclaim
Below these levels and we will probably be selling off pretty hard, and I would probably let price find a support level below and build a base to move higher.
Key Support Levels - 6908, 6901, 6889,6878, 6867, 6857, 6841, 6827, 6812
Key Resistance Levels - 6908. 6917, 6931, 6937, 6953, 6960, 6980
IF price loses a level and you are not able to enter, wait for price to find another key level above, build a base and allow that level to become support. Then find a spot to enter for a level-to-level move.
I will post an update around 10am EST.
----------------------------------------------------------------------------------------------------------------
Couple of things about how I color code my levels.
1. Purple shows the weekly Low
2. Red shows the current overnight session High/Low (time of post)
3. Blue shows the previous day's session Low (also other previous day's lows)
4. Yellow Levels are levels that show support and resistance levels of interest.
5. White shows the trendline from the August lows
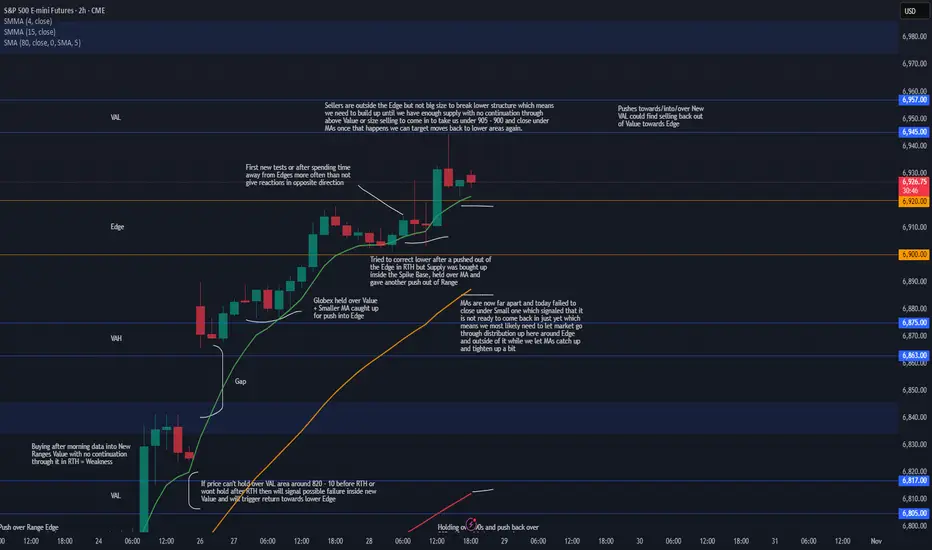
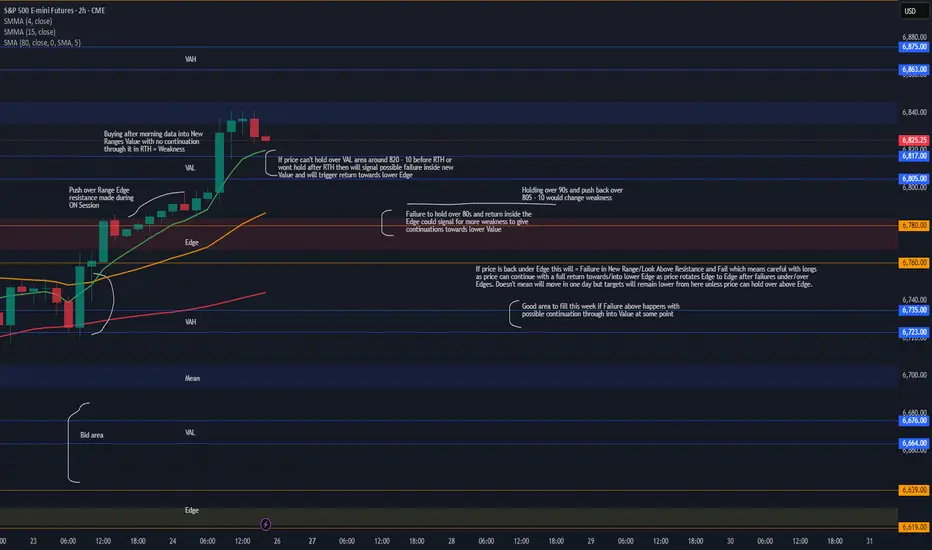
Week 10.26 - 10.31 Updated after GAPSunday Globex gapped up and held over Value which when MAs caught up gave us pushes into upper Edge. Edge areas often act as reversal spots on first tests or after we spend time away from them which it tried to do today but we had good enough buying inside the Spike Base and smaller MA which took in the supply and gave a rotation out of Edge, as we saw price got into VAL and reversed without holding.
There really is no reason for this gap over the weekend and pretty much everyone knows it will be filled but what market showed us today is that we are not ready to come in to start the process for gap fill yet, we have no size operating up here with it being Month End and FOMC tomorrow, FOMC may shake things up BUT we may need to let market balance some up here around Edge and out of it before we can build up the supply and at the same time let MAs catch up to tighten up some to give us a better correction back in.
For now we can see price hold in and out of Edge with pushes towards above VAL and maybe even pushes into/over it BUT careful looking for too much continuation into new Value as we have sellers over the Edge and MAs are far which means any pushes towards/into/over could find their way back out of Value towards lower Edge and eventually once we have enough supply or Volume we can see a push back into/under lower Edge that wont come back out and instead either continue or start holding under to start the process to move for lower targets. For that we would need to be under 905 - 900 area or be able to catch good entry above the Edge and ride it in once market is ready for that.
To see acceptance in this new Range and see more strength we would need to see Medium MA catch up and get over the Edge to provide better support when price pushes into new Value so that it can push in and hold around VAL, until then Small MA acts as Support but it is not something to build big positions on. For now I will be focusing on reversal shorts until market can hold under Hourly MAs and under Intraday VWAP to give better continuation trades lower, I will most likely avoid longs here as they are very choppy and by waiting for good short entries eventually one of them will be the one that will take us back under the Edge and maybe even continue into lower Value so want to be ready for it unless we see strength inside this new Range and good holds over around above VAL.
We have month end coming up and FOMC tomorrow, FOMC is always important but Month end might be more of a mover this time around, being at ATHs so far extended away from MAs on Daily and GAP below we could see profit taking last few days which could give us the pressure to head back under the Edge which would also take stops to add extra pressure for when everyone will be trying to get out so will be watching for that either after FOMC or Thursday/Friday.
ES - October 28th - Daily Trade PlanOctober 28th - 8:30am
*Before reading this trade plan, IF, you did not read yesterdays, or the Weekly Trade Plan take the time to read it first! (You can see both posts in the related publication section) *
If my posts provide quality information that has helped you with your trading journey. Feel free to boost it for others to find and learn, also!
My daily trade plan and real-time notes that I post are intended for myself to easily be able to go back and review my plan and how I did from an execution perspective.
---------------------------------------------------------------------------------------------------------------
Our overnight session high is 6917 (which we are coming into this area as I type this). We still have a massive gap that should be filled at some point this week. We have a lot of earnings, FOMC, Economic Data and Trump in Asia tour. It is also the end of the month with Institutions looking to keep price moving higher and trapping retail investors to fill their liquidity needs.
We are very extended on RSI with all time frames needing a pullback to reset and continue higher. We can sell off all the way down to 6810 and still be in a bullish trend. My lean is that we fill the gap and work our way down to the 6812-17 level and then continue higher. Ideally, we would sell off hard, scare retail investors, lose yesterday's low at 6867, reclaim and squeeze us higher. That could take a couple of days to do that, or we could get a rug pull any time.
Key Levels Today -
1. Loss of 6908 and reclaim
2. Loss of 6901 and reclaim
3. Loss of 6889 and reclaim
4. Loss of 6878 and reclaim
5. Loss of 6867 and reclaim
6. Loss of 6841 and reclaim
Key Support Levels - 6908, 6901, 6889,6878, 6867, 6857, 6841, 6827, 6812
Key Resistance Levels - 6917, 6923, 6930, 6946
We have to view price action as bullish until the trend changes. That would need a loss of 6720, 6690 to become bearish. Until then I anticipate the overnight gap closing, losing the 6812 level and reclaim would be a great spot, but we can easily move up with the loss of the key levels above and reclaims to grab points at.
In summary, IF price clears 6917 and then price can't hold 6906, we could flush lower. You can see the white trendline that has been respected overnight and below 6901, we are looking at 6889 to flush and reclaim. Below there and the loss of 6867 (yesterday's low) would be a great spot for some points.
I will post an update around 10am EST.
----------------------------------------------------------------------------------------------------------------
Couple of things about how I color code my levels.
1. Purple shows the weekly Low
2. Red shows the current overnight session High/Low (time of post)
3. Blue shows the previous day's session Low (also other previous day's lows)
4. Yellow Levels are levels that show support and resistance levels of interest.
5. White shows the trendline from the August lows
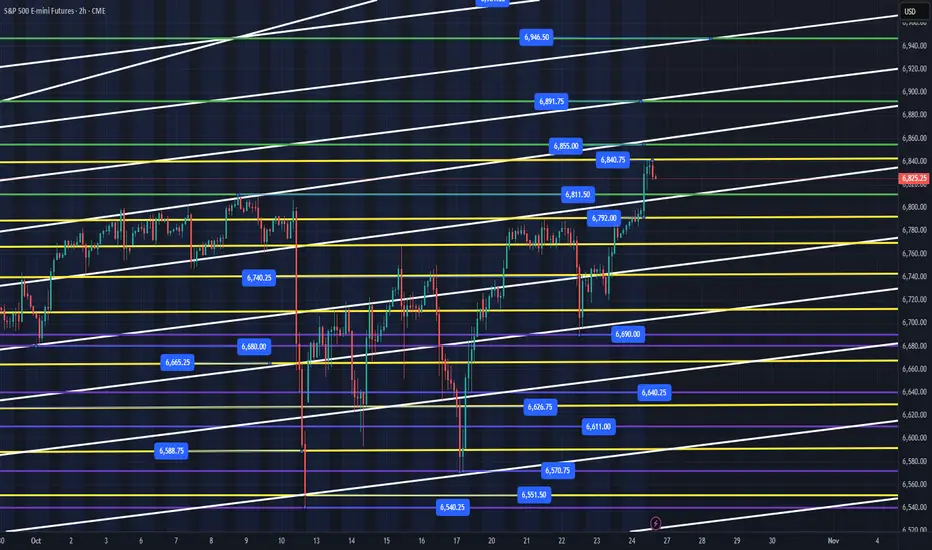
ES - Weekly Trading Plan - October 26th - 31stOctober 26th - 11:30am
We had a great week, and price continued higher with 6690 being the low for the week. We also finished close to the weekly high of 6840. We had some Trump/China Tweets over the weekend, and I am not sure how that will affect the open tonight. I do know that we need to hold 6811, 6792 on any quick flush out the gate at the open. 6760-66 is a key level this week and we should not see price move any lower than 6740-50 levels, IF price wants to keep running higher.
We do have end of month window dressing coming up with a lot of earnings, Fed meetings and other economic events that should provide some volatility.
Key Support Levels - 6811, 6792, 6763, 6742-50, 6703, 6690
Key Resistance Levels - 6840, 6855, 6891
Bullish Weekly Targets - 6855, 6891, 6946
Any flush of 6811 or 6792 and reclaim, should keep us moving higher overnight. I will have a better sense on Monday am when I post my Daily Trade Plan around 6am EST as to where price is and what levels we need to look for.
If you have been following me for any length of time, you know I am looking for some pullbacks to enter long. The trend in ES is up and should remain bullish, until we lose a significant level such as 6690 then we would need to re-evaluate.
Since we are on the last week of the month, my general lean is that we can continue to take price higher into the weekly targets above.
-------------------------------------------------------------------------------------------------------------
Purple Levels - Weekly Low
Green Levels - Weekly Targets
Yellow Levels - Daily Key Levels (See Daily Trade Plan)
White - Trendlines that may produce support/resistance alongside the horizontal trendlines
Week 10.26 - 10.31 PrepLast Week :
Last week Sunday Globex opened up inside Value over all the hourly and daily MAs signaling trend change from Fridays ON Flush and RTH Return to Value. Price pushed outside of Value before RTH and we got a push into Edge Resistance area which then gave a two day consolidation that failed back into Value after build up instead of pushing higher.
Hourly/Daily MAs below provided support as we didn't have enough volume to change the trend, instead price again rotated over the MAs and grinded higher into Resistance. Thursday Globex price grinded over resistance on low Volume and held over key area which brought in more buyers with morning Data giving it a push into new Ranges Value where those buyers could sell the product. If we had strength in new range we would have continued with buying into RTH to push price at least over New Ranges Mean but instead we stalled and closed with a rejection away from the Mean to end the Day.
This Week :
Pushes which are made on low volume and in ON hours over/under KEY areas like range tops/bottoms especially if they proved to be good resistance/support areas previously are very likely to fail and return back at least to the initial scene of the crime which looks to be the area under 780s after Thursdays Close.
Of course anything can happen and price may hold/accept in new range and we can start building up inside it to then visit higher targets later but we have been seeing topping patterns in this areas at/under 800s for quite some time and this weak push over the resistance is something to be careful with as market may be ready for correction to our HTF trend to finally start after very long run up with this being sort of blow off top move.
We will have to see how the price will open/hold Sunday Globex but things are pretty straight forward from here, if we cannot hold over/around Smaller Hourly's MAs over 820 - 10 area into or after RTH then this will signal failure in New Value which can trigger next steps to show failure in New Range and from there step by step could trigger a move back for lower MAs, back into/under Edge and eventually we would target lower targets like VAL / Move Into Value, from there we have to be careful because IF we actually go through Trend Change on Hourlys up here this time around then what we could see is holds that may seem like support but with changed trend market could continue giving continuation/holds/continuations lower as Failure in New Range can trigger a return all the way back into Previous Ranges Lower Edge. Does not mean it will or will not happen in one week but will eventually get there as long as price holds under upper Edge.
IF this happens then I would also warn about trend changing for a bit longer than what everyone is used to already as we may target even lower correction areas but that is HTF trend change with HTF Targets I have recently posted Daily Outlook which shows those areas. Careful with slower down days as if trend changes we would still be getting buying/covering on the way down so it may not just sell off quick and instead have more of leak lower days unless there is high volume.
For us to continue with strength and show acceptance in this new range we either need to Open and continue holding/pushing through New Value or at least hold over 780 - 90s on pull back with any dips into it having strong reaction away which would take us back over 805 - 10 area if we don't get that then we need to expect weakness.
ES - October 27th - Daily Trade PlanOctober 27th - 7:15am
*Before reading this trade plan, IF, you did not read yesterdays, or the Weekly Trade Plan take the time to read it first! (You can see both posts in the related publication section) *
If my posts provide quality information that has helped you with your trading journey. Feel free to boost it for others to find and learn, also!
My daily trade plan and real-time notes that I post are intended for myself to easily be able to go back and review my plan and how I did from an execution perspective.
----------------------------------------------------------------------------------------------------------------
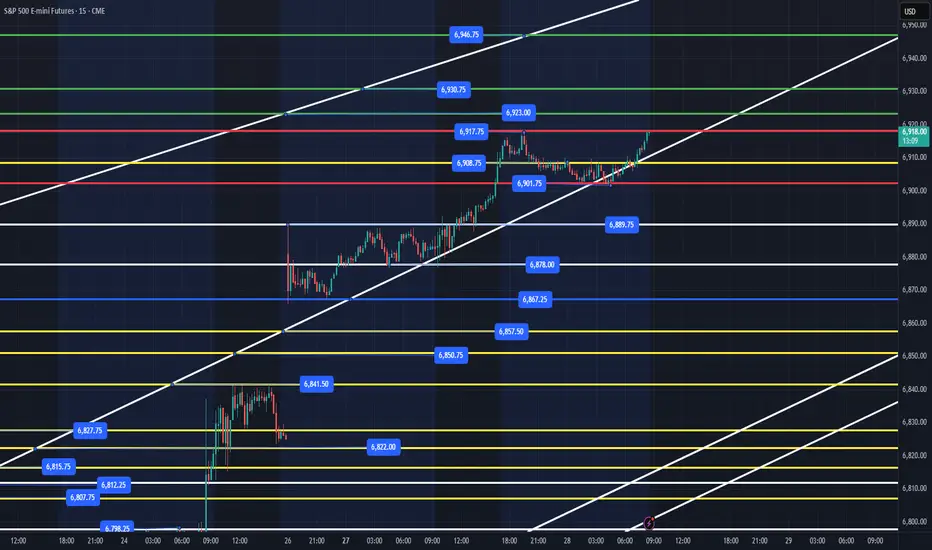
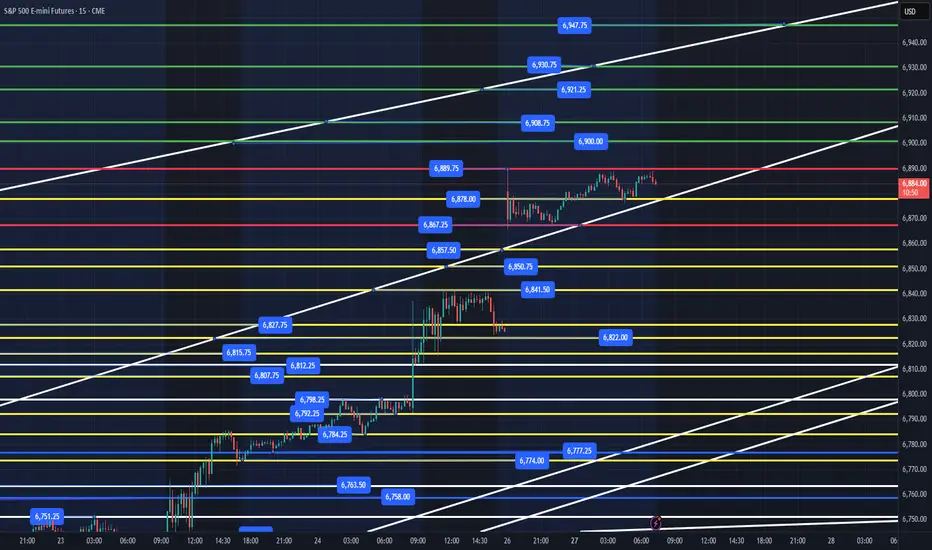
We gapped up overnight with 6890 our high and 6867 our low for the session as of writing this post. We have a massive gap that will be filled at some point in the next couple of days. We have a lot of earnings, FOMC, Economic Data and Trump in Asia tour. It is also the end of the month with Institutions looking to keep price moving higher and trapping retail investors to fill their liquidity needs.
We are very extended on RSI with all time frames needing a pullback to reset and continue higher. We can sell off all the way down to 6750 and still be in a bullish trend. My lean is that we fill the gap and work our way down to the 6784-92 level and then continue higher. Ideally, we would sell off hard, scare retail investors, lose Friday's low at 6777, reclaim and squeeze us higher. That could take a couple of days to do that, or we could get a rug pull any time.
Key Levels Today -
1. Loss of 6878 and reclaim
2. Loss of 6867 and reclaim
3. Loss of 6841 and reclaim
4. Loss of 6812 and reclaim
5. Loss of 6792 and reclaim
6. Loss of 6777 and reclaim
Key Support Levels - 6878, 6867, 6857, 6841, 6827, 6812, 6798, 6792, 6784, 6777, 6763
Key Resistance Levels - 6889, 6900, 6908, 6921, 6930, 6947
We have to view price action as bullish until the trend changes. That would need a loss of 6720, 6690 to become bearish. Until then I anticipate the overnight gap closing, losing the 6777 level and reclaim would be a great spot, but we can easily move up with the loss of the key levels above and reclaims to grab points at.
I will post an update around 10am EST.
----------------------------------------------------------------------------------------------------------------
Couple of things about how I color code my levels.
1. Purple shows the weekly Low
2. Red shows the current overnight session High/Low (time of post)
3. Blue shows the previous day's session Low (also other previous day's lows)
4. Yellow Levels are levels that show support and resistance levels of interest.
5. White shows the trendline from the August lows
ES - October 29th - Daily Trade PlanOctober 29th - 6:44am
*Before reading this trade plan, IF, you did not read yesterdays, or the Weekly Trade Plan take the time to read it first! (You can see both posts in the related publication section) *
If my posts provide quality information that has helped you with your trading journey. Feel free to boost it for others to find and learn, also!
My daily trade plan and real-time notes that I post are intended for myself to easily be able to go back and review my plan and how I did from an execution perspective.
---------------------------------------------------------------------------------------------------------
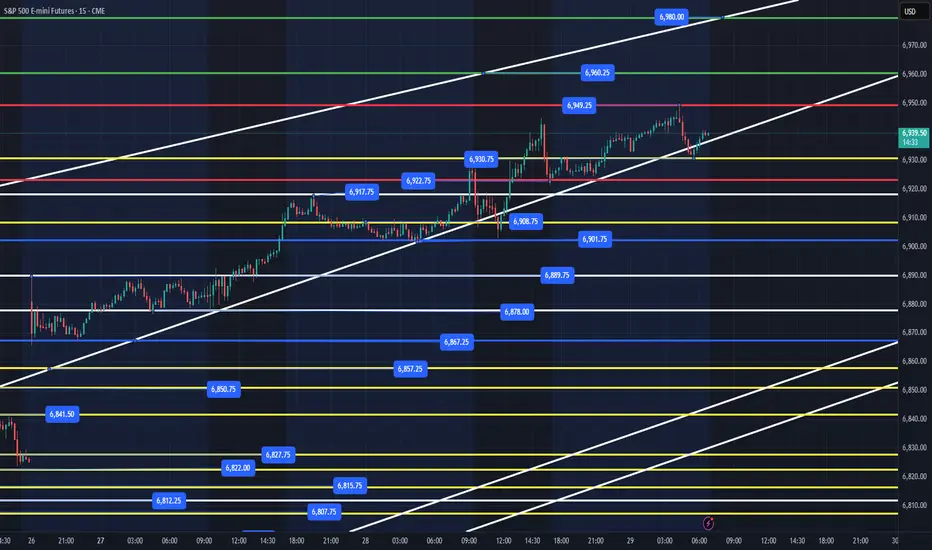
Yesterday at 4:05pm I wrote the following note on the Daily Trade Plan "Price has come back down to the VWAP session price at 6922. 6917 is a good support level and any reclaim of 6923 should give us a chance to retest the 6930, 6946 levels. FOMC tomorrow and I do not anticipate price losing 6917, 6908 in the overnight session. Any flush of 6901 and reclaim should give us a nice opportunity for some points."
Overnight session low was 6922 and the overnight high is 6950. We bounced off 6930 around 5:30am and have been respecting this trendline all week. Today is FOMC & Big Tech Earnings after the bell. As I have mentioned many times in my trade plans that when ES sells off you need to just get out the way. October 10th, 13th, 16th, 22nd are the 4 big sell offs we have had this month. I expect another big sell off this week or early next week. The RSI is very extended and since we have end of month in 2 days. We could easily keep moving higher. I do expect some pullbacks for us to grab points over the coming days.
We could easily reach 6980 today or fill the gap of Sunday's open at 6827. That is how unpredictable FOMC can be. Usually, the first move after FOMC can be a trap. Either way, today I would not trade unless your edge presents itself. I will be trying to grab points before noon today if at all possible!
Key Levels Today -
1. Loss of 6930 and reclaim
2. Loss of 6922 and reclaim
3. Loss of 6901 and reclaim with (6908 being a level to be reclaimed for a safer entry)
4. Loss of 6889 and reclaim
Below these levels and we will probably be selling off pretty hard, and I would probably let price find a support level below and build a base to move higher.
Key Support Levels - 6930, 6922, 6917, 6908, 6901, 6889,6878, 6867, 6857, 6841, 6827, 6812
Key Resistance Levels - 6949, 6960, 6980
I will post an update around 10am EST.
----------------------------------------------------------------------------------------------------------------
Couple of things about how I color code my levels.
1. Purple shows the weekly Low
2. Red shows the current overnight session High/Low (time of post)
3. Blue shows the previous day's session Low (also other previous day's lows)
4. Yellow Levels are levels that show support and resistance levels of interest.
5. White shows the trendline from the August lows
Day 57 — Trading Only S&P Futures | +$27 & Staying DisciplinedRecap & Trades
Day 57 — a slower day, but still a win for discipline.
We had X7 sell signals flashing early, hinting at downside, but the market structure stayed bullish and DP buy signals kept showing up.
I went long near the MOB zone at 11:30, got shaken out on a quick drop at 11:35, and eventually decided to step aside. Closed for a small gain of +$27.50.
Lesson & Mindset
Sometimes the right play is to walk away.
When signals conflict, overtrading only leads to frustration.
Days like this are great reminders that trading small and reviewing later can be just as productive as hitting big wins.
News & Levels
Main headline — S&P 500 hit a new record high today ahead of major tech earnings.
Tomorrow’s levels: Above 6885 bullish, below 6840 bearish.

Day 59 — Trading Only S&P Futures | +$142 & Netflix Split Recap & Trades
Day 59 — started off strong shorting 6930 resistance right out the gate.
Those early plays hit perfectly, and I built up about +$300 in profit.
Later, I got a little greedy — took a risky end-of-day setup, got stopped out right before a recovery, and ended up finishing at +$142.
Could’ve been a bigger day, but I’ll take a green close any time I stick to the plan.
Lesson & Mindset
Sometimes the best win is walking away with discipline intact.
Once you’re up early, your focus should shift from “how much can I make” to “how well can I protect it.”
That mindset compounds long-term consistency.
News & Levels
Big market story today — Netflix just announced a 10-for-1 stock split.
Tomorrow’s levels: Above 6920 bullish, below 6875 bearish.

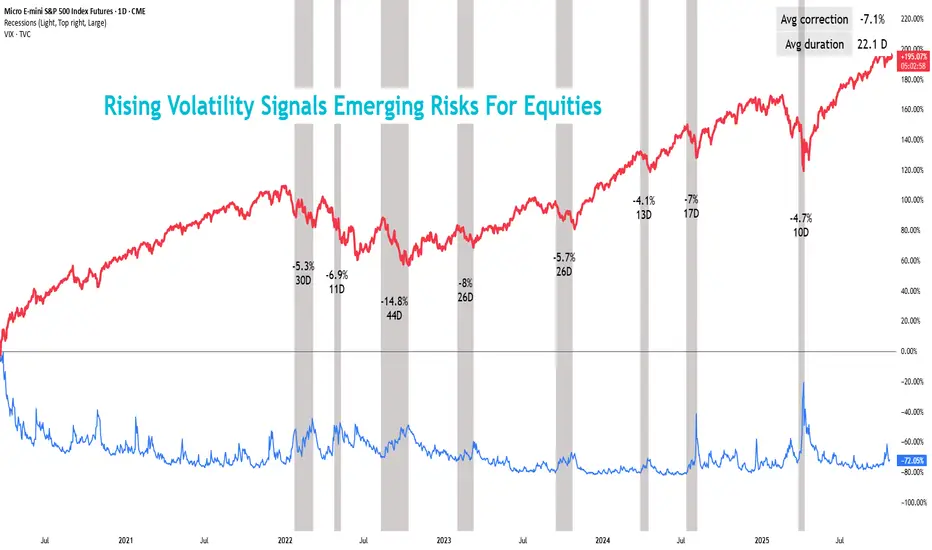
Rising Volatility Signals Emerging Risks For EquitiesFor all the headlines about inflation risk, interest rate uncertainty, and geopolitical instability, the S&P 500 hasn’t flinched much lately. Price ranges have narrowed, option premiums have deflated since April, and market volatility metrics remain stuck near cycle lows.
However, short-dated MES weekly options expiring 24/October — typically more responsive to shifts in implied volatility (IV) — showed an upward shift in the IV smile early in the month, pointing to renewed demand for downside protection.
Source: CME QuikVol
Historical volatility remains below implied levels, leaving scope for realised volatility to rise to implied levels. Current options positioning suggests that the next volatility move is likely to emerge from downside risk.
Source: CME QuikVol
The Cboe Volatility Index (VIX), reflecting 30-day expected volatility in the S&P 500, drifted toward 15 and stayed compressed for over a month. While this appeared stable, volatility is inherently mean-reverting — especially amid macro uncertainty, geopolitical risks, and year-end positioning.
Economic data have not justified a hawkish Fed stance, and markets expect another rate cut at the 29 October meeting. Additional uncertainty stems from the government shutdown, which delayed the September CPI release and left investors without timely inflation guidance. This has amplified market sensitivity to new data and headlines.
Meanwhile, Fed officials have turned more dovish, shifting attention from inflation to signs of labour market weakness.
Source: CME FedWatch
So far, the uncertainty has not prompted a broad flight to safety. Although the VIX has risen almost 60% this month, the S&P 500’s decline was just 1.2% as of 17 October. Markets appear hesitant to reprice risk aggressively without confirmation from data or the Fed — a shift that could accelerate near the 24/October CPI release.
When Volatility Snaps Back
Historically, volatility spikes have also driven sharp corrections in equity futures. Since 2022, the average duration of a VIX rise regime is about 22 days, with a 7% average correction in equity futures during that period.
This trend offers multiple opportunities for traders. With a week left for key macro data to come out and almost two weeks left for the next Fed meeting, a short-term position to gain from volatility expansion could be expressed by deploying a straddle using CME’s E-mini S&P 500 (ES) weekly options.
However, with VIX already elevated and reaching 28 late last week, further upside from long volatility trades appears limited. In contrast, a short equity futures position could still benefit from additional downside as uncertainty pressures equities.
As of this analysis, VIX had been rising for 7 days, implying that IV could stay elevated for roughly another 15 days based on historical regime durations. Notably, the larger portion of S&P futures’ correction typically occurs during the latter half of this rising volatility phase.
The average correction over the latter 15-days is almost 7x more than that observed in the first week of rising IV. And given the 1.3% decline so far in this cycle, there is still room for realised volatility to catch up via an additional 2.7% correction.
As on 17/Oct, MES options expiring on 31/Oct serves to capture the remaining 15-day window. Concentrated activity across key strikes in this contract indicates that options traders are pricing in a potential decline of roughly 3% to 7.7% in equity futures.
Source: CME QuikStrike
In an expanding volatility regime, short S&P 500 futures offer an alternative way to express views on rising volatility. Straddles suit uncertain bias but require larger moves to overcome time decay. With expectations of further downside and higher realised volatility, short futures may be better aligned.
Historical Example
The inverse correlation between VIX and equity index futures supports a directional bias tied to IV expectations. Historical VIX spikes show extended periods of elevated IV, typically aligning with a 7% average drawdown in equity futures.
A strategy that trades in line with the prevailing volatility trend can exploit this pattern. Assuming IV remains elevated, equity futures generally experience their steepest declines during the later part of rising VIX regime. Across the last eight major IV spikes, this relationship has held consistently.
The following historical analysis examines a strategy that moves with the prevailing volatility trend. The approach assumes that implied volatility (IV) will remain elevated for an extended period, during which equity futures tend to decline more sharply. As shown in prior instances, this pattern held true across the last eight major IV spikes.
A short MES futures position initiated seven days after a VIX spike has historically produced strong returns.
For example, during the July 2024 volatility surge (highlighted in green above), entering short at 5600 on 18 July (7 days after VIX started to rise) and exiting 15 days later at 5247 on 5 August would have yielded a profit of (5600 – 5247) × $5 = $1,765.
However, the strategy is not consistently profitable. During the September 2023 episode (highlighted in yellow above), a similar short position entered at 4368 on 21/September and exited 15 days later at the same level would have produced no gain, underscoring that historical tendencies serve as context, not certainty.
Alternatively, if volatility stabilises and uncertainty eases, short positions could also underperform as equities resume their ascent.
This content is sponsored.
MARKET DATA
CME Real-time Market Data helps identify trading set-ups and express market views better. If you have futures in your trading portfolio, you can check out on CME Group data plans available that suit your trading needs tradingview.com/cme .
DISCLAIMER
This case study is for educational purposes only and does not constitute investment recommendations or advice. Nor are they used to promote any specific products, or services.
Trading or investment ideas cited here are for illustration only, as an integral part of a case study to demonstrate the fundamental concepts in risk management or trading under the market scenarios being discussed. Please read the FULL DISCLAIMER the link to which is provided in our profile description.