Tuesday, Oct 21st Weekly Forecast UPDATES!Welcome to the Weekly Forecast Updates!
In this video, we will analyze the following markets: DXY, EURUSD, GBPUSD, NASDAQ, S&P500
Enjoy!
May profits be upon you.
Leave any questions or comments in the comment section.
I appreciate any feedback from my viewers!
Like and/or subscribe if you want more accurate analysis.
Thank you so much
Disclaimer:
I do not provide personal investment advice and I am not a qualified licensed investment advisor.
All information found here, including any ideas, opinions, views, predictions, forecasts, commentaries, suggestions, expressed or implied herein, are for informational, entertainment or educational purposes only and should not be construed as personal investment advice. While the information provided is believed to be accurate, it may include errors or inaccuracies.
I will not and cannot be held liable for any actions you take as a result of anything you read here.
Conduct your own due diligence, or consult a licensed financial advisor or broker before making any and all investment decisions. Any investments, trades, speculations, or decisions made on the basis of any information found on this channel, expressed or implied herein, are committed at your own risk, financial or otherwise.
Trade ideas

SANTA RALLY OR BLACK FRIDAY ...... THOUGHTS?This is this weekend's whiteboard projections for the next 6months.
This shows a slight reclaim this week but a continuation of lower highs and lower lows.
Then a drop to the bottom of the narrower channel when China tariffs & rare earth restrictions are reflected in earnings guidance as Mag7 reports Q3 results.
Dead cat bounce into Thanksgiving after the market pullback on guidance.
Then only a Trump tweet can give us a Santa Rally, otherwise the other shoe falls and we get a Black Friday/Monday after Thanksgiving.
Followed by a controlled selloff through Q4/Q1 earnings & poor guidance.
Chart forecasts finding a bottom in April 2026.
Please share your charts/forecasts into April 2026. (I am pretty new to this if you can't tell by my charts)

gameplan for $ES_F – 10/20**Trade Plan – 10/20: $ES_F #ES_F**
📊 **Setup Overview:**
• $ES_F held above key **support at 6540**, bouncing off the daily trendline and reclaiming short-term strength.
• The broader **ascending wedge** remains intact, with **6806** as major resistance and **6540** acting as the line in the sand for bulls.
• The market is consolidating between **6540–6800**, awaiting a breakout catalyst — likely earnings or macro data.
🐂 **Bullish Scenario:**
• Stay above **6540** and push through **6700 → 6750** for continuation.
• Break and hold above **6806** targets **new highs** into the **6850–6900** zone.
🐻 **Bearish Scenario:**
• Lose **6540** → watch for a quick drop toward **6240 → 6169**.
• Below **6169**, momentum breaks the long-term structure and opens **5822** as the next major demand zone.
⚖️ **Key Levels:**
• Resistance → 6700 / 6750 / 6806
• Support → 6540 / 6240 / 6169
🕓 **What I’m Watching:**
• Daily close above **6700** confirms bullish continuation.
• Breakdown under **6540** confirms the first leg of a potential trend reversal.
• Earnings and Fed speakers could drive volatility — stay nimble near resistance zones.
---
💬 If you found this helpful, drop a like and comment if you’re trading $ES_F.
Follow **@optibiz_trades** for more market setups, trade plans, and daily insights!

The Game of RiskWith the futures creeping up after the numbers it's looking more and more like a B wave is completing this morning, with a C wave down next for today and tomorrow. Holding support at 6500 (on futures) would likely get the 4 hour rsi in a divergent low posture. That divergent low could propel the SPX to new highs into next week.

S&P 500 E-mini Inside Day: Consolidation Before Next Big MoveToday’s price action formed a classic inside day on the 30-minute chart, signaling market indecision and a potential buildup before a significant breakout or breakdown. Watch key volume profile levels and Fibonacci retracements for clues on the next directional move. Market breadth remains mixed, so confirmation on a break of the inside day range will be crucial for trading decisions.

ES (SPX, SPY) Analysis Week-Ahead (Oct 20th - 24th)Market Structure Overview
Price has shown a robust rebound from last week's discount levels, now trading back near the 6,720 area following a swift flush and subsequent V-shaped recovery.
Currently, we remain capped under the supply zone between 6,765 and 6,795, which represents the previous swing-high levels. As long as we trade below this resistance, our primary strategy will be to sell into strength and buy on dips within the established range, rather than pursuing breakouts.
On the hourly chart, key equilibrium is noted around the 6,701 to 6,705 range; this serves as the pivotal point around which price action is currently oscillating.
Setups (Level-KZ style)
Reclaim-and-go long (Tier-1 / Tier-2):
Asia/London: hold above 6,701–6,705 after a shallow dip → in NY AM, take the first 5m re-close + 1m HL toward 6,725–6,735.
Scale/target: TP1 6,725–6,735, runners toward 6,765–6,780 if strength persists. Invalidation: 15m body back below 6,701.
Flush-and-reclaim long (Tier-3 bounce):
• Quick sweep into 6,655–6,665 (or even 6,685–6,690) during London → immediate reclaim → first HL entry.
• Targets: back to 6,701 then 6,725–6,735. Invalidation: 15m close back inside/under the swept zone.
Pop-and-fail short (fade):
• Squeeze into 6,725–6,735 that fails to accept (15m rejection back inside) → take the first 5m LH.
• Targets: 6,701 then 6,685–6,690. Invalidation: 15m body acceptance above 6,735.
Stop-run reversal short:
• Spike into 6,765–6,795 (look for wick/absorption) → 15m rejection → 5m LH entry.
• Targets: 6,735 then 6,701. Invalidation: sustained 15m/30m acceptance above 6,795.
Management:
Anchor hard SL to the relevant 15m wick of the trigger ± a small buffer; require TP1 ≥ 2R to the next major level.
At TP1, trim most and put the runner to BE; max 2 attempts per level per session.
Overnight to Tomorrow NY Forecast
Base Case: Anticipate a range build between 6,685 and 6,735 overnight as the market absorbs the recent rebound. During the NY AM session (09:30–11:00 ET), initial attempts may test the 6,725–6,735 resistance before pulling back towards 6,701, potentially moving within the 6,685–6,690 range. Should buyers maintain support at 6,701 on a 15-minute chart, watch for a late-morning rebound back to the 6,725–6,735 zone, with a potential squeeze toward 6,755–6,780 if we see acceptance above 6,735.
The bias shifts to a bullish trend only with clear acceptance above 6,795, which would indicate multiple strong closes in that area, potentially targeting 6,820 and beyond. On the other hand, a decisive move below 6,655 would trigger a downward extension toward 6,604, 6,564, and 6,520.
Execution windows (ET)
• London: 02:00–05:00 — look for the sweep/reclaim plays.
• NY AM (primary): 09:30–11:00 — best momentum/rotation.
• NY PM: 13:30–16:00 — continuation or mean-revert back into the day’s pivot.
What changes the plan
Acceptance above 6,735 early: favor continuation to 6,765–6,780 rather than fading.
Hard failure at 6,701 with sellers defending on 15m: expect a deeper test into 6,685 → 6,655–6,665.
Elevated macro headlines/data at 08:30/10:00 ET windows can temporarily override levels; let the impulse print, then trade the retest.
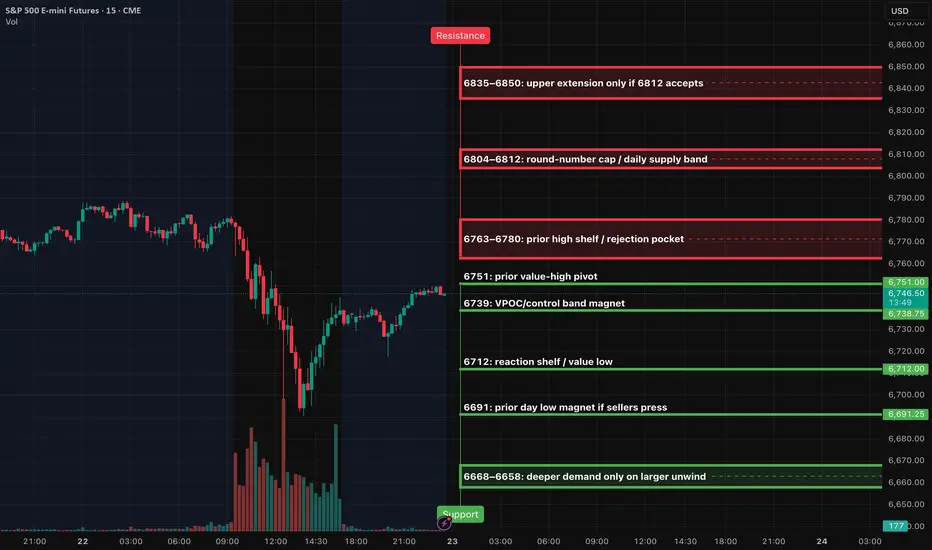
ES (SPX, SPY) Analysis, Key Levels, Setups for Thur (Oct 23)Bias: The market shows a neutral to slightly bullish outlook as long as prices remain above the 6739–6751 control band. A decisive break and sustained trading above 6780 would indicate a shift in momentum to the upside, targeting the levels of 6804 to 6812. Conversely, if we lose support at 6739, we could see a decline toward 6712, with 6691 serving as a key level that may attract selling pressure.
Execution windows: London 02:00–05:00 optional small size. NY AM 09:30–11:00 primary. NY PM 13:30–16:00 primary. Midday is manage-only; avoid initiating.
Setups
Short pop-and-fail at 6773–6780
– Trigger: 15m rejection back inside the band → 5m re-close below ~6773 → first 1m pullback stalls beneath 6773
– Entry: sell the pullback beneath 6773
– Stop: hard SL above the 15m rejection wick by 0.25–0.50
– Targets: TP1 6751, TP2 6739, TP3 6712
– Invalidation: 6780 converts to support on a full-body 15m close
Long breakout continuation above 6780
– Trigger: 15m full-body close beyond 6780 → 5m pullback holds 6777–6780 and re-closes up → 1m higher-low entry
– Entry: buy the hold at 6777–6780
– Stop: hard SL below the 15m trigger wick by 0.25–0.50
– Targets: TP1 6804, TP2 6812, TP3 6835–6850
Long sweep-and-reclaim at 6712 → 6691
– Trigger: quick sweep of 6712 (or flush toward 6691) that immediately reclaims 6712 on 5m → 1m higher-low entry
– Entry: buy first pullback after the reclaim of 6712
– Stop: hard SL below the 15m sweep wick by 0.25–0.50
– Targets: TP1 6739, TP2 6751, TP3 6773–6780
Buyers are shakyBuyers failed to follow through in the daily chart of the S&P 500. This implies buyers are shaky and settling that we've seen so far implies profit-taking. If your home alongside be cautious in this market.

ES - October 17th - Daily Trade PlanOctober 17th - 6:32am
*Before reading this trade plan, IF, you did not read yesterdays, or the Weekly Trade Plan take the time to read it first! (You can see both posts in the related publication section) *
If my posts provide quality information that has helped you with your trading journey. Feel free to boost it for others to find and learn, also!
My daily trade plan and real-time notes that I post are intended for myself to easily be able to go back and review my plan and how I did from an execution perspective.
----------------------------------------------------------------------------------------------------------------
Yesterday we had some really good levels to grab points for those traders that were patiently waiting for a pullback. 6717 was our first level and we had some great points at this level. You can review the daily trade plan and see the real-time notes of what trades I took.
Let's discuss today's plan!
When I woke up around 4am EST I was not too surprised to see we had sold off overnight. Mainly due to the fact we back tested the massive bear flag resistance, yesterday. I had mentioned yesterday that IF, we lose 6650, we would most likely head lower. I also wrote that price needed to clear 6703 for price to go higher.
Our overnight high is 6668 with our overnight low at 6571. Around 4:20am price held this 6571 level a couple of times, and I was actually able to grab points this morning with the failed breakdown of 6575. 6592 is a previous weekly low and as of writing this price is holding this level at the moment. 6592 will be a key level to hold or we will need to test 6559, 6549 or 6539. We currently have an inside weekly candle that IF, price holds 6540 today, would give us next week's candle close to help determine the direction in the short term as to where price may continue either above 6700 or below. (I will go into more detail on the weekly trade plan that comes out on Sunday).
Since I already got lucky this morning being up while price was building a nice base and reclaimed 6575 and made a very nice trade to end the week. I will not be trading anymore the rest of the day.
Today is OPEX and with this can come volatility. You have to be even more disciplined on days like today.
Key Levels for Today:
1. Any loss and reclaim of 6592
2. Reclaim of 6607 (Potentially wait for a back test of this level, it has been tested 2x this am, so probably will rally and may not provide much of a back test).
3. Loss of the overnight low of 6571 and reclaim for a move higher.
My general lean is that Institutions will sell off price in the first hour down to 6559, 6549 and potentially 6540. Any loss of these levels and reclaim of them to move higher is what you need to be looking for. I do believe, IF, price clears 6607 we will most likely test the 6632-level minimum. IF, price can make it 6642 that is a bonus. IF, we are in a longer-term downtrend, price should not reclaim 6700. Today is ripe for a short squeeze and I would be patient and wait for some good levels to grab points from. IF, price loses 6540, I would wait for a reclaim of that level. IF, price does lose the level and can't reclaim it quickly, I would get out the way and take the rest of the day off.
Key Support Levels - 6592, 6571, 6559, 6549, 6539, 6514, 6495
Key Resistance Levels - 6607, 6624, 6632, 6642, 6652, 6668, 6683, 6703
I will post an update around 10am EST.
----------------------------------------------------------------------------------------------------------------
Couple of things about how I color code my levels.
1. Purple shows the weekly Low
2. Red shows the current overnight session High/Low (time of post)
3. Blue shows the previous day's session Low (also other previous day's lows)
4. Yellow Levels are levels that show support and resistance levels of interest.
5. White shows the trendline from the August lows

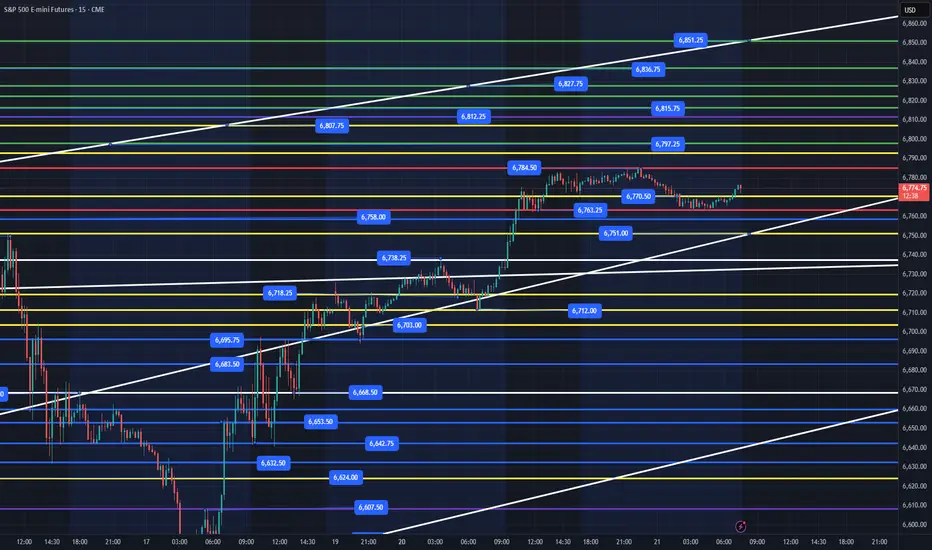
ES - October 22nd - Daily Trade PlanOctober 22nd - 6:45am
*Before reading this trade plan, IF, you did not read yesterdays, or the Weekly Trade Plan take the time to read it first! (You can see both posts in the related publication section) *
If my posts provide quality information that has helped you with your trading journey. Feel free to boost it for others to find and learn, also!
My daily trade plan and real-time notes that I post are intended for myself to easily be able to go back and review my plan and how I did from an execution perspective.
----------------------------------------------------------------------------------------------------------------
Our overnight high is 6789 and overnight low is 6763. Very tight range that should resolve higher today. Ideally, we can get a pull back to the 6750 area and reclaim 6758, 6763. Any price action below 6763 and a quick reclaim would be bullish. IF, price does clear 6789 we could get to 6797, 6807 as first targets and 6812 being a heavy resistance area. IF, price clears then fall back inside the overnight range, we could then lose the 6770, 6763 level and would not want to see price lose 6738 or we may need to retest 6703 area which has been tested a ton over the week and it is also the bull/bear line, I have been discussing since last week.
Key Levels Today:
1. Loss of 6770 and reclaim
2. Loss of 6763 and reclaim (Potentially down to 6758)
3. Loss of 6750 and reclaim
Price below 6738 and we will probably need to retest the 6703 level.
We have to remain bullish with price above 6695
Key Support Levels - 6770, 6763, 6750, 6738, 6712, 6703, 6695
Key Resistance Levels - 6789, 6797, 6807, 6812, 6815, 6827, 6836, 6851
I will post an update around 10am EST.
----------------------------------------------------------------------------------------------------------------
Couple of things about how I color code my levels.
1. Purple shows the weekly Low
2. Red shows the current overnight session High/Low (time of post)
3. Blue shows the previous day's session Low (also other previous day's lows)
4. Yellow Levels are levels that show support and resistance levels of interest.
5. White shows the trendline from the August lows

ES - October 20th - Daily Trade PlanOctober 20th - 6:32am
*Before reading this trade plan, IF, you did not read yesterdays, or the Weekly Trade Plan take the time to read it first! (You can see both posts in the related publication section) *
If my posts provide quality information that has helped you with your trading journey. Feel free to boost it for others to find and learn, also!
My daily trade plan and real-time notes that I post are intended for myself to easily be able to go back and review my plan and how I did from an execution perspective.
----------------------------------------------------------------------------------------------------------------
Our overnight high is 6738 and our overnight low is 6695. I mentioned on Friday that we needed to hold the 6703 level for us to continue higher. We have been chopping around above 6703 since Friday afternoon. You can clearly see that we tested 6695 on Friday afternoon 3x, before clearing that level, gapping up at the open on Sunday evening and then closing that gap and holding the 6695 resistance now turned into support! 6570 was our low overnight Thursday/Friday and I do not think we reach that level today. Let's look and find other areas that could be good areas to grab points today.
Key Levels for Today:
1. Loss of 6718 and reclaim
2. Loss of 6695 and reclaim
3. Loss of 6668 and reclaim
4. Loss of 6642 and reclaim
Price below 6642 and we will need to see a flush and reclaim of 6632 or we will need to wait patiently for the 6591 or 6570 levels.
Key Support Levels - 6718, 6703, 6695, 6683, 6668, 6653, 6642, 6632, 6624, 6607, 6591, 6570
Key Resistance Levels - 6738, 6749, 6767, 6779, 6797, 6815
We have to remain bullish with price above 6695. 6765 is a key resistance and that level needs to clear for us to really continue higher. We could easily chop around between 6750-6695 today and continue to work inside this range. We can't be bearish until we see price lose 6642, with 6624 being the very lowest or we will be going to retest Friday's lows.
I will post an update around 10am EST.
----------------------------------------------------------------------------------------------------------------
Couple of things about how I color code my levels.
1. Purple shows the weekly Low
2. Red shows the current overnight session High/Low (time of post)
3. Blue shows the previous day's session Low (also other previous day's lows)
4. Yellow Levels are levels that show support and resistance levels of interest.
5. White shows the trendline from the August lows

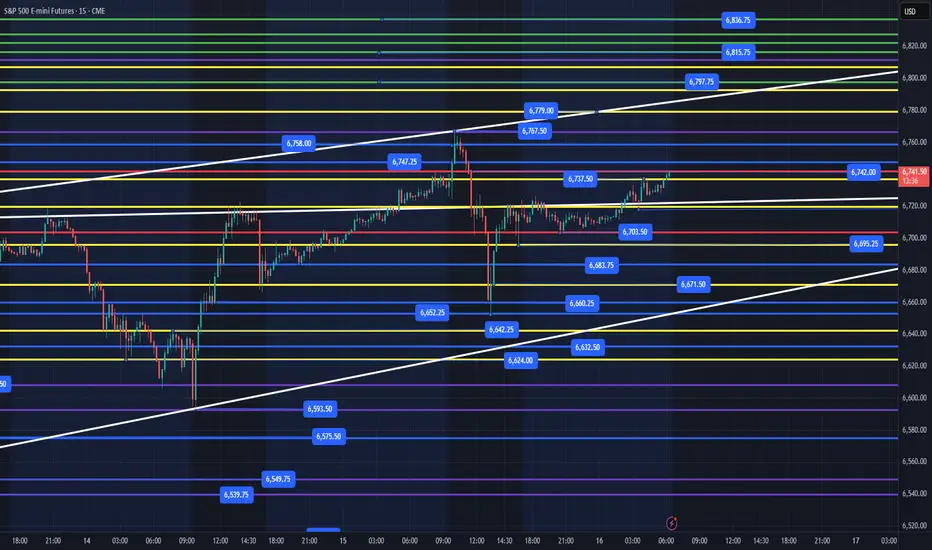
ES - October 23rd - Daily Trade PlanOctober 23rd - 7:05am
*Before reading this trade plan, IF, you did not read yesterdays, or the Weekly Trade Plan take the time to read it first! (You can see both posts in the related publication section) *
If my posts provide quality information that has helped you with your trading journey. Feel free to boost it for others to find and learn, also!
My daily trade plan and real-time notes that I post are intended for myself to easily be able to go back and review my plan and how I did from an execution perspective.
----------------------------------------------------------------------------------------------------------------
I have been stating all week that "IF we lose 6750 we could flush lower. I also stated that we have to remain bullish price above 6695." I stated on the 9am note - "Be cautious today and get out the way if price does sell off below 6750".
What happened? We sold off down to 6690, reclaimed 6695 and bounced late afternoon and overnight into 6750 area. Our overnight high is 6751 and overnight low is 6717. We have 2 main levels that need to hold from the overnight session - 6717 & 6733.
IF price can reclaim 6751 area, we should back test to the 6768-70 level. Above 6750 and bulls are back in control. My general lean is that we need to at least retest 6717 level and reclaim we should get a few quick points. IF price loses 6717, we most likely retest the 6695 level and 6674, 6653 are 2 main levels I would be looking for a flush and reclaim to grab points.
Key Levels Today:
1. Loss of 6733 and reclaim
2. Loss of 6717 and reclaim
3. Loss of 6703 and reclaim
4. Loss of 6690 and reclaim
IF, price loses 6690, I would wait for 6674, 6653 and see IF price can react at one of those levels for a bounce back up the levels.
Key Support Levels - 6733, 6726, 6717, 6703, 6690, 6683, 6675, 6668, 6653
Key Resistance Levels - 6742, 6750, 6758, 6763, 6770
I will post an update around 10am EST.
----------------------------------------------------------------------------------------------------------------
Couple of things about how I color code my levels.
1. Purple shows the weekly Low
2. Red shows the current overnight session High/Low (time of post)
3. Blue shows the previous day's session Low (also other previous day's lows)
4. Yellow Levels are levels that show support and resistance levels of interest.
5. White shows the trendline from the August lows

S&P 500 (ES1!): Wait For Valid Buy Setups!Welcome back to the Weekly Forex Forecast for the week of Oct. 20-24th.
In this video, we will analyze the following FX market: S&P 500 (ES1!)
The S&P500 is ranging. More neutral than bullish. But Friday's bullish close indicates potential bullish order flow going into this week.
If price can manage to trade above the Monthly Open at 6,725, than buys become valid.
I'm not interested in selling this market, unless I see a sure enough bearish BOS.
Enjoy!
May profits be upon you.
Leave any questions or comments in the comment section.
I appreciate any feedback from my viewers!
Like and/or subscribe if you want more accurate analysis.
Thank you so much!
Disclaimer:
I do not provide personal investment advice and I am not a qualified licensed investment advisor.
All information found here, including any ideas, opinions, views, predictions, forecasts, commentaries, suggestions, expressed or implied herein, are for informational, entertainment or educational purposes only and should not be construed as personal investment advice. While the information provided is believed to be accurate, it may include errors or inaccuracies.
I will not and cannot be held liable for any actions you take as a result of anything you read here.
Conduct your own due diligence, or consult a licensed financial advisor or broker before making any and all investment decisions. Any investments, trades, speculations, or decisions made on the basis of any information found on this channel, expressed or implied herein, are committed at your own risk, financial or otherwise.

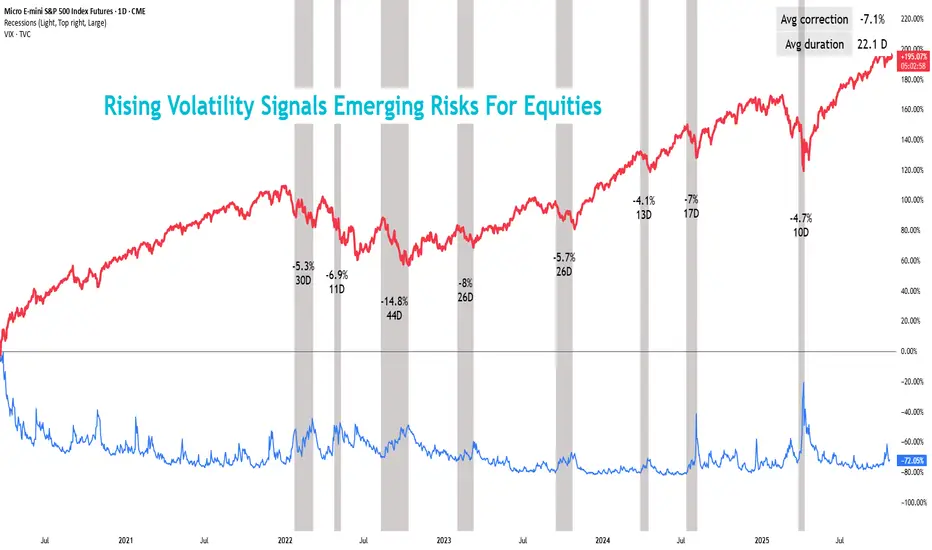
Rising Volatility Signals Emerging Risks For EquitiesFor all the headlines about inflation risk, interest rate uncertainty, and geopolitical instability, the S&P 500 hasn’t flinched much lately. Price ranges have narrowed, option premiums have deflated since April, and market volatility metrics remain stuck near cycle lows.
However, short-dated MES weekly options expiring 24/October — typically more responsive to shifts in implied volatility (IV) — showed an upward shift in the IV smile early in the month, pointing to renewed demand for downside protection.
Source: CME QuikVol
Historical volatility remains below implied levels, leaving scope for realised volatility to rise to implied levels. Current options positioning suggests that the next volatility move is likely to emerge from downside risk.
Source: CME QuikVol
The Cboe Volatility Index (VIX), reflecting 30-day expected volatility in the S&P 500, drifted toward 15 and stayed compressed for over a month. While this appeared stable, volatility is inherently mean-reverting — especially amid macro uncertainty, geopolitical risks, and year-end positioning.
Economic data have not justified a hawkish Fed stance, and markets expect another rate cut at the 29 October meeting. Additional uncertainty stems from the government shutdown, which delayed the September CPI release and left investors without timely inflation guidance. This has amplified market sensitivity to new data and headlines.
Meanwhile, Fed officials have turned more dovish, shifting attention from inflation to signs of labour market weakness.
Source: CME FedWatch
So far, the uncertainty has not prompted a broad flight to safety. Although the VIX has risen almost 60% this month, the S&P 500’s decline was just 1.2% as of 17 October. Markets appear hesitant to reprice risk aggressively without confirmation from data or the Fed — a shift that could accelerate near the 24/October CPI release.
When Volatility Snaps Back
Historically, volatility spikes have also driven sharp corrections in equity futures. Since 2022, the average duration of a VIX rise regime is about 22 days, with a 7% average correction in equity futures during that period.
This trend offers multiple opportunities for traders. With a week left for key macro data to come out and almost two weeks left for the next Fed meeting, a short-term position to gain from volatility expansion could be expressed by deploying a straddle using CME’s E-mini S&P 500 (ES) weekly options.
However, with VIX already elevated and reaching 28 late last week, further upside from long volatility trades appears limited. In contrast, a short equity futures position could still benefit from additional downside as uncertainty pressures equities.
As of this analysis, VIX had been rising for 7 days, implying that IV could stay elevated for roughly another 15 days based on historical regime durations. Notably, the larger portion of S&P futures’ correction typically occurs during the latter half of this rising volatility phase.
The average correction over the latter 15-days is almost 7x more than that observed in the first week of rising IV. And given the 1.3% decline so far in this cycle, there is still room for realised volatility to catch up via an additional 2.7% correction.
As on 17/Oct, MES options expiring on 31/Oct serves to capture the remaining 15-day window. Concentrated activity across key strikes in this contract indicates that options traders are pricing in a potential decline of roughly 3% to 7.7% in equity futures.
Source: CME QuikStrike
In an expanding volatility regime, short S&P 500 futures offer an alternative way to express views on rising volatility. Straddles suit uncertain bias but require larger moves to overcome time decay. With expectations of further downside and higher realised volatility, short futures may be better aligned.
Historical Example
The inverse correlation between VIX and equity index futures supports a directional bias tied to IV expectations. Historical VIX spikes show extended periods of elevated IV, typically aligning with a 7% average drawdown in equity futures.
A strategy that trades in line with the prevailing volatility trend can exploit this pattern. Assuming IV remains elevated, equity futures generally experience their steepest declines during the later part of rising VIX regime. Across the last eight major IV spikes, this relationship has held consistently.
The following historical analysis examines a strategy that moves with the prevailing volatility trend. The approach assumes that implied volatility (IV) will remain elevated for an extended period, during which equity futures tend to decline more sharply. As shown in prior instances, this pattern held true across the last eight major IV spikes.
A short MES futures position initiated seven days after a VIX spike has historically produced strong returns.
For example, during the July 2024 volatility surge (highlighted in green above), entering short at 5600 on 18 July (7 days after VIX started to rise) and exiting 15 days later at 5247 on 5 August would have yielded a profit of (5600 – 5247) × $5 = $1,765.
However, the strategy is not consistently profitable. During the September 2023 episode (highlighted in yellow above), a similar short position entered at 4368 on 21/September and exited 15 days later at the same level would have produced no gain, underscoring that historical tendencies serve as context, not certainty.
Alternatively, if volatility stabilises and uncertainty eases, short positions could also underperform as equities resume their ascent.
This content is sponsored.
MARKET DATA
CME Real-time Market Data helps identify trading set-ups and express market views better. If you have futures in your trading portfolio, you can check out on CME Group data plans available that suit your trading needs tradingview.com/cme .
DISCLAIMER
This case study is for educational purposes only and does not constitute investment recommendations or advice. Nor are they used to promote any specific products, or services.
Trading or investment ideas cited here are for illustration only, as an integral part of a case study to demonstrate the fundamental concepts in risk management or trading under the market scenarios being discussed. Please read the FULL DISCLAIMER the link to which is provided in our profile description.
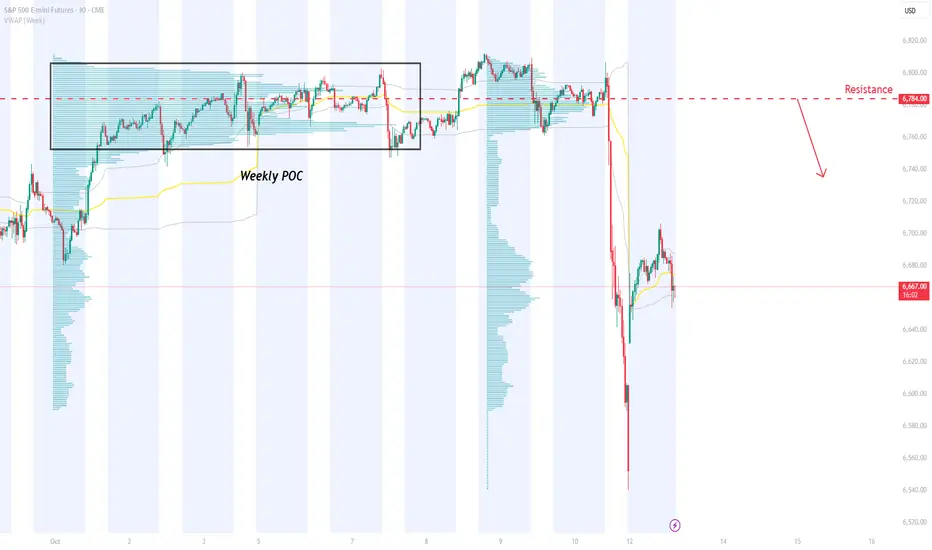
ES – Weekly POC Resistance at 6784 with Bearish Fair Value GapOn ES 30M chart, strong sellers accumulated around 6784 — the Weekly Point of Control and origin of Friday’s sharp sell-off. This heavy-volume zone marks where institutional selling began. The area also overlaps with a large bearish Fair Value Gap, reinforcing it as a key resistance. I’ll look for a pullback to this level for a short setup.
ES - October 21st - Daily Trade PlanOctober 21st - 7:30am
*Before reading this trade plan, IF, you did not read yesterdays, or the Weekly Trade Plan take the time to read it first! (You can see both posts in the related publication section) *
If my posts provide quality information that has helped you with your trading journey. Feel free to boost it for others to find and learn, also!
My daily trade plan and real-time notes that I post are intended for myself to easily be able to go back and review my plan and how I did from an execution perspective.
----------------------------------------------------------------------------------------------------------------
Our overnight high is 6784 and overnight low is 6763. Very tight range that should resolve higher today. Ideally, we can get a pull back to the 6750 area and reclaim 6758, 6763. Any price action below 6763 and a quick reclaim would be bullish. IF, price does clear 6784 we could get to 6791, 6800 as first targets and 6812 being a heavy resistance area. IF, price clears then fall back inside the overnight range, we could then lose the 6770, 6763 level and would not want to see price lose 6738 or we may need to retest 6703 area which has been tested a ton over the week and it is also the bull/bear line, I have been discussing since last week.
Key Levels Today:
1. Loss of 6770 and reclaim
2. Loss of 6763 and reclaim (Potentially down to 6758)
3. Loss of 6750 and reclaim
Price below 6738 and we will probably need to retest the 6703 level.
We have to remain bullish with price above 6695
Key Support Levels - 6770, 6763, 6750, 6738, 6712, 6703, 6695
Key Resistance Levels - 6784, 6797, 6807, 6812, 6815, 6827, 6836, 6851
I will post an update around 10am EST.
----------------------------------------------------------------------------------------------------------------
Couple of things about how I color code my levels.
1. Purple shows the weekly Low
2. Red shows the current overnight session High/Low (time of post)
3. Blue shows the previous day's session Low (also other previous day's lows)
4. Yellow Levels are levels that show support and resistance levels of interest.
5. White shows the trendline from the August lows
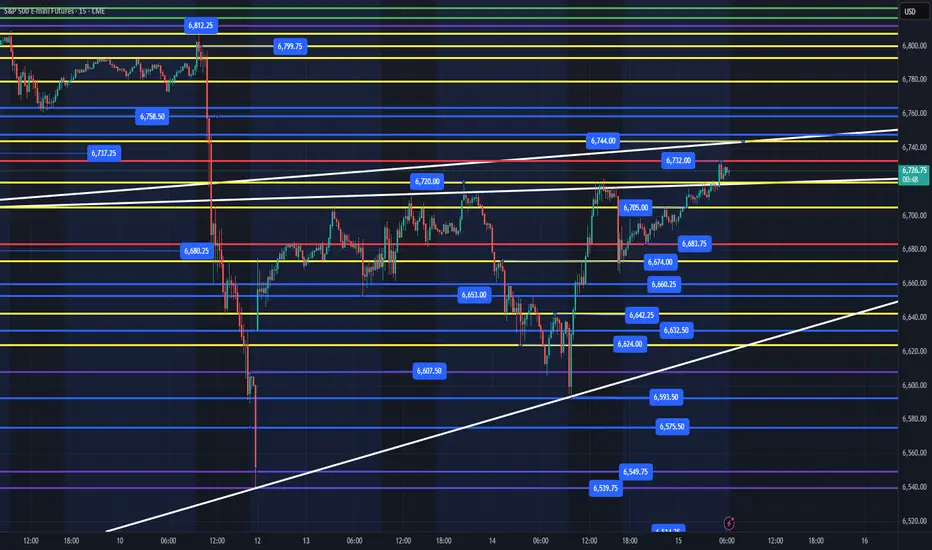
ES - October 15th - Daily Trade PlanOctober 15th - 6:25am
*Before reading this trade plan, IF, you did not read yesterdays, or the Weekly Trade Plan take the time to read it first! (You can see both posts in the related publication section) *
If my posts provide quality information that has helped you with your trading journey. Feel free to boost it for others to find and learn, also!
My daily trade plan and real-time notes that I post are intended for myself to easily be able to go back and review my plan and how I did from an execution perspective.
----------------------------------------------------------------------------------------------------------------
I am not going to go into much detail about yesterday as I have detailed out the trades that I took, which aligned with my edge. It was a great short squeeze yesterday and it all played out at the optimal timeframe while I was at my desk.
The overnight low is 6683 and our overnight high is 6732. I stated in the 4:52pm note yesterday that " Any reclaim of 6692-94 would be bullish overnight and give us another attempt at the 6720 level to take price higher." - This is what happened and we have grinded into some overhead resistance at 6732 with 6738-42 being a strong resistance.
Since price grinded slowly higher overnight, my lean is we need a pullback to keep things moving higher.
While I do not rely solely on technical bull/bear flags, the white trendlines that are drawn, could be a bearish structure that could reach 6742-44 area, then pullback to the 6642 area. The white trendline moving up, IF, price reaches it, should give us a nice bounce for points, then we would expect price to lose this level and move lower.
(IF, price does pull back and we take out the 6744-48 level and are successful, any back test should be good for price to move higher, this would also make the bear flag invalid)
Levels I am looking to grab some points at today:
1. Any loss and reclaim of 6705
2. Loss of 6683 and reclaim (maybe getting as low as 6666 and then reclaim 6674)
3. Loss of 6660 and reclaim
4. Loss of 6632 and reclaim (could be the bounce of the white trendline)
5. Loss of 6593 and reclaim (Yesterday's low)
Below those levels and we will most likely be in free fall to retest the 6540 level which could be the last area to give us a bounce.
IF, price loses any levels lower than 6540, you will want to be patient and let price build a base to take a long on the reclaim of a level above.
Key Support Levels - 6720, 6705, 6683, 6674, 6660, 6642, 6632, 6624, 6593, 6575, 6550, 6540
Key Resistance Levels - 6732, 6744-48, 6758, 6778
IF, price rallies above 6732 (Overnight High) and then comes back into the overnight range after the NYSE Open, and ES starts to sell off fast, DO NOT try and RUSH into grabbing points. Wait for it to build a base at one of the levels outlined above.
I will post an update around 10am EST.
----------------------------------------------------------------------------------------------------------------
Couple of things about how I color code my levels.
1. Purple shows the weekly Low
2. Red shows the current overnight session High/Low (time of post)
3. Blue shows the previous day's session Low (also other previous day's lows)
4. Yellow Levels are levels that show support and resistance levels of interest.
5. White shows the trendline from the August lows
ES - October 16th - Daily Trade PlanOctober 16th - 6:30am
*Before reading this trade plan, IF, you did not read yesterdays, or the Weekly Trade Plan take the time to read it first! (You can see both posts in the related publication section) *
If my posts provide quality information that has helped you with your trading journey. Feel free to boost it for others to find and learn, also!
My daily trade plan and real-time notes that I post are intended for myself to easily be able to go back and review my plan and how I did from an execution perspective.
----------------------------------------------------------------------------------------------------------------
Yesterday we had some really good levels to grab points for those traders that were patiently waiting for a pullback. I wrote multiple times yesterday that I was anticipating a pullback. I gave plenty of updates including the following:
10am - Update
"Price opened up and held the 6725 level in the first 30 mins. Price is coming into the 6750-52 resistance. IF, price loses 6725, we could flush pretty hard and I would get out the way. I am still patiently waiting on lower levels, but 6720 will no longer be an option for me, especially, now that we have held that level and rallied into resistance at the open. 1hr RSI is at 97 and we should still get a healthy pullback if this rally is to keep going higher. I would NOT BE CHASING at this level. I could be very wrong, but I would rather wait on a pull back to enter than trying to chase after the open."
We rallied into the high of the day at 6767 (which is now the weekly high) and by 10:15am we started to sell off.
In the daily trade plan, I stated the following levels I would be looking to grab points at:
Levels I am looking to grab some points at today:
1. Any loss and reclaim of 6705
2. Loss of 6683 and reclaim (maybe getting as low as 6666 and then reclaim 6674)
3. Loss of 6660 and reclaim
All 3 levels created opportunities to grab points and IF you were patient, prepared, and acted in real-time you could have grabbed some nice points, yesterday.
(* I would go back and look at all my real-time updates from yesterday. I especially discuss the reclaim of 6660, WHY I did not take that level reclaim, and why I decided to wait for the 6683 reclaim. This was also the overnight low)
--------------------------------------------------------------------------------------------------------------
Let's discuss today's plan!
As of writing my plan, we are coming into and making the overnight high at 6742 with our low at 6704. We have been grinding higher in this range all night. The trend is up and we should always defer to the trend. Ideally, we can get a pull back to 6695 and reclaim 6705. We could also pull back to 6717 and reclaim 6720. IF, price is to continue higher, we should not lose the 6650-52 level. Since this was yesterday's low, I do not anticipate us losing that level today and we may need to use levels within the current overnight range to take us higher. Above 6742 and we should re-test the 6767 level and potentially target the 6797 level.
Levels I am looking to grab some points at today:
1. Any loss and reclaim of 6717
2. Any loss and reclaim of 6705
3. Any loss and reclaim of 6695 (We could pull back to 6686, 6692 and then reclaim of 6695 would be bullish)
Key Support Levels - 6737, 6717, 6705, 6695, 6683, 6671, 6660, 6652
Key Resistance Levels - 6742, 6747, 6758, 6767, 6779, 6797
I will post an update around 10am EST.
----------------------------------------------------------------------------------------------------------------
Couple of things about how I color code my levels.
1. Purple shows the weekly Low
2. Red shows the current overnight session High/Low (time of post)
3. Blue shows the previous day's session Low (also other previous day's lows)
4. Yellow Levels are levels that show support and resistance levels of interest.
5. White shows the trendline from the August lows
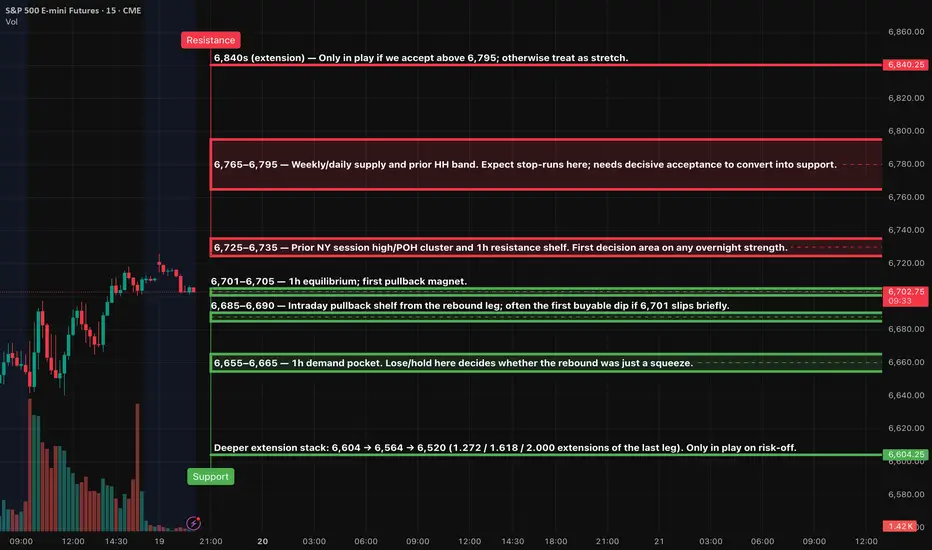
ES (SPX, SPY) Analysis, Key Levels, Setups Tue (Oct 21)Market Update for Traders:
Context:
Currently, the price is approaching a key supply zone between 6,765 and 6,795. While we have seen a series of higher highs on the 1-hour chart, the momentum appears to be flattening. Below this supply level, we have identified some significant areas to monitor. The first clean value area on the 1-hour chart is around 6,701 to 6,705, with a visible pullback shelf located between 6,685 and 6,690. There's also a stronger demand zone in the 6,655 to 6,665 range. If we manage to break above the supply cap at 6,795, the next measured extension target is around 6,840, but this should be treated as a stretch unless we see solid acceptance above 6,795.
Key Zones to Watch:
Resistance:
- 6,765–6,795 (this is the current cap)
- Extension potential at 6,840, provided we see firm acceptance above 6,795.
Support:
- Look for the first decision point around 6,725–6,735, which reflects overnight strength.
- 6,701–6,705 is a key equilibrium area.
- The shelf for the first buyable dip lies at 6,685–6,690.
- Further support is found in the demand pocket at 6,655–6,665.
- If we encounter a deeper risk-off scenario, watch for extensions down to 6,604, 6,564, and 6,520, but only if we see a decisive failure in the rebound.
Setups:
Setup 1 — Rejection Short at 6,765–6,795 (A++)
Entry: 6,788–6,793 after a 5m re-close back below 6,795 and a 1m lower-high
Stop (SL): 6,804.50 (above rejection wick/upper edge)
TP1: 6,729–6,733
TP2: 6,701–6,705
TP3: 6,686–6,690
Setup 2 — Acceptance Long above 6,795 (A++)
Entry: 6,796–6,799 on first pullback that holds after decisive 15m acceptance over 6,795
Stop (SL): 6,785.00 (back inside the band)
TP1: 6,822–6,828
TP2: 6,840 stretch
TP3: 6,852–6,855 if squeeze persists
Setup 3 — Quick-Reclaim Long at 6,701 (A+ Bounce)
Entry: 6,702–6,705 only if 6,701 briefly slips and then a 5m candle re-closes back above it
Stop (SL): 6,694.50
TP1: 6,729–6,733
TP2: 6,765–6,775
TP3: 6,788–6,793
Setup 4 — Shelf Long at 6,685–6,690 (A Bounce)
Entry: 6,686–6,689 with a 1m higher-low and 5m hold
Stop (SL): 6,678.00
TP1: 6,701–6,705
TP2: 6,729–6,733
TP3: 6,765–6,775
Setup 5 — Demand-Pocket Long at 6,655–6,665 (A Bounce)
Entry: 6,657–6,663 on stabilization and 1m higher-low
Stop (SL): 6,647.00
TP1: 6,686–6,690
TP2: 6,701–6,705
TP3: 6,729–6,733
Setup 6 — Breakdown Short if 6,701 Turns to Resistance (A+)
Entry: 6,698–6,701 after a 5m close below 6,701 and a retest that fails
Stop (SL): 6,707.50
TP1: 6,686–6,690
TP2: 6,665–6,660
TP3: 6,604–6,564 only if momentum stays risk-off
Management (apply to all)
take the setup only if TP1 ≥ 2.0R using the stated SL. At TP1 close 70% and set the 30% runner to break-even; runner attempts TP2→TP3 if structure supports it. Time-stop 45–60 minutes if neither TP1 nor SL is hit. Primary execution windows: NY AM 09:30–11:00 ET and NY PM 13:30–16:00 ET.

NQ & ES Premarket Comment Friday 17-10-2025Good morning everyone.
Today, we’re operating within a balanced range — an equilibrium state. The daily bias remains neutral.
The potential scenarios for today are as follows:
1. Bullish scenario: Price could extend above yesterday’s high (PDH), as illustrated in the left-hand NQ chart.
2. Bearish scenario: Price could move lower, targeting last Friday’s low — this setup is shown in the right-hand ES chart.
The market structure will become clearer after the cash session opens at 09:30. By observing price action at the open, we’ll gain insight into the market’s true intent.
If the landscape remains unclear and your model does not align with price behavior, stay on the sidelines.
It’s Friday — the final trading day of the week — and price may exhibit unpredictable behavior or reactive moves. The key intraday levels are marked on the charts.
Stay disciplined, focused, and loyal to your model. Don’t let short-term volatility or choppy sessions affect your mindset. Relax, observe the price action, and let the market teach you.
See you later for the final market update of the week.
PF

S&P 500 E-mini: Approaching Key Resistance Zone with Bullish MomThe S&P 500 E-mini is showing signs of recovery with price approaching a significant resistance zone near 6,800. The 4-hour MACD indicates growing bullish momentum, while the 30-minute chart suggests a potential push toward the resistance area. Traders should watch for a breakout above this level to confirm continuation or a rejection that could signal a pullback.

Day 53 — Trading Only S&P Futures | +$59 & Market Still WeirdRecap & Trades
Day 53 — started the day catching clean plays off the X7 and DPBuy signals. Made some solid early gains, but later got stopped out after unexpected news from Trump hit the market.
Overall, I finished +$59 — small day, but still green. I’ve noticed the market feels a lot more unpredictable since that big Friday crash — tons of chop and odd gamma behavior.
Lesson & Mindset
The takeaway: stay adaptive and don’t overtrade uncertainty. This isn’t the time to push size — it’s time to stay patient and observe until the structure normalizes.
News & Levels
Big story today — Gold saw its largest single-day drop in 12 years, down over 5%. That’s massive.
Tomorrow’s levels: Above 6760 bullish, below 6715 bearish.

Day 51 — Trading Only S&P Futures | +$177 Testing a New StrategyRecap & Trades
Day 51 — I started late today since I had stuff to take care of in the morning. By noon, I decided to test a new “buy-the-dip” setup.
The idea: if the market drops over 100 points from its highs without panic, I’ll start building long positions with a wide 100-point stop and multiple profit targets.
Today was my first run testing it, and it worked pretty well — small win, but a big step in strategy development.
Lesson & Mindset
The key lesson: once you’ve built consistency, the next step isn’t more aggression — it’s refinement.
Testing new setups helps expand your edge while maintaining control.
News & Levels
Headline: Trump declared “We’re in a trade war with China now” — a reminder that volatility can return anytime.
Tomorrow’s levels: Above 6700 bullish, below 6655 bearish.
