Asia is setting the toneThe Asia session in the daily chart of the S&P 500 is setting the tone for the rest of the trading session. After a moment, buyers are showing up in the Asia session. The critical part will now be the ability of Europe to maintain this upward momentum.
ESH2027 trade ideas

ES (A++) — Plan, Key Levels & Fundamentals for Tue, Aug 26Market context (quick read)
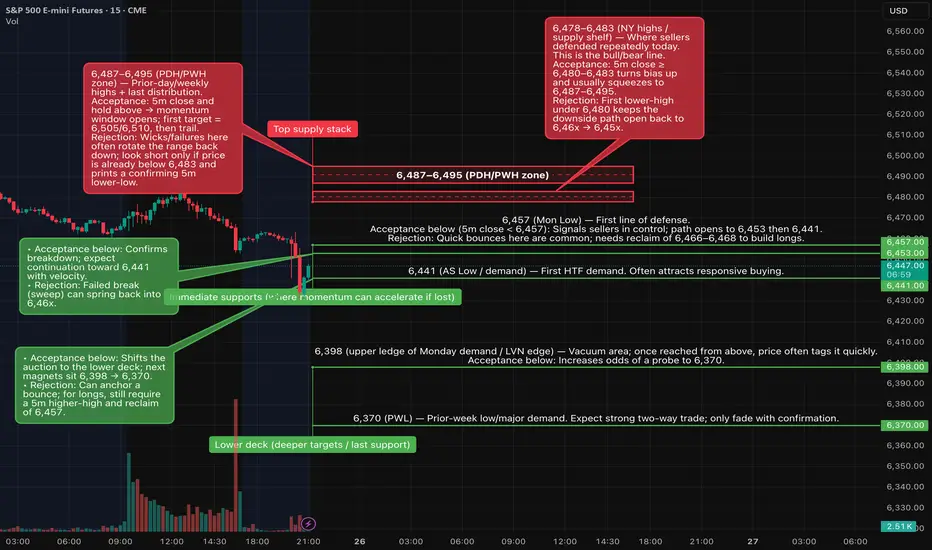
Price closed beneath the mid-range pivot (6,466–6,468) after repeated rejections from the 6,478–6,483 supply shelf. Immediate downside magnets are 6,457 → 6,453 → 6,441; deeper LVN/demand sits 6,398 → 6,370. Overhead, a squeeze can develop if we accept back above 6,48x toward 6,495 and the 6,50x handle.
Key levels (how to use them)
• 6,487–6,495 (PDH/PWH) – Last distribution. Acceptance above can extend to 6,505/6,510; rejection often rotates back to 6,48x.
• 6,478–6,483 (Supply shelf / bull-bear line) – Reclaiming/holding this band flips bias up; failure keeps pressure lower.
• 6,466–6,468 (Pivot shelf) – Doorway between upper/lower halves of the day’s composite.
• 6,457 (Monday’s low) – First support; loss opens 6,453 quickly.
• 6,453 (NYPM Low) – Breakdown confirmation level; below it, sellers typically press 6,441.
• 6,441 (AS Low / demand) – First HTF demand; acceptance below shifts auction to the lower deck.
• 6,398 → 6,370 (LVN / PWL) – Deeper targets if momentum expands.
Primary A++ setups (rule-based)
1. Acceptance Short (A++)
• Trigger: First 5m close < 6,452.
• Entry: 6,452 → 6,449 continuation.
• Initial SL: 6,460 (≤8 pts).
• TP1: 6,437 (+15) • TP2: 6,425 (+27) • TP3: 6,398 (+54).
• Management: If no extension within 2×5m bars, reduce/scratch; hard invalidate on 5m close > 6,457.
2. Acceptance Long (A++)
• Trigger: First 5m close ≥ 6,480–6,483.
• Entry: 6,480–6,483.
• Initial SL: 6,474 (6–9 pts; keep ≤8 if entering near 6,482).
• TP1: 6,495 (+12–15) • TP2: 6,505/6,510.
• Management: Invalidate on 5m close < 6,478 or no progress within 2×5m bars.
Fundamental “Risk Clock” — Tue, Aug 26 (ET)
• 08:30 — Advance Durable Goods Orders (July), U.S. Census Bureau. Official schedule lists Aug 26 at 8:30 a.m. ET. 
• 09:00 — S&P CoreLogic Case-Shiller Home Price Index (June). SPDJI notes release 9:00 a.m. ET on the last Tuesday; FRED lists the next release date Aug 26, 2025.  
• 09:00 — FHFA House Price Index (June + Q2 report). FHFA calendar confirms Aug 26 (Quarterly with monthly tables). 
• 10:00 — Conference Board Consumer Confidence (Aug), next release Tue, Aug 26, 10:00 a.m. ET. 
• 10:00 — Richmond Fed Manufacturing Index (Aug). Richmond Fed schedule shows Tue, Aug 26 (10:00 a.m. typical). 
• 13:00 — U.S. Treasury 2-Year Note Auction. Official offering announcement sets auction date Aug 26, 2025; competitive close is typically 1:00 p.m. ET (non-comp 12:00 p.m. ET). 
• Bills (same day) — Treasury “Upcoming Auctions” lists 17-Week and 4-Week bills for Aug 26. 
This week’s broader context: Markets are watching NVIDIA and other tech/retail earnings plus Friday’s PCE inflation read; these can shift risk appetite around our levels. 
⸻
Playbook integration (how the data can affect execution)
• Stronger durables / firmer confidence: If yields back up into the 2-year auction, equity indices often lean heavy—watch for rejection under 6,466–6,468 and a 5m break < 6,452 to trigger the short plan. (Scenario guidance, not a guarantee.)
• Softer durables / cooler housing prints: If risk appetite improves and we accept ≥ 6,480–6,483, use the long plan toward 6,495 → 6,505/6,510.
• Auction hour (12:50–13:10 ET): Expect a brief liquidity air-pocket; avoid fresh entries into the print and reassess after the first post-auction rotation. (Auction timing per Treasury norms above.) 
Day 16 — Trading Only S&P Futures | Rocky Start, Strong FinishWelcome to Day 16 of Trading Only S&P Futures!
Started the session following bullish structure while the market whipped up and down, which made it tricky to hold conviction early. Toward the end of the day, a short at 6482 finally gave clean follow-through, helping me turn a rocky start into a solid +296.25 finish.
The price action was choppy at times but still provided opportunities if you stayed patient.
🔑 Key Levels for Tomorrow
Above 6415 = Remain Bullish
Below 6405 = Flip Bearish

ES - August 26th - Daily Trade Plan - Evening Session OpenAugust 25th - 4pm EST Session Close
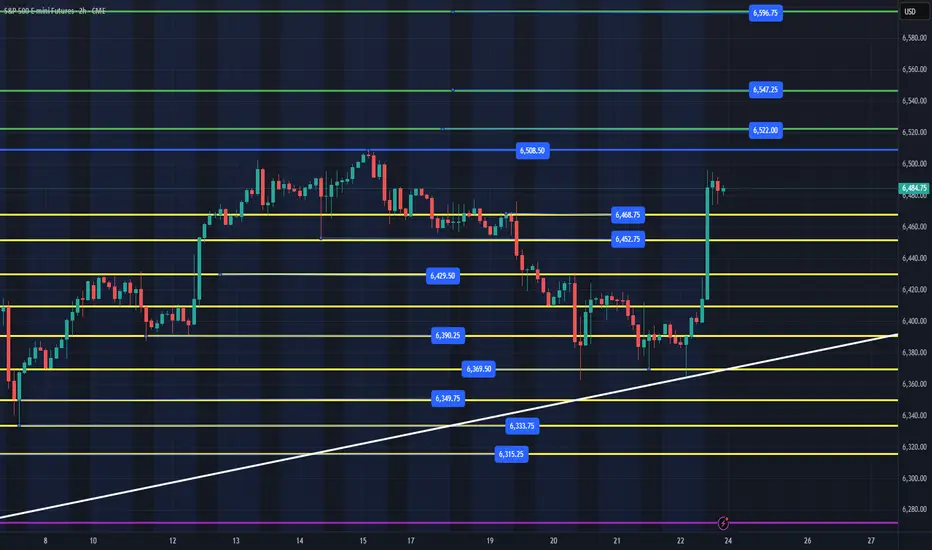
I wrote on my post Sunday night... "Monday, I expect price to chop around between 6474 - 6496 with 6454 being the lowest we would want to see price reach before we keep moving up the levels in yellow. First target is 6508 then 6522, 6547 as my first 2 targets and bulls can still reach 6562, 6581, 6595 if they really want it!"
We got the chop today and our entire session traded between 6461-6487 with us selling off a little below at the close.
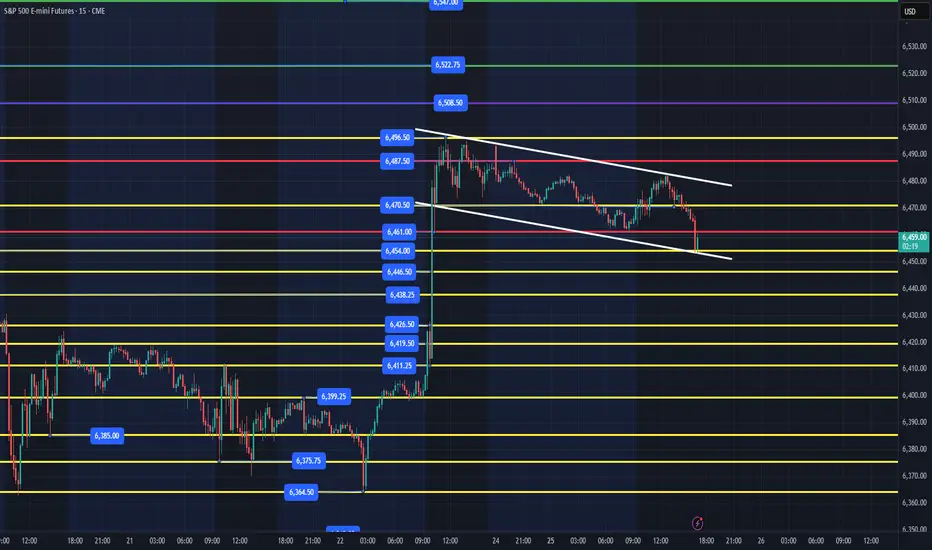
I think we hold the 6450-54 range, and this bull flag should build out and break out tomorrow. IF, price sells off overnight, then I would look for a yellow support line to flush and reclaim to enter. Ideally, we reclaim 6461 and then start to work our way up the levels. The chart has not changed much from yesterday. I did put in a potential bull flag in white & yesterday's session levels in red.
IF, price can reclaim and clear 6470, our first target is 6482, 6487, 6508 then 6522, 6547 as my main targets and bulls can still reach 6562, 6581, 6595 if they really want it!
I will update my trade plan this evening or tomorrow around 6am EST.
08/25 idea for S&P500My idea is all around 0prints around 6.437~32, because price has to rebalance that gaps eventually.
So if price show weakness on upper side about without taking new buyers on lower side i'll think about a sell on new agression formed last day around the last agression sell. Of course watching for confirmed sellers.
If price breaks im not interested in trading around 6459~38, theres a low volume node above the zero prints.
For me it has to rebalance 0ps at 37~32 or even better: take news buyers on a possibke mitigation sell zone around 6425~32.

ID: 2025 - 0168.18.2025
Trade #16 of 2025 executed.
Trade entry at 151 DTE (days to expiration).
Excellent fills this morning, well under mid, and I suspect we could see SPX drop in the coming days. Typically when my fills are better than mid, these trades take some heat at the beginning. ZERO risk to the upside, no imminent danger until 6000 gets disrespected.
Working GTC orders for target profit of 5% ROI.
Happy Trading!
-kevin

Nq & Es Premarket comment 25-08-2025Good morning everyone,
We are currently trading within a premium zone, and for that reason I believe price should first move lower into a discount area before continuing higher, given the broader uptrend.
Specifically for Nasdaq (NQ), I would like to see price reach the purple line, which represents the equilibrium level, before looking for long setups. Until then, I am not searching for long trades.
As for the S&P (ES), the situation is similar, but since it is showing stronger bullish structure, I do not expect it to reach its equilibrium level as easily.
Wishing you all disciplined and successful trading.
⚠️ Disclaimer: This analysis reflects personal market observations and is for educational purposes only. It does not constitute financial advice.

ES Weekly Outlook (Aug 25–29) - Setup and Analyses for 08/25TL;DR: Biggest volatility magnets land mid-to-late week (NVDA Wed PM, GDP/Claims Thu, PCE Fri). For Monday, first decision is the 6492–6496 overhead band. Acceptance above = continuation; rejection = range rotation lower.
⸻
Key Levels (current structure)
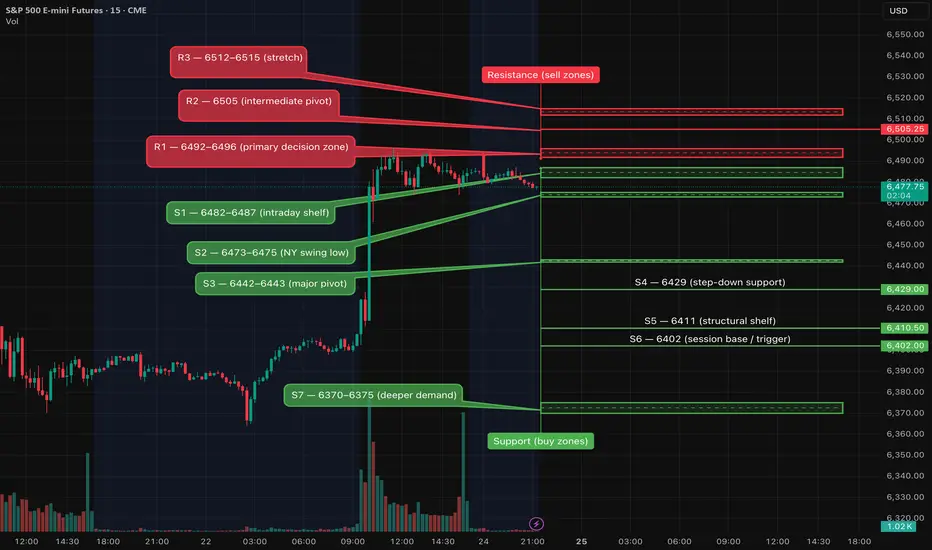
Resistance (sell zones)
• R3: 6512–6515 (stretch)
• R2: 6505
• R1: 6492–6496 ← primary decision zone
Support (buy zones)
• S1: 6482–6487 ← intraday shelf
• S2: 6473–6475 ← prior NY swing low
• S3: 6442–6443
• S4: 6429
• S5: 6411
• S6: 6402
• S7: 6370–6375 ← deeper demand
⸻
Monday 8/25 – Scenario Map
Bullish Continuation
• Trigger: 5-minute close & hold above 6492–6496 (no quick reclaim).
• Path: 6505 → 6512/6515; allow for momentum extension if Tuesday’s data are benign.
• Invalidate: Fast reclaim below 6487 after breakout.
Range → Fade
• Trigger: Clear rejection at 6492–6496 (seller response + lower high on 5-minute).
• Path: 6482–6484 → 6473–6475; loss of 6473 opens 6443 → 6429.
• Invalidate: Reclaim/hold > 6490 on a 5-minute close.
Timing note (Mon): Morning housing print around 10:00 ET can nudge yields/ES; treat the first spike cautiously.
⸻
Week at a Glance (ET)
Mon 8/25
• 10:00 – New Home Sales (Jul)
Tue 8/26
• 8:30 – Durable Goods (Jul, advance)
• 9:00 – S&P CoreLogic Case-Shiller Home Prices (Jun)
• 10:00 – Conference Board Consumer Confidence (Aug)
Wed 8/27
• 1:00 – U.S. 5-Year Note Auction
• 5:00 pm – NVIDIA (NVDA) earnings (key AI/mega-cap impulse)
Thu 8/28
• 8:30 – GDP (Q2, 2nd est.)
• 8:30 – Initial Jobless Claims
• 10:00 – Pending Home Sales (Jul)
• 1:00 – U.S. 7-Year Note Auction
Fri 8/29
• 8:30 – PCE & Core PCE (Jul)
• 9:45 – Chicago PMI (Aug)
• 10:00 – Univ. of Michigan Sentiment (Final, Aug)
⸻
Playbook & Risk (how I’ll trade it)
• Wait for the first confirming 5-minute close at the trigger; no entries on wicks.
• Shorts: 5-minute confirmation is enough unless flipping a firmly bullish 15-minute trend (then require the 15-minute validation to size up).
• Management: Time-stop 15–20 min without progress; max 2 attempts per idea.
• Windows: Prefer NY AM (9:45–11:30 ET) and PM (13:30–15:30 ET). Avoid fresh risk ±3–5 min around scheduled releases.
• Into big events: Stay lighter into NVDA (Wed PM) and PCE (Fri AM); let the print set the tone.
⸻
What I’m Watching
• Rates path after Powell → if inflation cools, dips likely get bought; a hot PCE flips that.
• Auction tones (Wed/Thu 1:00) → quick yield swings can drive intraday ES rotations.
• Breadth & leaders → if AI/mega-cap strength broadens, upside extends; if leadership narrows into NVDA, expect chop.
S&P 500: Bullish! Buy It!In this video, we will analyze the following FX market for the week of Aug 25 - 29th:
S&P 500 (ES1!)
The S&P 500 ended the week with strong bullish momentum, closing above the previous 3 days. The structure is bullish on the HTFs, and there is not good reason to look for sells.
Buy the bullish price action.
No sells until there is a definitive bearish break of market structure!
Enjoy!
May profits be upon you.
Leave any questions or comments in the comment section.
I appreciate any feedback from my viewers!
Like and/or subscribe if you want more accurate analysis.
Thank you so much!
Disclaimer:
I do not provide personal investment advice and I am not a qualified licensed investment advisor.
All information found here, including any ideas, opinions, views, predictions, forecasts, commentaries, suggestions, expressed or implied herein, are for informational, entertainment or educational purposes only and should not be construed as personal investment advice. While the information provided is believed to be accurate, it may include errors or inaccuracies.
I will not and cannot be held liable for any actions you take as a result of anything you read here.
Conduct your own due diligence, or consult a licensed financial advisor or broker before making any and all investment decisions. Any investments, trades, speculations, or decisions made on the basis of any information found on this channel, expressed or implied herein, are committed at your own risk, financial or otherwise.

MES1! WEEK 35 AUG 24TH LOOKING FOR MON, TUE, WED TO TRADE LOWER INTO THE DEAL RANGE TO RUN FURTHER UP.
CALANDER EVENTS
MON - 10AM - NEW HOME SALES (med)
TUE - 8:30AM - DURABLE GOODS (med)
- 10AM - CONSUMER CONFIDENCE (med)
WED----
THUR - 8:30AM - UNEMPLOYMENT (high)
- 10AM - HOME SALES (med)
FRI - 8:30AM - CORE PCE(high)
- 10AM - CONSUMER SENTIMENT(med)
STOCK
Look to be onside by Friday with options for next week's 1Q

Trading on NASDAQ Futures 3 min chart & using S&P 500 1 min I have been trading futures for 2 years now and I have recently notice that using the 3 min chart on Tradovate to execute trades and using on TRADINGVIEW on the 1 min chart on the S&P 500 chart has increase my winning trades. I use the momentum from the S&P 500 to enter the trade when I see a good Bull Or Bear flag setup. I never enter a trade the first 30 seconds of the new candle I always wait the second 30 seconds of the candle to enter. Must be patient for a good set up do not over trade, start small until you get better. I started trading with 1 micro now I trade with 5 mini at a time min, I use Apex 150k accounts but I recommend starting with the 50K accounts. I took Patrick Wieland course for a cheap $200 dollars it was worth every penny. This course is a good starting point but you must still make it your own and the only way is to put in the screen trading time. The course will not show you everything like identifying traps in real time. Do not get trapped or you will get blown up. I use 1:1 as 7.5 points stop lost and 7.5 winning target on 5 mini. That is a $750 winner or $750 loser. i like taking no more than 10 trades a day if i hit my profit goal of $1,500 i will walk away and close the computer.

ES - August 25th - Daily Trade Plan Last week we flushed a key level at 6452 and institutions started to buy at the 6364-70 level to build their positions in preparation to take the market higher on Friday at 10am during the Jackson Hole meeting.
I wrote on Friday at 4:30am EST - "I missed the overnight flush of yesterday afternoon 6370 low (2:30am) and now price is coming into the overnight session resistance of 6399.25. I need to identify either a move to retest 6412, back test 6399 and then buy on the support for a move to test 6420. Ideally, we could sell off back to the 6364 level or even better 6350, scare retail investors and then wait for a reclaim of 6364 to get back in and ride up."
What did price do when it reclaimed the 6399 level? It built a nice bull flag between 6399-6407 from 4:30am-9:30am and instead of flushing one more time, institutions bought heavily at 10am and we rallied up the levels and then started to build a structure for the next move.
What is next? 9/10 when price rallies the way it did on Friday, we need a day or so to chop sideways and build a base for the next leg. On Friday afternoon price started build a nice bullish structure. Until proven otherwise, we should reach our targets above by end of the week. It typically does not go in a straight line!
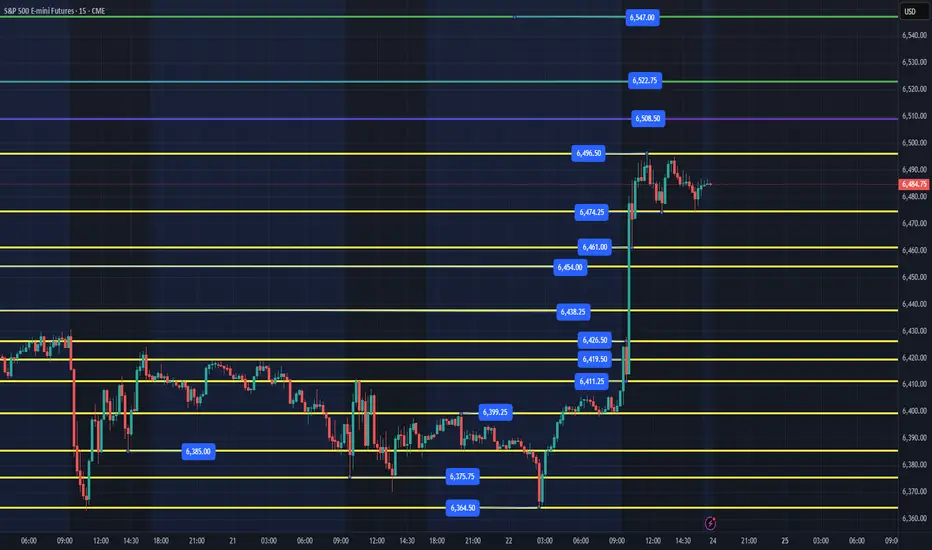
Monday, I expect price to chop around between 6474 - 6496 with 6454 being the lowest we would want to see price reach before we keep moving up the levels in yellow. First target is 6508 then 6522, 6547 as my first 2 targets and bulls can still reach 6562, 6581, 6595 if they really want it!
Pretty straight forward, look for price to flush 6474, reclaim and rally up to 6496, 6508+. Depending on how price acts at the session open, will depend on what are good spots to enter. First place is a flush and recovery of a level below price in yellow or we clear 6496, back test and then clear 6508. I will send out an update note this evening and around 6am EST once the European open has settled out.
ES - Weekly Trading Plan - August 25th - 29thIn last week's plan I wrote the following " Plan for next week is that we need to hold 6390, 6369. for us to continue higher. Ideally, we do not lose 6452 with 6426 being the breakout and 6390 the low of the week." We spent the first 2 days range bound and lost 6452 on Tuesday around 10am and flushed down and institutions started to buy at the 6369 level on Wednesday-Friday in anticipation of the 10am Jackson Hole meeting.
I wrote on Friday at 4:30am EST - "I missed the overnight flush of yesterday afternoon 6370 low (2:30am) and now price is coming into the overnight session resistance of 6399.25. I need to identify either a move to retest 6412, back test 6399 and then buy on the support for a move to test 6420. Ideally, we could sell off back to the 6364 level or even better 6350, scare retail investors and then wait for a reclaim of 6364 to get back in and ride up."
What did price do when it reclaimed the 6399 level? It built a nice bull flag between 6399-6407 from 4:30am-9:30am and instead of flushing one more time, institutions bought heavily at 10am and we rallied up the levels and then started to build a structure for the next move.
What is the plan for this week? When you look at the 2hr, 4hr, 8hr chart and zoom out, you can see that the trend is up and that we will probably need to digest Friday's rally and most likely chop around ideally above 6468, 6452 levels with 6429 being the lowest level we would want to test. Then we can retest the 6508 level and continue higher this week with 6522, 6547 my main targets with 6596 if bulls really want it.
IF, we lose 6369, my lean is that we will continue lower and a new market trend could be starting to unfold with 6245 the big area for us to hold to stay bullish in the bigger picture.
I will be posting my Daily Trade Plan for Monday before the session open.
How Beginners Should Start Trading Futures (Step by Step)### Why Trade Futures?
### 1. **One Market to Master**
- With stocks, you’ve got **thousands of tickers** to scan every day.
- With options, you add complexity: strike prices, expirations, Greeks.
- With futures, you can focus on **just one instrument**—like the S&P 500 (ES/MES)—and trade it daily.
👉 This eliminates overwhelm and accelerates mastery.
---
### 2. **Golden Age of Prop Firm Funding**
- Right now, prop firms are everywhere, offering retail traders a chance to trade with firm capital.
- For **$200–$500 evaluation cost**, you can get access to **$25K–$250K funded accounts**.
- That means a **$2,000–$2,500 effective credit line** to trade without risking your own savings.
- If you’re consistent, you can withdraw profits—keeping up to 90% depending on the firm.
👉 This makes the risk-to-reward of getting funded in futures unmatched compared to stocks or options.
---
### 3. **Simplified Leverage (Without Options Greeks)**
- Futures give you leverage, but without the **Delta, Gamma, Theta, Vega headache**.
- Every point in MES = $5. Every point in ES = $50. That’s it. Clear, transparent, easy to calculate.
- You know your risk and reward instantly—no need to fight with implied volatility or time decay.
---
### 4. **No PDT Rule, No Time Decay**
- Stocks: if you have less than $25K, you’re handcuffed by PDT rules.
- Options: even if you’re right, you can still lose because of **theta decay**.
- Futures: no PDT rule, no theta burn. You can take as many trades as you want, and your position value won’t decay over time.
---
### 5. **Low Capital to Start**
- Stocks often require large amounts of cash to move the needle.
- Options can be cheaper per contract, but carry hidden risks.
- Futures let you start with as little as **$2K** and realistically scale to $10K+ in months with discipline.
👉 Combine that with prop funding, and you’re essentially trading institution-sized accounts with minimal upfront cost.
---
### 🔑 The Big Picture
Trading futures gives you:
- **Focus** (one ticker, one system).
- **Leverage** without complexity.
- **Funding opportunities** that minimize personal risk.
- **Flexibility** (24/5 market access, no PDT, no decay).
That’s why many traders see this moment as the **“golden age” of retail futures trading**—you can start small, get funded quickly, and scale without needing Wall Street connections or a huge account.
---
### Step 1: Pick the Right Instrument
Start small and scale up:
- **/MES (Micro E-Mini S&P 500):**
- Best for beginners.
- Each point = $5.
- 10 MES = 1 ES.
- **/ES (E-Mini S&P 500):**
- Larger contract, each point = $50.
- Best for experienced traders or bigger accounts.
- **Other contracts:** NQ, YM, RTY, Gold, etc. (but start with MES to master one market).
---
### Step 2: How Much Risk to Take
- **Rule of thumb:** Risk **<10% of your account per trade.**
- Example: $2,000 account → risk $200 or less
- Example: $50,000 prop firm account = $2,000 or $2500 accounts because that’s your drawdown limits.
- **Daily max loss rule:** If you lose 3 trades in a day, step away. Protect your capital. ($600)
- Futures move fast—so use **bracket orders** (stop loss + profit target set together).
---
### Step 3: When to Trade
Most volume & volatility happens during these times (EST):
- 🟢 **U.S. session:** 9:30 AM – 12 PM (best for beginners).
- 🌍 Asia: 9:30 PM & 4 AM.
- 🇪🇺 Europe: 3 AM & 11:30 AM.
Stick to U.S. morning hours first—cleanest moves, best liquidity.
---
### Step 4: Use a System, Not Guesswork
At DIYWallSt, we trade with **VX Algo**, a system built to keep things simple:
- ✅ Market Structure (Bullish/Bearish flips).
- ✅ RSI signals (oversold/overbought).
- ✅ Super MACD (color-coded trend confirmation).
- ✅ Moving Averages (dynamic support & resistance).
Beginners should only enter when at least **2 signals confirm** the setup.
---
### Step 5: Getting Started Without Big Risk
Don’t want to risk your own money yet? Use a **Prop Firm Account**:
- **Apex Trader Funding:** Flexible, easy to start, bracket orders built in.
- **Topstep:** Consistency rules, great training ground.
- Pass an evaluation, trade with their money, and keep up to 90% of profits.
---
### Step 6: Tools You’ll Need
- **Brokerage:** Tradovate (beginner-friendly) or IBKR (advanced/global).
- **Charting:** TradingView + VX Algo indicators.
- **Journal:** Track every trade—P/L, emotions, signals, lessons learned.
---
### Quick Risk Examples
- **/MES moves 10 points = $50 gain/loss.**
- **/ES moves 10 points = $500 gain/loss.**
- That’s why beginners start with MES—it gives room to learn without blowing up.
---
### Final Words
Trading futures can change your life—but only if you treat it like a business.
- Start small (MES).
- Risk less than 1% per trade.
- Trade only when your system gives you signals.
- Journal everything.
👉 Stick with it, and you’ll avoid the mistakes that wipe out 80% of new traders.

ES primed for BIG end of month runAnalysis of the Fractal Pattern:
The analysis identifies two similar sequences of price movement, highlighted by colored arrows and boxed sections:
1. Initial Pattern (Left Side):
◦ Yellow Arrow (Support): The first fractal begins with a bounce from a lower trendline within the main channel.
◦ White Arrow (Resistance): Price then rallies to an intermediate high, where it faces rejection.
◦ Blue Arrow (Higher Low): Following the rejection, the price pulls back but establishes a higher low, finding strong support at the bottom trendline of the main ascending channel. This higher low is a critical bullish signal, indicating that buyers are stepping in at progressively higher prices.
2. Repeating Pattern (Right Side):
◦ Yellow Arrow (Support): The second, more recent pattern mirrors the first, starting with a bounce from an intermediate support level.
◦ White Arrow (Resistance): Price rallies towards the “Mth & 3 Mth VAH” (Monthly and 3-Month Value Area High) at approximately 6,499.75, where it is initially rejected.
◦ Blue Arrow (Higher Low): Similar to the first instance, the price then pulls back to the main channel’s lower trendline, forming another significant higher low around the 6,335.25 level before launching a strong upward impulse.
Key Observations and Outlook:
• Ascending Channel: The price is respecting the boundaries of the ascending channel, which currently defines the uptrend. The lower trendline acts as dynamic support, while the upper trendline represents potential resistance.
• Breakout and Target: After completing the second fractal with a strong bounce (blue arrow), the price successfully broke above the key resistance level at the Monthly & 3-Month VAH (6,499.75).
• Current Price Action: The price is now approaching the upper boundary of the ascending channel. The most recent candle shows a bearish rejection at this level (indicated by the pink arrow), suggesting this trendline is acting as formidable resistance.
Potential Scenarios:
• Bullish Continuation: If the fractal continues to play out, a period of consolidation or a minor pullback might occur before another attempt to break the upper channel trendline. A confirmed breakout above this channel would signal a significant acceleration of the uptrend.
• Bearish Reversal (Short-Term): The rejection at the top of the channel (pink arrow) could lead to a pullback. Key support levels to watch would be the recent breakout level at 6,499.75 and, subsequently, the channel’s midpoint. A break below the main channel’s lower trendline would invalidate this bullish structure.
Disclaimer: This commentary is for informational purposes only and does not constitute financial advice. Trading financial markets involves significant risk.

Current CME Fed watch stands at 83.1% Fed Cut in SeptCME Fed watch is at 83.1% Fed cuts in Sept.
AI Google says no cut.
September is almost upon us. Let's see who is correct.
Markets expect a cut. No cut and that could be a shocker.
#cmefed

Buyers follow throughBuyers follow through on the Friday daily chart to create a clean confident close going into the weekend. The expectation is follow-through to the upside on Monday but not a dramatic move.

Day 15 — Trading Only S&P Futures | +$121 Rate Cut RallyWelcome to Day 15 of Trading Only S&P Futures!
Running on only 3 hours of sleep, I knew today wasn’t the day to overtrade. With two major events at 10am and 12pm, I kept it simple — placed my basket orders, let the setups work, and went 2-for-2 green. Locked in +121.69 and wrapped it up by noon.
Sometimes the best edge is knowing when not to force trades.
📰 News Highlights
STOCKS SURGE TO END THE WEEK, VIX PLUNGES AFTER POWELL OPENS DOOR TO RATE CUT IN JACKSON HOLE
🔑 Key Levels for Tomorrow
Above 6415 = Remain Bullish
Below 6405 = Flip Bearish

Market Review – Plain TalkToday in Jackson Hole, Powell stepped off the stage with a speech that felt like walking a tightrope. On one side, he’s trying to keep a conservative line, while on the other, Trump is applying relentless pressure to cut rates by 25 basis points, not hesitating to call him a stubborn mule and an idiot. Despite disappointing GDP growth and mounting fears of a slowdown, the market keeps racing upward as if everything is perfectly fine. The Buffett Indicator is soaring at 209%, showing valuations are sky-high, yet investors seem blind to the warning signs. Meanwhile, Trump appointed Stephen Moore, a close ally and provocative figure, to the board, signaling how deeply politics is now woven into Fed decisions.
Powell finds himself surrounded by landmines. Trump is hammering him nonstop to slash rates, senior Fed officials are openly rebelling against policy decisions, employment data is starting to weaken, and the producer price index suggests Trump’s tariffs will spill over onto consumers and ignite inflation. And yet, for now, markets act like nothing’s wrong, pricing in gains and ignoring cracks in the real economy.
In my personal view, two scenarios lie ahead. If Powell gives in and cuts rates, markets will celebrate with another leg higher, but it will be a short-lived party that risks fueling inflation and eventually forcing the Fed into harsher tightening later. If instead Powell digs in and refuses to move, markets may take offense, selling off sharply and correcting valuations back to reality. Either way, the gap between Wall Street optimism and Main Street fundamentals is widening, and sooner or later, that gap will have to close — the only question is how painful the landing will be.

What is ES saying before Jackson Hole With Jackson Hole upon us, we're going to get some explosive moves. I have mapped out my thoughts on the 4H chart. Good luck, be careful out there

ES - August 22nd - Daily Trade PlanAt 6am EST -yesterday's trade plan I wrote " My lean is that IF, we cannot break above 6420, we have a high probability of retesting yesterday's 6362 low." The high of the day was 6412.25 (10am on 15 min) and the low was bought up at 6370.25 (1:15pm on 15 min).
At 10:22am EST - I stated that "We could easily chop around between 6420-6385 for the rest of the day and into tomorrow" We did chop around in that general zone and we did until we lost 6385 and recovered in the afternoon.
Before I get into the overnight session and today's plan. Take a look at ES on a 4hr, 6hr, 8hr Chart and you will see the past 2 days institutional buying at the 6362-69. Massive wicks show support for this range. WHY is this important? It helps us understand what the big $$ are doing. This also will become in the future a potential major level that will continue to be bought up or will be an area we see a flush lower. Always zoom out and see big picture of what could be happening.
-----------------------------------------------------------------------------------------------
4:30am EST - August 22nd - Daily Trade Plan
Solely based on the "Big Picture" (8hr Chart) we are still in a bullish trend. We are not going to change trend until we lose 6245. You can also see a potential head and shoulders pattern building with 6468 being the left shoulder, 6508 being head and we can potentially expect 6468 being the area the right shoulder could build towards.
IF, you have been reading my daily trade plans, you will remember that I said on the "August 19, Big Picture View of Price" (See in related publication section to the right) "You can see that on July 31st we hit 6468.75 and price sold off nearly 225 points and buyers stepped back in on August 1st at 6245 and the cycle begins with selling at resistance and buying at supports of 6315, 6333, 6390, 6453-6456. WHY has price been very choppy in this 6456-6472 area? Price is either accumulating or distributing, but we never know until price loses a big support or resistance."
While I do not predict patterns or what price will do today, tomorrow or next week. I just look for clues and then plan what levels I want to see flush and recover to follow the institutions.
Let's talk about today's plan and discuss what areas we want to see opportunities to grab some points. We have had a high of 6399.25 and 6364.50 as our high and low of the overnight session. Price still needs to clear 6420 to continue up the levels in yellow with 6468 eventually being initial target area for the next potential sell off. Price will go back and forth and chop up retail investors until the institutions have distributed enough to let price just flush down to a level they want to step back in and the cycle repeats. I missed the overnight flush of yesterday afternoon 6370 low (2:30am) and now price is coming into the overnight session resistance of 6399.25.
I need to identify either a move to retest 6412, back test 6399 and then buy on the support for a move to test 6420. Ideally, we could sell off back to the 6364 level or even better 6350, scare retail investors and then wait for a reclaim of 6364 to get back in and ride up. There is a Fed Meeting in Jackson Hole, and I expect some volatility after the NYSE open. I will be patient and wait until after the open to determine what price is doing and where there are good opportunities to enter either by a flush and reclaim of a level or a move higher and back test.
Be patient today, it could get volatile and it's better to wait for good setups to enter. My ideal scenario is waiting for one more good flush of 6364 and reclaim with a rally into the weekend and setting up for an end of month week into Labor Day holiday!
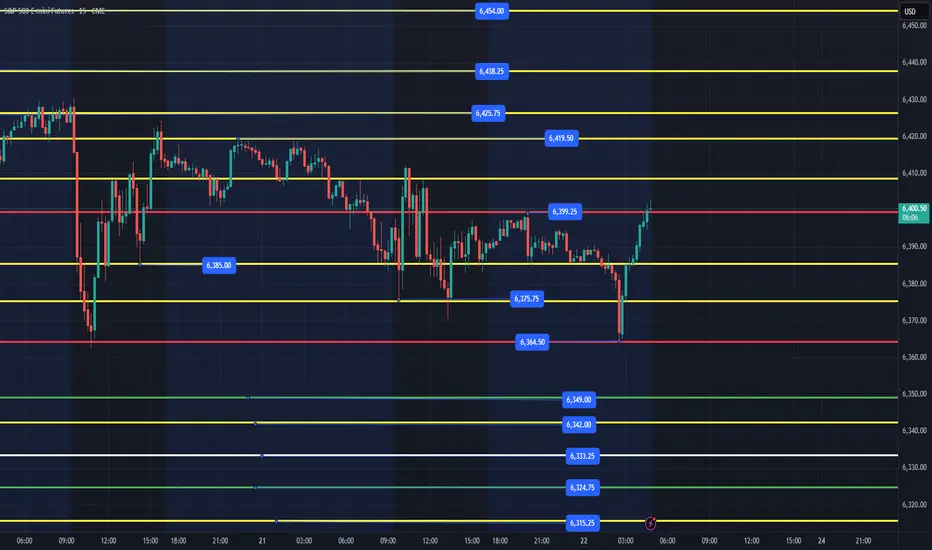
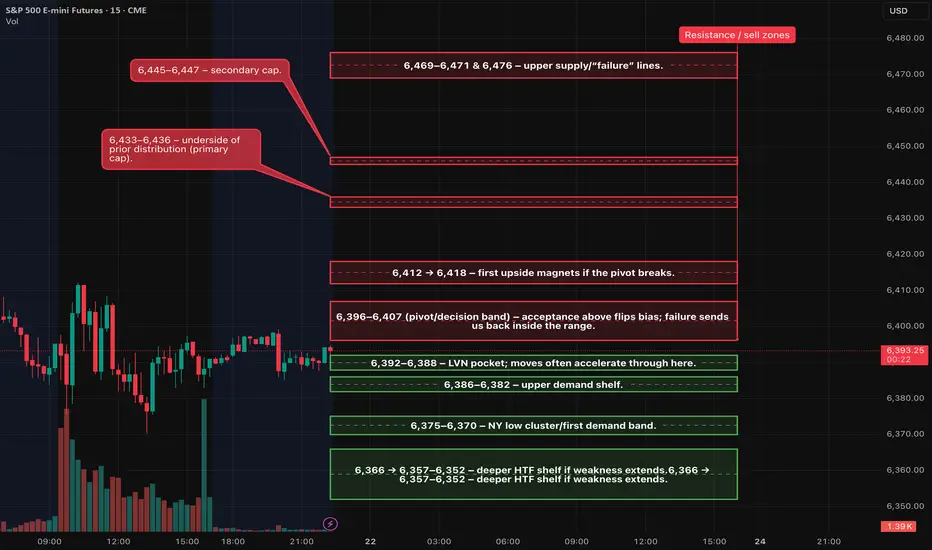
ES Futures — Plan for Fri, Aug 22 Intraday trend on 15m/30m remains down. The 6,396–6,407 band is the pivot/decision zone. Tomorrow’s session is dominated by Powell’s Jackson Hole keynote (10:00 ET) — plan around it.
Fundamentals & Risk Clock (ET)
• 10:00 — Fed Chair Powell speaks at the Jackson Hole Economic Policy Symposium. Treat this as the day’s primary catalyst; no new entries 09:55–10:05 per risk rules.  
• Otherwise, the U.S. calendar is relatively light vs. today’s prints; markets will key off the Powell tone and subsequent positioning.  
Structure Map (carry-forward levels)
Resistance / sell zones
• 6,396–6,407 (pivot/decision band) – acceptance above flips bias; failure sends us back inside the range.
• 6,412 → 6,418 – first upside magnets if the pivot breaks.
• 6,433–6,436 – underside of prior distribution (primary cap).
• 6,445–6,447 – secondary cap.
• 6,469–6,471 & 6,476 – upper supply/“failure” lines.
Support / buy zones
• 6,392–6,388 – LVN pocket; moves often accelerate through here.
• 6,386–6,382 – upper demand shelf.
• 6,375–6,370 – NY low cluster/first demand band.
• 6,366 → 6,357–6,352 – deeper HTF shelf if weakness extends.
Preferred Setup (A++): Range-Continuation Short
Take only with confirmation; score ≥9.
• Trigger: First 5-minute close ≤ 6,390.5 after a failed probe of 6,396–6,407, and the next bar fails to reclaim 6,392–6,394.
• Entry: 6,390.5 (MOS).
• Stop: 6,396.5 (≈6 pts).
• Targets:
• TP1: 6,375.5 (+15)
• TP2: 6,366.0 (+24)
• TP3: 6,358.0 (+32)
• Management: Scale ½ at TP1; move stop → BE only after a fresh 5m lower-low or a clean close through the TP1 zone. If no extension within 2×5m bars, cut to half/scratch.
• Disqualifiers: Thick support immediately stacks under entry or a 15m acceptance back above 6,396–6,407.
Flip Setup (A++ if accepted): Acceptance Long above Pivot
Counter-trend unless 15m turns; size accordingly.
• Trigger: First 5-minute close ≥ 6,407.5 and the next bar does not reclaim < 6,405.
• Entry: 6,407.5 (MOS).
• Stop: 6,401.5 (≈6 pts).
• Targets:
• TP1: 6,418.0 (+10.5 from trigger; acceptable given clean path)
• TP2: 6,435.0 (+27.5)
• TP3: trail toward 6,446+ if momentum persists.
• Disqualifier: Quick slip back < 6,405 after trigger.
Timing & Playbook
• Primary trade windows: 09:45–11:30 ET and 13:50–15:45 ET.
• Powell (10:00 ET): Plan around the speech; entries before the print must have exceptional quality, otherwise wait for post-event structure.
• MOC module (15:40–16:10 ET): Use the imbalance as a tiebreaker: modest (<$0.5B) = range; strong (≥$1B) can drive a directional push into the cross.
Going into Friday with a bullish biasThe S&P 500 daily chart structure implies a bullish bias going into Friday. This would imply a stronger close going into the weekend.
