NASDAQ – Decision Point is Now: Breakout or Breakdown?📈🔍 NASDAQ at Key Inflection – Momentum or Meltdown? ⚠️💥
Hey Traders,
The NASDAQ 100 is now standing right at the make-or-break zone: 22,655. This level marks a critical retest of the recent breakout, and what happens here could define the next major move.
🔵 The Setup:
After a strong bounce and sharp rally from below 18K, we've climbed back into the tight ascending structure. But momentum is slowing…
This zone could produce either a bullish continuation to new highs — or a brutal rejection that unwinds the entire move.
📍 Structure Speaks:
Holding above 22,655 = likely continuation
Breakdown = deeper pullback toward 20,000 and lower channel support
Momentum names like NVIDIA are doing the heavy lifting again — but can they sustain the market alone?
📊 What I'm Watching:
Bullish path = measured target ~25,000+
Bearish path = test of the broader trendline near 20,000 or even the 18,200 region
Macro signals still mixed — stay nimble, not married to one bias
⚠️ Stay Sharp:
Just like in crypto, the Nasdaq can punish both bulls and bears when it enters chop mode. Structure and discipline remain your best defense.
I’ve updated the chart — fresh out the oven 🍞 — and more market ideas are following, including BTC, ETH, and BTC Dominance.
One Love,
The FXPROFESSOR 💙
Disclosure: I am happy to be part of the Trade Nation's Influencer program and receive a monthly fee for using their TradingView charts in my analysis. Awesome broker, where the trader really comes first! 🌟🤝📈
Trade ideas

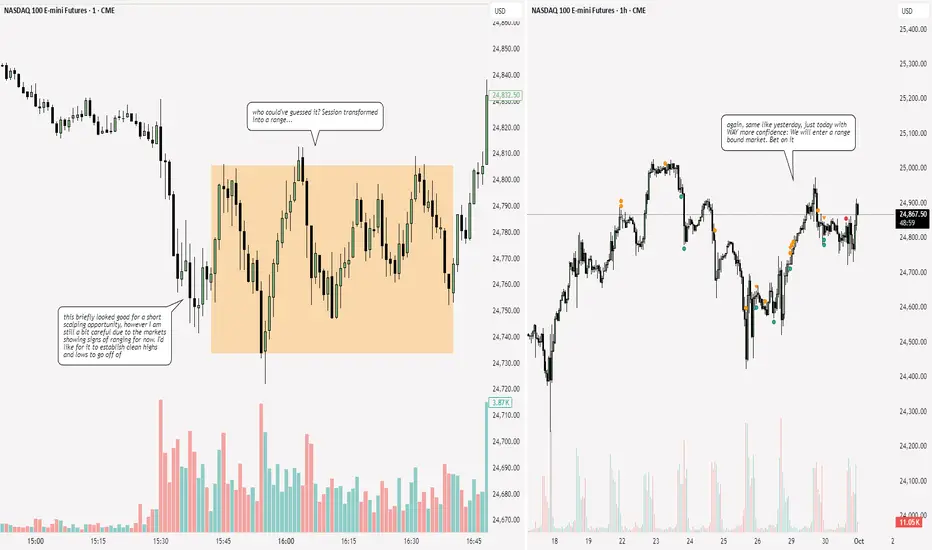
NQ: 263rd trading session - recapWon't trade tomorrow nor the day after that. It is unfortunate but atleast we're in a spot of where price is now least likely to show real strong signs of a bearish pullback / reversal
Target areas - NQ price for Market open.9/30/25 These are the target areas - NQ price for Market open depending if price moves up or down. Will look for trades into these areas.

30 sept DOWN NASDAQshort in nasdaq.
looking at weaknes in daily.
entry in blue
stop in red.
target in green.
have fun
all details of the trade are explained on the video
Electra 33

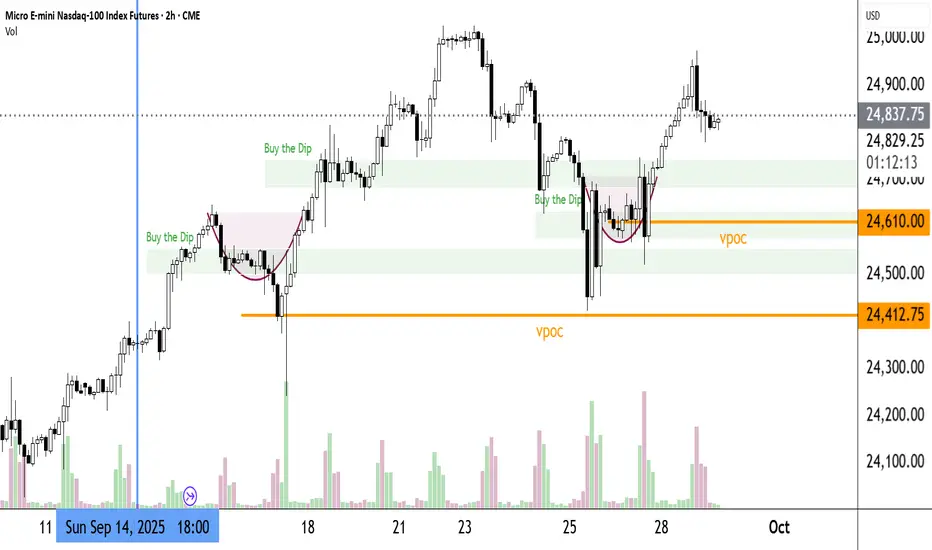
Such a Beautiful ChartMust be published.1.Ascending Triangle 2.Magnificent Resistance 3.Much more besides. Take it all in. Breakout, Buy the Dips and Pivots. Much fertile ground.

NQ Power Range Report with FIB Ext - 9/30/2025 SessionCME_MINI:NQZ2025
- PR High: 24837.75
- PR Low: 24807.75
- NZ Spread: 67.0
Key scheduled economic events:
09:45 | Chicago PMI
10:00 | CB Consumer Confidence
- JOLTS Job Openings
Session Open Stats (As of 12:15 AM)
- Session Open ATR: 267.05
- Volume: 16K
- Open Int: 274K
- Trend Grade: Long
- From BA ATH: -0.7% (Rounded)
Key Levels (Rounded - Think of these as ranges)
- Long: 25204
- Mid: 23571
- Short: 21939
Keep in mind this is not speculation or a prediction. Only a report of the Power Range with Fib extensions for target hunting. Do your DD! You determine your risk tolerance. You are fully capable of making your own decisions.
BA: Back Adjusted
BuZ/BeZ: Bull Zone / Bear Zone
NZ: Neutral Zone
NQ1/NDX - LONG TO FINAL BOSSGood Morning,
Long till final boss. We saw NDX take a pull-back in last weeks session. Since there has been some great momentum and now we are seeing a break out of consolidation into what is looking like a pretty nice run.
EMA 9 crossed EMA 50 - Breakout from consolidation and en route to break about previous highs.
Keep on eye on the 9 & 50 EMA as the trade progresses upwards. Break below these moving averages would suggest more consolidation until the new trend is determined.
Trade Safe Enjoy!

Face Value: Poised to go up1.Fundamentals of growth are good.
2.Q2 est. 3.8% growth
3.Q3 growth tracking @ 3.9% growth
4.Projections of $45/barrel oil in 2026
5.Many other favorable reasons
On the other hand
Jerome Powell and the Federal Reserve say that they focus on supply-demand balance: when demand outpaces supply prices go up, and we have inflation. Therefore, so they conclude, we must keep interest rates high so people can't afford anything.
Common sense says if you lower interest rates the money necessary for production will be less expensive, the supply will increase and prices will go down, as will inflation.
Their view of ''supply-demand balance'' sounds like nonsense. I think common sense wins every time.
The chart appears to be building a new base from which to head upwards. I'd like to see it go lower, but my Breakout trades are in place and I'm ready for the Breakout if it happens here.
If this does become a new base, barring a Black Swan event, we should see a new high soon.
NQ Shorts re entryAfter the recent win I saw a new clear break above my set levels. And a perfect textbook reversal formed. Entere more shorts.
Setting alerts and waiting patiently is how consistency starts, once you form those small habits over time it becomes simple repition and then profitability flows from there.
I didnt find this consistency until I aligned my trading with Christ.

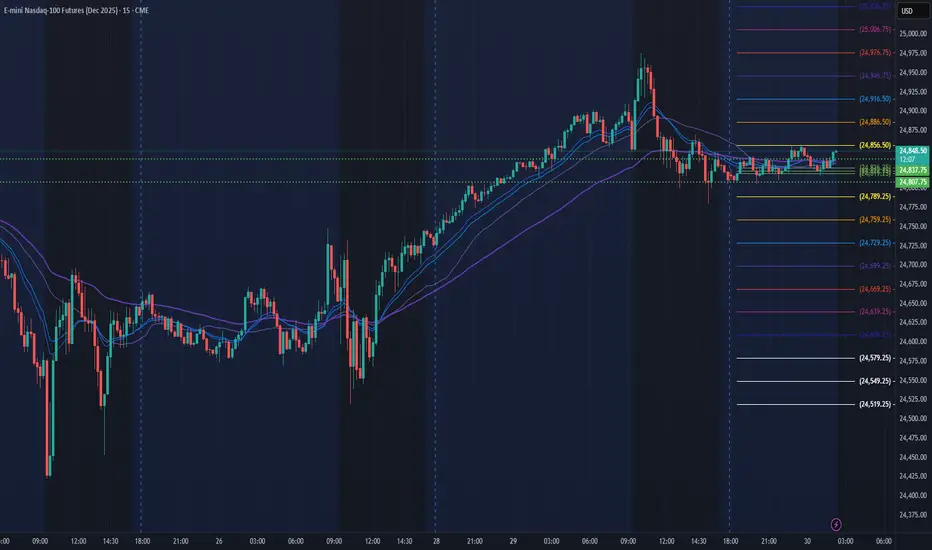
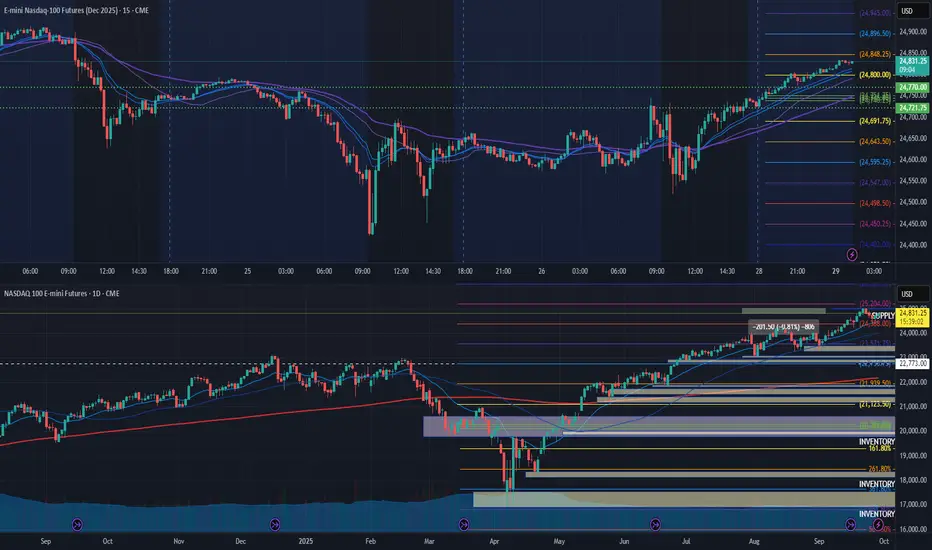
NQ 9/30Weekly timeframe high low and median range boxed in grey
the daily high, low and median range from yesterday is boxed in red
orange levels are 4hr timeframe
yellow are 1hr timeframe
blue are 15min timeframe levels

NQ: 262nd trading session - recapBasically another filler session. It's just one of these days again - just for the book
Target areas - NQ price for Market open.9/29/25 These are the target areas - NQ price for Market open depending if price moves up or down. Will look for trades into these areas.

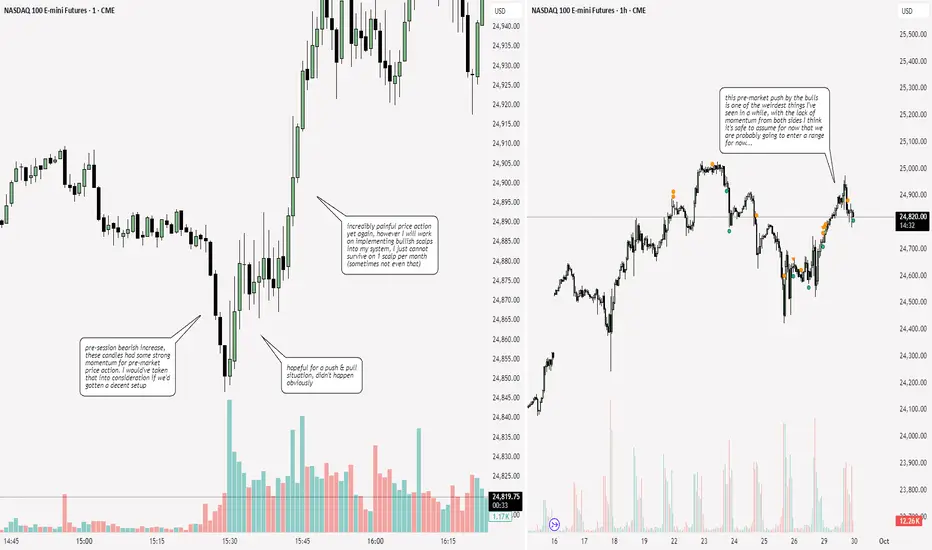
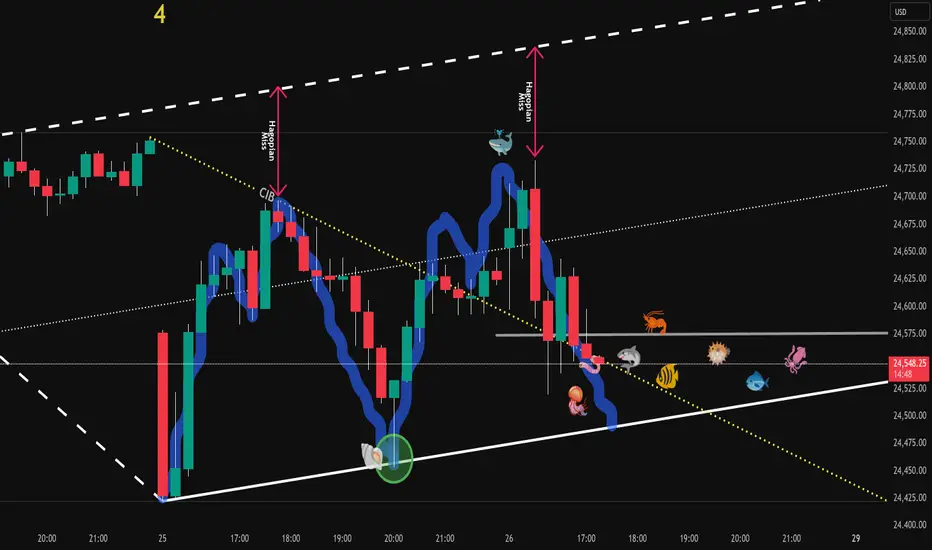
NQ is twitching the worm - Don't take the bait🎣 Don’t take the bait! 🎣
Just sitting here, watching my pre-market setup.
Now I can see them twitching the worm, trying to lure me in.
NOPE!
This price action’s way too twitchy for me. §8-)
This Chart is a RTH with "Gap-Attached" and gives a perfect catch of the first drop.
So, just casually watching...maybe I can learn even more...
🐟🐠🐡🐟🐠🐡🐟🐠🐡🐟🐠🐡🐟🐠🐡🐟🐠🐡🐟🐠🐡
NQ Long Looks like a solid setup — hopefully it plays out well.
I think I can size up a bit on this trade.
If you’re planning to go big, just make sure to time your entry on the lower timeframe. Otherwise, you’ll end up stressing and waiting for the price to move in your favor.
Hope that helps.

NQ Targets (09-29-25)Moving into October, 7 week range forecast. Basically, 23,050 is 50% retracement of YTD lift. Looking for a retest of that, no hold and keep going to the YTD Open or circle below (yellow arrow path). White arrow path has two targets, these are potential drop/rejection zones (to yellow arrow path). KL 24,950 is ML of TZ, we have played in lower half and may see some play in upper half. Sideways to lower during this 7 week period is the idea.

Halloween rallycalling the halloween rally since too early for santa's.
anyways lets take this to olympus, valhalla or any paradise u want moon mars sun.
ASAP ;)

NQ Power Range Report with FIB Ext - 9/29/2025 SessionCME_MINI:NQZ2025
- PR High: 24769.75
- PR Low: 24721.75
- NZ Spread: 107.5
No key scheduled economic events
Session Open Stats (As of 1:15 AM 9/29)
- Session Open ATR: 273.59
- Volume: 28K
- Open Int: 273K
- Trend Grade: Long
- From BA ATH: -0.8% (Rounded)
Key Levels (Rounded - Think of these as ranges)
- Long: 25204
- Mid: 23571
- Short: 21939
Keep in mind this is not speculation or a prediction. Only a report of the Power Range with Fib extensions for target hunting. Do your DD! You determine your risk tolerance. You are fully capable of making your own decisions.
BA: Back Adjusted
BuZ/BeZ: Bull Zone / Bear Zone
NZ: Neutral Zone
Nq shorts at the momentI took a short position here and am looking to trail it down for a decent RR.
Glory to Christ!

Both Side Movement on NQ on week 29/09 - 03/10I expect price to move higher clearing those highs at 25000 before starting full corse to the downside.
We could see a 6-7% drop the month of October possibly even 10-12%. Opportunity to get into the market cheaper.
Always remember, Caution, Patience and Risk!
GL!
If you like the content give me a follow on X!
Check Bio. Cheers!

NQ: 261st trading session - recapAnother post to ignore basically, nothing worth mentioning here. This is just again a post just for the books

#202539 - priceactiontds - weekly update - nasdaq e-miniGood evening and I hope you are well.
comment: Neutral/Slightly bullish above 24800 for at least 25000. I think we have seen the final bull flag and will now get either a new ath or a lower high, you never know in advance. If bears get below 24500 before we go above 24800, I am likely wrong and we could see a bear surprise and lower prices. My assumption for the next weeks is that we will hit at least 23500.
current market cycle: parabolic buy climax very late in the trend - I think we top out very soon or 25027 already was the high
key levels for next week: 24300 - 25100
bull case: Bulls printed a higher low on Friday and are free to now break above 24800 and re-test 25000. Everyone and their dead granny knows that this is overbought and overdone but that does not mean we have to go down. Tops are a process and we don’t even know if we have started it yet.
Invalidation is below 24400
bear case: Anything below 24400 would be amazing for the bears and I do think a bit of a surprise. If they somehow manage to generate much more selling pressure, their biggest target is the bull trend line around 24000. As of now, given Friday’s price action, we can’t expect it though.
Invalidation is above 25100
short term: Neutral but want to lean bullish for a re-test of 25000. Bears would have to surprise big time for me to join them somewhere between 24600 and 24800.
medium-long term - Update from 2024-08-10: 22000 likely to get hit this year gain.

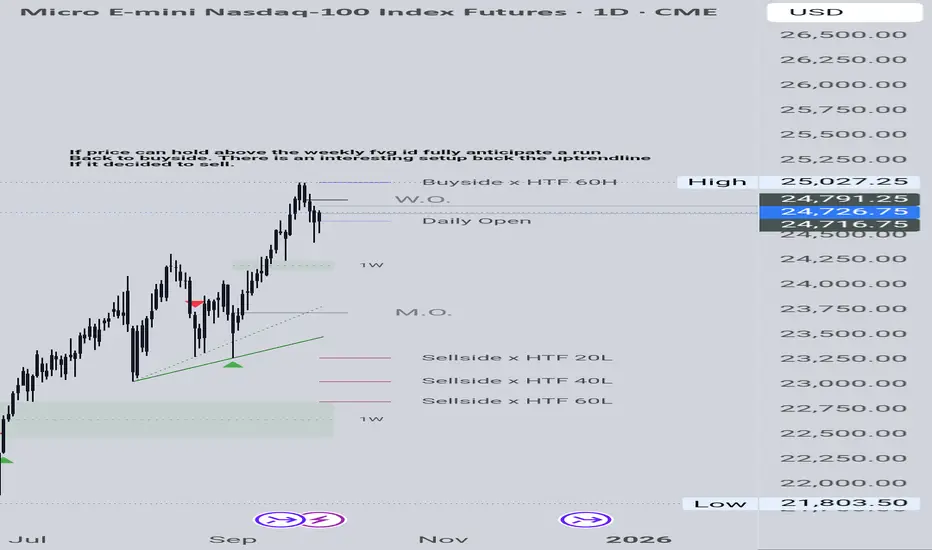
Tale of two tapes. I am watching higher tf. Friday we did see a shift in structure for increased buying. If this continues on a gap up at globex open id suspect we do see another run on buyside. I am also watching that long tailed wick below as that could serve as a magnet on any selling pressure. This also aligns with the daily uptrend line. Holding the weekly FVG is kind of acting like a line in the sand at this point. There is plenty of liquidity below.
Introduction to Positional Trading in Global Markets1. Understanding Positional Trading
1.1 Definition
Positional trading is a strategy where traders take positions based on anticipated price trends over an extended period. Traders using this approach do not react to short-term volatility but focus on the underlying market direction. The objective is to benefit from medium to long-term price trends, maximizing profit while reducing the noise associated with intraday fluctuations.
1.2 Key Features of Positional Trading
Time Horizon: Positions are usually held for multiple days to several months.
Focus on Trends: Decisions are based on identifying upward or downward trends in asset prices.
Lower Transaction Frequency: Fewer trades reduce transaction costs and emotional stress.
Dependence on Analysis: Traders rely heavily on technical indicators and fundamental data.
2. The Global Market Environment
Global markets encompass a variety of asset classes: equities, commodities, currencies, bonds, and derivatives. Positional traders must understand the interconnected nature of these markets to make informed decisions.
2.1 Equities
Global equity markets, including the NYSE, NASDAQ, London Stock Exchange, and emerging markets, are influenced by corporate earnings, central bank policies, and geopolitical events. Positional traders often focus on high-cap stocks or sectoral trends to identify medium-term opportunities.
2.2 Commodities
Commodities like crude oil, gold, silver, and agricultural products are highly sensitive to supply-demand dynamics and global economic conditions. Positional traders exploit medium-term price swings by monitoring inventories, global demand forecasts, and geopolitical tensions.
2.3 Currencies (Forex)
Forex markets are the largest and most liquid in the world. Exchange rates are influenced by interest rates, inflation, political stability, and macroeconomic indicators. Positional trading in forex focuses on trends between currency pairs over weeks or months.
2.4 Bonds
Global bond markets respond to interest rate changes, inflation expectations, and government policies. Positional traders may take long or short positions based on yield curve movements and central bank announcements.
3. Core Principles of Positional Trading
Successful positional trading relies on several core principles:
3.1 Trend Identification
Trend recognition is fundamental. Traders classify trends into:
Uptrend: Higher highs and higher lows.
Downtrend: Lower highs and lower lows.
Sideways/Range-bound: Price fluctuates within a channel.
Technical tools like moving averages, trendlines, and channels help identify trends.
3.2 Support and Resistance Levels
Support is a price level where demand exceeds supply, halting a downtrend. Resistance is a level where supply exceeds demand, halting an uptrend. Positional traders use these levels to set entry, exit, and stop-loss points.
3.3 Risk Management
Managing risk is crucial in positional trading, especially when positions are held over long periods. Key risk management strategies include:
Position Sizing: Limiting capital exposure per trade.
Stop-Loss Orders: Automatically exiting losing positions to minimize losses.
Diversification: Spreading investments across markets or sectors to reduce risk.
3.4 Patience and Discipline
Unlike intraday trading, positional trading requires patience. Traders must avoid emotional reactions to short-term price fluctuations and stick to their predefined strategy.
4. Tools and Techniques for Positional Trading
Positional trading relies heavily on technical and fundamental analysis to make informed decisions.
4.1 Technical Analysis
Technical analysis involves studying historical price movements and patterns to forecast future trends. Common tools include:
Moving Averages (SMA, EMA): Helps smooth price data and identify trend direction.
Relative Strength Index (RSI): Measures momentum and identifies overbought/oversold conditions.
MACD (Moving Average Convergence Divergence): Helps spot trend reversals.
Fibonacci Retracements: Identifies potential support and resistance levels.
4.2 Fundamental Analysis
Fundamental analysis focuses on macroeconomic indicators and company-specific metrics. Key elements include:
Economic Data: GDP growth, inflation rates, unemployment, and industrial production.
Corporate Earnings: Revenue, net profit, debt levels, and cash flow.
Geopolitical Events: Trade wars, sanctions, elections, and policy changes.
4.3 Sentiment Analysis
Market sentiment plays a significant role in medium-term price movements. Positional traders monitor news, analyst reports, and social sentiment to gauge market psychology.
5. Strategies in Positional Trading
Positional traders can adopt various strategies depending on their risk tolerance and market conditions:
5.1 Trend Following
The most common positional strategy involves following the prevailing market trend. Traders enter positions in the direction of the trend and ride the momentum until signals indicate a reversal.
5.2 Breakout Trading
Breakout traders enter positions when prices break key support or resistance levels. This strategy captures sharp price movements initiated by market volatility.
5.3 Range Trading
In range-bound markets, traders buy at support and sell at resistance. While not as common in global positional trading, it can be effective for certain currencies or commodities.
5.4 News-Based Positional Trading
Major economic announcements, earnings reports, and geopolitical events can create medium-term opportunities. Traders position themselves ahead of expected market moves.
6. Risk Factors in Global Positional Trading
Trading globally exposes traders to several unique risks:
6.1 Market Risk
Price fluctuations due to macroeconomic changes, investor sentiment, or geopolitical events can impact positions.
6.2 Currency Risk
For traders investing in foreign markets, exchange rate fluctuations can affect returns.
6.3 Liquidity Risk
Some global markets or assets may lack sufficient liquidity, making entry and exit difficult.
6.4 Political and Economic Risk
Policy changes, sanctions, or elections can affect market conditions and disrupt trends.
6.5 Interest Rate Risk
Changes in interest rates influence equities, bonds, and currency markets, affecting positional trades.
7. Positional Trading in Different Asset Classes
7.1 Equities
Positional trading in equities involves selecting stocks with strong medium-term potential. Traders analyze:
Price patterns and moving averages
Earnings growth and valuation metrics
Sectoral trends and global economic indicators
7.2 Forex
In forex markets, positional traders focus on:
Currency pairs with strong macroeconomic support
Technical patterns like head and shoulders or trend channels
Central bank policies and interest rate differentials
7.3 Commodities
Positional traders in commodities analyze:
Seasonal demand patterns (e.g., agricultural cycles)
Supply shocks and geopolitical factors
Global inventory and production data
7.4 Bonds and Fixed Income
Traders monitor:
Yield curves
Inflation expectations
Government policy announcements
8. Developing a Positional Trading Plan
A robust trading plan is essential for consistency:
8.1 Setting Objectives
Define profit targets, risk tolerance, and time horizons.
8.2 Market Analysis
Use a combination of technical and fundamental analysis to select assets.
8.3 Entry and Exit Rules
Entry: Confirm trend direction using indicators.
Exit: Use stop-loss, profit targets, and trend reversal signals.
8.4 Monitoring Positions
Regularly track positions but avoid reacting to short-term noise.
8.5 Reviewing Performance
Analyze past trades to identify strengths and weaknesses, refining the strategy over time.
9. Advantages of Positional Trading
Reduced Transaction Costs: Fewer trades mean lower brokerage fees.
Less Stress: Traders are not glued to screens all day.
Opportunity to Capture Major Trends: Can generate significant profits by riding strong medium-term trends.
Flexibility: Suitable for both part-time and full-time traders.
10. Challenges in Positional Trading
Exposure to Overnight and Weekend Risk: Price gaps can occur between sessions.
Requires Discipline: Impulsive decisions can erode profits.
Analysis Intensive: Requires continuous monitoring of global trends and indicators.
Slower Feedback: Unlike day trading, success or failure takes longer to materialize.
11. Case Studies in Global Positional Trading
11.1 Stock Market Example
During the post-pandemic recovery, traders who held technology and healthcare stocks for several months captured significant gains due to market trends and sector-specific growth.
11.2 Forex Example
Positional traders holding USD/JPY positions benefited from long-term monetary policy divergence between the Federal Reserve and the Bank of Japan.
11.3 Commodity Example
Gold positional traders who bought during inflation fears in 2021-2022 captured substantial upward trends over several months.
12. Conclusion
Positional trading in global markets is a strategic approach that balances risk, patience, and market insight. By focusing on medium to long-term trends, traders can capitalize on significant price movements while minimizing the stress and noise associated with short-term trading. Successful positional trading requires a combination of technical analysis, fundamental understanding, risk management, and disciplined execution. In an increasingly interconnected global economy, staying informed about macroeconomic developments, geopolitical events, and market sentiment is crucial. Positional trading is not just about predicting price movements—it’s about aligning strategies with global trends and maintaining a disciplined, patient approach to investing.
