NQ Range (11-10-25, Week 7)The 7 week Forecast is in the final week and we are up about 300 points after getting rejected at upper Target. NAZ back in the Churn Zone and did U Turn off Friday lows just under the Mid Level CZ. KL 483 is TZ to 25,333. Key fact is the NAZ and NDX are at long tern TL. Under the TL is Danger Zone to lower CZ and then TLX 24,056. Current range to watch is 25,333 and 24,817. Friday lift was Failed Auction up and these usually will get retested. Could be a start of a U Turn (that will drop and retest). Or, just another Friday pump drop offset that will trap the BTD/FOMO's.
Trade ideas

"Get Up Offa That Thing"James Brown 1976 Funk
Get up offa the shutdown.
Get up offa the dance floor.
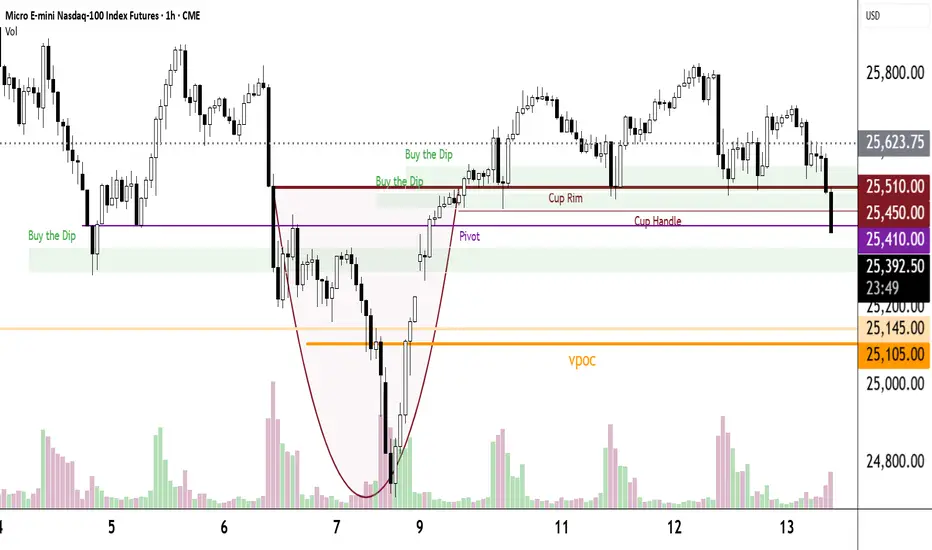
Today's Dance Floor is 25510.
Hmmm...What's happening? He thought we would have seen a much bigger bounce last night when the shutdown ended.
Today's key landmarks are clearly seen.
Buy the Dips
***Wait for a bounce
***He simply waits for a Bullish white candle.
***Then he looks for a bit of support, your choice, whatever you are comfortable with.
***In 5-point increments from there to the low of the bounce he buys 1 MNQ
***Each entry has a 21-point target.
If you are more conservative, tailor it to your trading style. He especially likes a White Bull preceded by an Exhaustion Candle @ a Prior Day Close.
No stops allowed.
Sometimes the Px falls through the floor. Keep some dry powder for that event.
Repeat the process for the next BTD area.
This plan is a $$$ maker.
Don't forget Breakouts, A Pawn for a King, Pivots & Jokers.
NASDAQ 100 (NQ1!): Time To Buy This Dip? Oh Yeah!Welcome back to the Weekly Forex Forecast for the week of Nov. 10-14th.
In this video, we will analyze the following FX market: NASDAQ (NQ1!) NAS100
The NASDAQ pulled back after rallying for weeks! We patiently waited for a dip buying opportunity to form. Well, Friday might have given us the indication of an end to the pullback... and the opportunity to buy the dip may be upon us!
Wait for the shift in the market structure from bearish to bullish to form... then look for your
valid long setups.
Enjoy!
May profits be upon you.
Leave any questions or comments in the comment section.
I appreciate any feedback from my viewers!
Like and/or subscribe if you want more accurate analysis.
Thank you so much!
Disclaimer:
I do not provide personal investment advice and I am not a qualified licensed investment advisor.
All information found here, including any ideas, opinions, views, predictions, forecasts, commentaries, suggestions, expressed or implied herein, are for informational, entertainment or educational purposes only and should not be construed as personal investment advice. While the information provided is believed to be accurate, it may include errors or inaccuracies.
I will not and cannot be held liable for any actions you take as a result of anything you read here.
Conduct your own due diligence, or consult a licensed financial advisor or broker before making any and all investment decisions. Any investments, trades, speculations, or decisions made on the basis of any information found on this channel, expressed or implied herein, are committed at your own risk, financial or otherwise.

NAS100 - Head and ShouldersWithout a doubt, a Head and Shoulders according to the bullish channel, RSI in oversold territory, looking ahead to the Year-End rally...

BULLISHNQ
BIAS: BULLISH
DAILY: Price is currently above the daily -OB MT. Yesterday, price retraced to the 4H + inversion fair value gap and respected this discount array and took off.
PDH & Asian High (equal highs): Has been raided ahead London opening plus the Old High on Thursday Nov. 06, 2025. Then it retraced lower filled the 1H +FVG between 11:00pm and 1:00am
PRE-MARKET: NQ and ES made a LL whereas YM failed to make a LL. There's a cracking correlation here (SMT).
BUYSIDE TARGET: LONDON HIGH @25,830.25 and DAILY -FVG Low end @ 25,881.00

TREND LINE 5M30 SECOND MODELPrice swept the prior session’s Asia low, tapping into a 4H demand zone aligned with a 1H bullish order block. On the 1-minute chart, liquidity was taken and a clean BISI formed. Entered long on the first retracement into the FVG with stops below the swing low. Targeted the opposing 15M liquidity pool, partialed at the midpoint, and closed the rest as price reacted into a 1H imbalance.

NQ = NAS100Elite Strategy
NASDAQ (MNQ/NQ) – Multi-Timeframe Analysis
Price tapped into the 45-minute imbalance inside a 4H premium zone. The overall structure remains bearish, and the reaction confirms sellers defending this level.
Expecting continuation toward 25,300 and possibly 25,000 as the next liquidity zones.
Key confluence: 4H bearish structure + 45m FVG + liquidity grab on 5m.
📊 Educational analysis — not financial advice.
-------
Higher-Timeframe Context (4H Chart)
🔹 Overview
The 4H chart shows a clear bearish structure: lower highs and lower lows.
Price dropped aggressively from the 26,300–26,400 supply zone (blue).
The market then found strong demand at 24,800–25,000 (blue + gray confluence zone).
Current price is reacting to a 45-minute fair value gap (FVG) marked in red, sitting inside a bearish 4H imbalance.
🔹 Implications
The FVG at 25,550–25,600 represents a premium retracement level in a bearish leg.
This area is optimal for short-position entries as price taps into unmitigated imbalance.
Expectation: rejection → continuation toward 25,300 or lower, targeting the demand zone (24,900–25,000).
_______
Lower-Timeframe Confirmation (5-Minute Chart)
🔹 What’s happening now
Price just filled the 45-minute gap and reached the same supply zone.
Microstructure shows a slowdown + rejection wick from the red zone.
Potential entry trigger for short bias around 25,555–25,590.
Targets:
1st TP: 25,400 (internal liquidity)
2nd TP: 25,300 (structural low)
Stop-loss above 25,595 (above FVG).
🔹 Confluence
4H + 5M both align: bearish reaction at premium zone.
The liquidity buildup under 25,400 acts as the next target area.

Ode to Joy Jr.Buy the Dips worked well.
He always waits for a bounce in a BTD area (accumulation/distribution area). He buys 1 MNQ in 5-point intervals. Every target is 21 points. His first entry was 610 and his bottom entry was 490.
He has entered NQ Breakouts. First entry at 620 and every 20 points thereafter. 19-point target per entry.
If you prefer The MNQ Ladder of success you may buy 1 or more contracts every 5 points. 19-point target per entry. If you prefer 1 or more contracts every 10 points.
Ode to Joy Jr. because I think the original may have been taken down by the moderators.

NQ Daily Outlook | November 12th, 2025Most likely direction: Up (bullish)
Why:
Trend is still up on my read of structure.
NY session pulled back deeper than expected and slipped under the black 50 EMA.
I see it as a correction within the trend. I expect price to reclaim and trade back above the EMAs and continue higher.
Scenarios:
Preferred — Reclaim and continue: We push back above the EMAs, they curl up, and we get a break of structure to the upside. I’ll look to join on the first clean impulse → shallow correction → continuation above the EMAs.
Retest then go: We dip a bit more, hold a higher low, then reclaim the EMAs. Once BOS up prints and EMAs fan upward, I lean long again.
Bear alt: We stay trapped under the 50 EMA, fast EMAs roll over, and we print a BOS down (lower low). If that happens, I step back or treat it as range-to-down for the day.
Bias:
Bullish while we can reclaim and hold above the EMAs with upside BOS.
If EMAs stay above price and structure flips down, I’ll pause the long idea.

Monitoring AI Valuation - Precision on Upcoming CorrectionThese are the three largest market-cap listed companies on the Nasdaq.
If we are concerned about an AI bubble, I’m going to show you how I perform a quick glance at some top companies and their index to determine the likelihood of an upcoming short-, mid-, or long-term correction.
In 2017, Microsoft’s P/E reached its highest at 45 — and it continued to rise after that.
In 2023, Nvidia’s P/E reached its highest at 147 — and it continued to rise after that.
In 2024, Apple’s P/E reached its highest at 40 — and it continued to rise after that.
Micro E-mini Nasdaq-100 Index
Ticker: MNQ
Minimum fluctuation:
0.25 index points = $0.50
Disclaimer:
• What presented here is not a recommendation, please consult your licensed broker.
• Our mission is to create lateral thinking skills for every investor and trader, knowing when to take a calculated risk with market uncertainty and a bolder risk when opportunity arises.
CME Real-time Market Data help identify trading set-ups in real-time and express my market views. If you have futures in your trading portfolio, you can check out on CME Group data plans available that suit your trading needs www.tradingview.com

Will History Repeat Itself? NASDAQ 2025 vs 2020The NASDAQ 100 is currently showing a striking structural symmetry to the 2020 pre-crash formation.
Both phases formed a 5-wave impulsive rally, followed by tight consolidation near highs — a typical distribution top pattern.
The 20-day EMA is starting to flatten, signaling a possible loss of momentum.
If symmetry continues, the index could mirror a short- to mid-term correction, similar to early 2020’s breakdown.
While macro conditions differ today, market behavior often repeats in fractal patterns — a reminder that price structure often precedes headlines.
📊 Keep watch for a confirmed EMA rollover and breakdown below support near 25,500 — that could validate the bearish symmetry.

Possible short for NQ setting upJust a simple one for NQ on the 4hr. Down trend line and GP lining up nicely. If this down trend is going to continue this is where the roll over should happen. I am not interested until the .5 fib is breached to show there is momentum the down.

Elliott Wave Analysis of Nasdaq (NQ) Forecasts New All Time HighThe bullish cycle in the Nasdaq (NQ) that commenced from the April 2025 low remains underway, unfolding as an impulsive Elliott Wave structure. Within this broader advance, wave (3) of the eight-month rally concluded at 26,399. The subsequent corrective phase, wave (4), developed as a double three structure. This is an Elliott Wave pattern characterized by a combination of corrective sequences.
From the peak of wave (3), wave ((a)) declined to 25,853, followed by a rebound in wave ((b)) that reached 26,274. The final leg of the correction, wave ((c)), extended lower to 25,282, thereby completing wave W of a higher degree. A subsequent rally in wave X peaked at 25,880 before the index turned lower once more in wave Y, which has taken the form of a zigzag.
Within wave Y, wave ((a)) declined to 25,162, followed by a corrective bounce in wave ((b)) to 25,354.75. The final leg, wave ((c)), dropped to 24,707.1, marking the completion of wave Y of (4). From this low, the index has resumed its upward trajectory in wave (5). Advancing from wave (4), wave ((i)) topped at 25,768.75, and the pullback in wave ((ii)) found support at 25,478.50. Provided the pivot at 24,707.1 remains intact, the near-term outlook favors further upside continuation in wave (5)

NQ UpdateBoth MFI and RSI hit oversold, and there is a gap above. There's also the TACO gap below though.
I figure we get a bounce off the blue line either way.

Trades with B – Daily Recap (Nov 10 2025)Ticker: QQQ / NQ1!
Strategy: ORB Pro with Filters + 5 min / 15 min Multi-Timeframe Confluence
Result: Green day ✅ (+$97.78 total gain)
🧭 Market Context
The market opened inside an early consolidation range with mixed momentum. The 5-minute chart gave the first confirmation through a clean ORB signal rejection, while the 15-minute held the higher-timeframe structure and kept the EMA slope intact.
The plan today was simple — trade the first valid signal from ORB Pro, confirm with the higher timeframe trend, and respect stops.
🎯 Trade Execution Recap
9:37 AM: First Call entry (ORB signal + fib retest) — caught the initial push before stall. + $172.94
9:44 AM: Locked profits on strength into EMA resistance.
11:14 AM: Put entry after ORB Pro signaled a short on the 5 min matching 15 min trend.
11:40 AM: Exit for + $194.94 after momentum follow-through.
Cumulative Options P/L:
QQQ $618 Put (11/10/25) → + $67.89
QQQ $621 Call (11/10/25) → + $29.89
Net: + $97.78
💡 What Went Right
Followed the ORB signal with confirmation from the higher-timeframe trend filter.
Perfect execution on the Put trade — clean entry and timely exit.
Didn’t overstay the welcome once the move completed.
⚠️ What to Improve
Stay patient for stronger confluence before taking early entries.
Avoid re-entries once price returns to mid-range (less edge after initial break).
🧘♂️ Reflection
“The 5 min showed me the trigger, the 15 min confirmed the story. ORB Pro did its job — I just had to listen.”

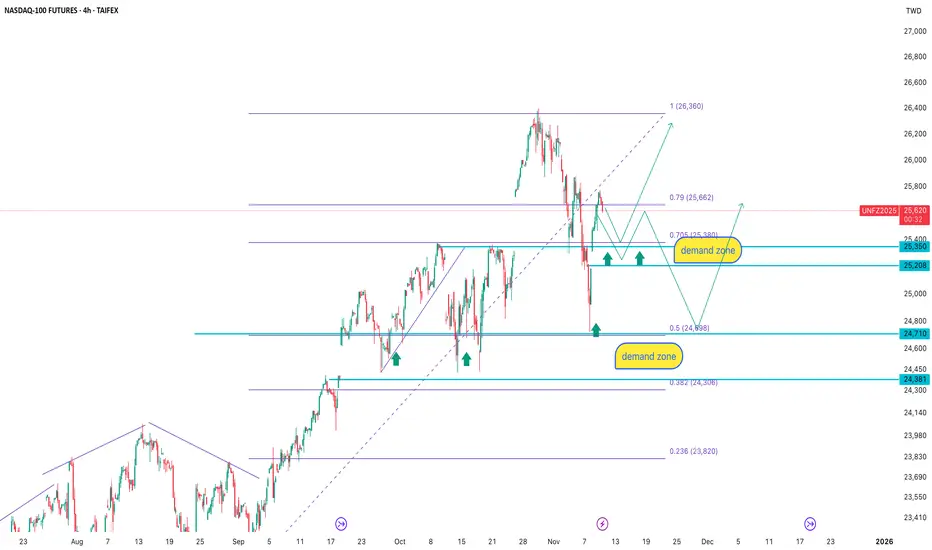
NASDAQ-100 4H: demand is not gone, only waiting for the priceAfter the recent upward impulse, the price retraced into the key demand zone at 25 350–25 208, an area that has repeatedly triggered buying reactions in the past. T
he latest correction pushed the price into the 0.79–0.705 Fibonacci range, which frequently acts as a retest zone before continuation.
Below that lies an even stronger demand zone at 24 710–24 381, aligning with the 0.5 Fibonacci level and previous volume accumulation.
The trading logic here is simple: don’t chase the move, let the price come to demand and wait for confirmation.
As long as the market structure holds, the primary scenario remains bullish from demand zones with a target toward 26 360 and potentially higher.
Fundamentally, NASDAQ remains supported by expectations of softer Fed policy, strong tech capital inflows, and continued investment in AI, cloud, and data-center infrastructure. Smart money accumulates on corrections, not on peaks.
When price falls into demand, it’s not fear — it’s opportunity.
Long trade
15min TF overview
Pair / Contract: MNQ1! (Micro E-mini Nasdaq-100 Index Futures)
Date: Mon 3 Nov 2025
Session: Tokyo Session → Pre-Asia to London Transition
Direction: Buy-side Trade
Timeframe: 15 minutes
🔹 Trade Details
Entry: 25 466.75
Take Profit (TP): 25 709.50 (+0.95 %)
Stop Loss (SL): 25 409.25 (–0.23 %)
Risk / Reward (RR): 3.14 R
🔹 Market Context
After a broad distribution → markdown sequence, price reached a high-volume imbalance zone near 24 900–25 000 — a previous accumulation base.
🧾The session opened with a liquidity sweep beneath prior low (24,875) → confirmed displacement above intraday structure.
🧾Multiple FVG patches stacked through 25 200–25 400 served as a refined entry trigger and confluence for continuation.
🧾Volume expansion into the retrace + KAMA flattening then uptick confirmed a shift in short-term bias to bullish.
🧾Target aligns with upper gap fill/supply zone ≈ 25 700 (level of previous imbalance).
🔹 Model Type
Accumulation → FVG Continuation Model
Displacement leg established structural BOS above 25,300.
Entry taken on retrace into discount FVG and breaker block confluence zone (25 460–25 420).
Price objective: recovery into the premium zone (gap-fill @ 25 700).
🔹 Execution Notes
Entry triggered after observing a clean MSB on the 5-minute chart, with confirmation of a candle close above KAMA. Stop set below FVG origin (25,409) to maintain a tight risk. Partial profits secured at 25,600 region before NY open volatility. Risk controlled with FVG-based entry for ~3 R return potential within the session window.
5min TF overview
🔹 Trade Narrative
This MNQ setup represents a reversal transition from a bearish liquidity flush into a controlled markup. The combination of volume absorption at the low, multiple FVG alignments, and a clear BOS confirm smart-money accumulation. With strong confluence from session timing and gap magnet at 25,700, this position targets a measured buyside retracement within a broader range-bound context.

NQ Short (forced trade)Well, this is a forced trade opp. It means that iam not very sure but i would take this opp anyways.
Here are my two cents. ES looks bullish to me, while NQ is bearish. Which is something odd.
Anyways, here is the trade. Be careful taking it with size, because iam very well could be wrong.
Good luck everyone!!

NQ - Week 46 (1hr chart)
T.A explained -
BackSide (BS)
FrontSide (FS)
Inverse BS (Inv.BS)
Inverse FS (Inv.FS)
BS & FS levels are expected support when dashed lines, tested when dotted and resistance when solid lines.
The inverse is true for the Inv. BS Inv. FS levels, they are resistance as dashed lines, tested as dotted and support as solid lines.
Monthly timeframe is color pink
weekly grey
daily is red
4hr is orange
1hr is yellow
15min is blue
5min is green if they are shown.
strength favors the higher timeframe.
2x dotted levels are origin levels where trends have or will originate. When trends break, price will target the origin of the trend. its math, when the trend breaks, the vertex breaks too so the higher timeframe level/trend that breaks, the more volatility there could be as strength in the orders flow in to fuel the move.
yesterday
Trade closed manually
price followed the candle science and timeframes from the 5min green levels to the weekly grey level. Price has left behind some inverse frontside and inverse backside candles which look to be forming the bridge to flip the script if price manages to gain those levels and start accumulation. That liquidity will "unlock" and fuel price action.

NQ - 15min chart T.A explained -
BackSide (BS)
FrontSide (FS)
Inverse BS (Inv.BS)
Inverse FS (Inv.FS)
BS & FS levels are expected support when dashed lines, tested when dotted and resistance when solid lines.
The inverse is true for the Inv. BS Inv. FS levels, they are resistance as dashed lines, tested as dotted and support as solid lines.
Monthly timeframe is color pink
weekly grey
daily is red
4hr is orange
1hr is yellow
15min is blue
5min is green if they are shown.
strength favors the higher timeframe.
2x dotted levels are origin levels where trends have or will originate. When trends break, price will target the origin of the trend. its math, when the trend breaks, the vertex breaks too so the higher timeframe level/trend that breaks, the more volatility there could be as strength in the orders flow in to fuel the move.

"It's Me Again, Margaret"Ajax, aka Monster Head & Shoulders, is back again. He has been dominating our charts since 9/16.
His neckline: 24680
Buy the Dip area 1: 24640 - 24570
Buy the Dip area 2: 24550 - 24500
Pullbacks are a normal part of bull markets. We are ~4% off the high. Correction territory is 10% or more. As Day Traders we welcome pullbacks as opportunities to trade the same Px zone at least one more time.
This one is due to the govt. shutdown and the resulting lack of economic data as well as the economic losses, profit taking after the Dow posted two all-time highs in a row, and concern about over valuation especially of tech stocks.
All a normal and healthy part of the markets.
One major attraction of the Nasdaq 100 to us as day traders are its big swings. It gives more opportunity for Px action and profits than the other markets.
He has a new Breakout Ladder set @ 24770. every 20 points he will buy 1 contract. Each and every target will be 19 points.
Above you can see the BTD areas. This neckline may turn out to be a good BTD area. I'd wait until at least 09:50 NY Time before placing a BTD trade above the green shaded BTD areas.
From 9/16 to the present this support zone has been a very important one. Let's see if it holds.

Market Maker Buy ModelMarket Maker Buy Model in the making for NQ:
- Weekly low triggered;
- Inversion FVG creation;
- Swing high broken;
- Targeting 0.705 of the Dealing Range;
- Entry at the highest FVG with Swing low for stop placement;
- Leap trade;

NQ1 - Bullish Whipsaw = Dip Buys In Choice StocksNasdaq just printed a big bullish whipsaw on the 4 hour chart to tap liquidity below support and rebound back up.
This is quite a significant bullish signal.
It is lower time frame so we will need to see it hold and it may chop around...
But in this area is where we're likely to see bullish recoveries and breakouts in choice stocks and even crypto 🧐.
