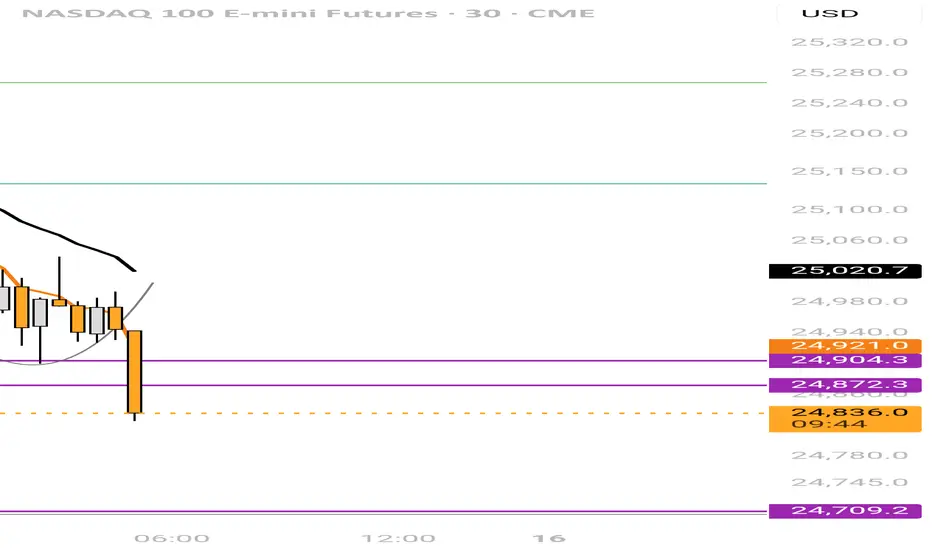
NQ - Week 46 (1hr chart)
T.A explained -
BackSide (BS)
FrontSide (FS)
Inverse BS (Inv.BS)
Inverse FS (Inv.FS)
BS & FS levels are expected support when dashed lines, tested when dotted and resistance when solid lines.
The inverse is true for the Inv. BS Inv. FS levels, they are resistance as dashed lines, tested as dotted and support as solid lines.
Monthly timeframe is color pink
weekly grey
daily is red
4hr is orange
1hr is yellow
15min is blue
5min is green if they are shown.
strength favors the higher timeframe.
2x dotted levels are origin levels where trends have or will originate. When trends break, price will target the origin of the trend. its math, when the trend breaks, the vertex breaks too so the higher timeframe level/trend that breaks, the more volatility there could be as strength in the orders flow in to fuel the move.
yesterday
Trade closed manually
price followed the candle science and timeframes from the 5min green levels to the weekly grey level. Price has left behind some inverse frontside and inverse backside candles which look to be forming the bridge to flip the script if price manages to gain those levels and start accumulation. That liquidity will "unlock" and fuel price action.
Trade ideas

"It's Me Again, Margaret"Ajax, aka Monster Head & Shoulders, is back again. He has been dominating our charts since 9/16.
His neckline: 24680
Buy the Dip area 1: 24640 - 24570
Buy the Dip area 2: 24550 - 24500
Pullbacks are a normal part of bull markets. We are ~4% off the high. Correction territory is 10% or more. As Day Traders we welcome pullbacks as opportunities to trade the same Px zone at least one more time.
This one is due to the govt. shutdown and the resulting lack of economic data as well as the economic losses, profit taking after the Dow posted two all-time highs in a row, and concern about over valuation especially of tech stocks.
All a normal and healthy part of the markets.
One major attraction of the Nasdaq 100 to us as day traders are its big swings. It gives more opportunity for Px action and profits than the other markets.
He has a new Breakout Ladder set @ 24770. every 20 points he will buy 1 contract. Each and every target will be 19 points.
Above you can see the BTD areas. This neckline may turn out to be a good BTD area. I'd wait until at least 09:50 NY Time before placing a BTD trade above the green shaded BTD areas.
From 9/16 to the present this support zone has been a very important one. Let's see if it holds.


Market Maker Buy ModelMarket Maker Buy Model in the making for NQ:
- Weekly low triggered;
- Inversion FVG creation;
- Swing high broken;
- Targeting 0.705 of the Dealing Range;
- Entry at the highest FVG with Swing low for stop placement;
- Leap trade;

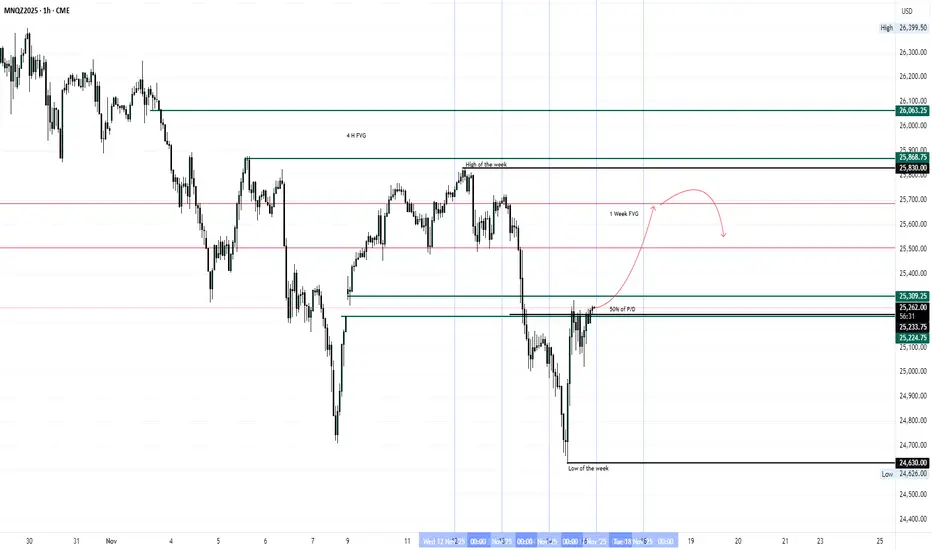
POSSIBLE FORECAST MNQZ2025 17-21 NOV 25 This week will probably have a very good opportunities 25700 and 25300 we have to see if it's possible to reach the high of the week 25900 search for the bullish scenarios
#202546 - priceactiontds - weekly update – nasdaq e-miniGood Evening and I hope you are well.
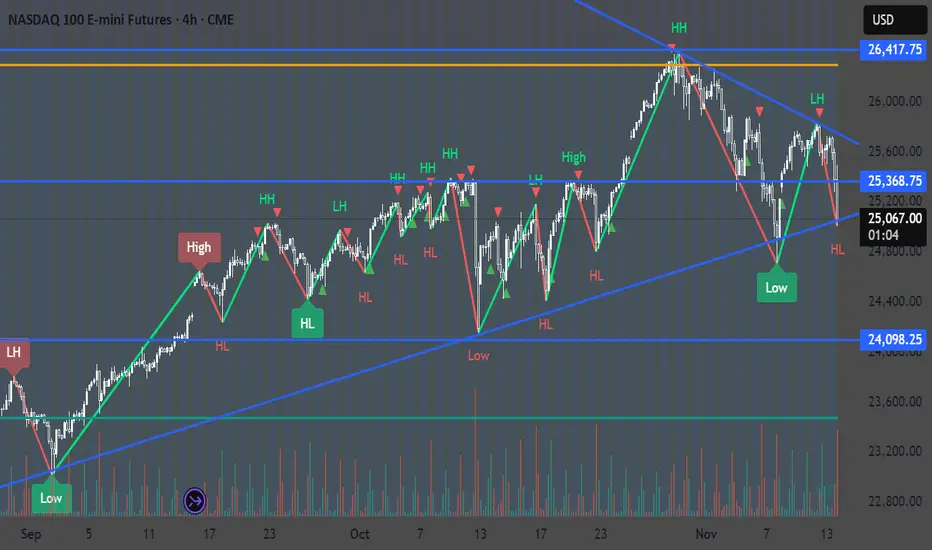
comment: Again, not much difference to dax. Also in a triangle and for now I highly doubt we will see a big range expansion out of 24600 - 25500. We had two weeks where the bears showed strength but what do they have to show for? We closed above 25000 in both weeks. That’s still as bullish as it gets. Only a bearish daily close below 24600 could change my outlook.
current market cycle: trading range 24000 - 26500 / 4h chart it’s a triangle 24700 - 25500
key levels for next week: 24500 - 25500
bull case: Bulls bought 24700 heavily again and closed the week above 25000. Bears can have no confidence in shorts when we rally for 667 points after a 1095 point drop. Problem for the bulls is that they also have to be very careful with buying high again since the downside can be huge. Which will likely mean that we won’t see much interest in buying above 25400ish. Even longing 25000 when we can drop down to 24600 or lower, is a tough trade.
Invalidation is below 24709.
bear case: Every dip is heavily bought. Has not changed. Can only become more bearish with a daily close below 24000 and that’s far. 25830 is likely the stop, most bears have to have for most shorts next week. That’s a big range and it any short below 25300 from being decent imo. We are making lower highs and lower lows but the lower lows just barely. Until that changes, we will most likely continue sideways in the given range.
Invalidation is above 25830.
short term: Neutral around 25000. Short closer to 25700 and longs closer to 25600.
medium-long term - Update from 2024-11-02: Market went further in the wrong direction so my targets become increasingly unrealistic. Right now the 50% retracement is 21750 and would mean a 18% drop. That’s a bit too much to ask for as of now. 24150 is the breakout-retest of the prior ath from 2024-12 and a more realistic target.

Weekly outlook on NQ, ES and Dow. Index Triad NYSEThis week will be a tricky one. I need more data to understand about the expansion on the weekly. We will take it on a day to day basis after each daily closures

possible bounce NQ from trendlineNQ is testing a 4h symmetrical traingle line sfp frome here might deliver a bounce or otherwise we go lower.
Nasdaq reqdy for new all time highsChart looks great .
I think there is another push to the upside .
Equities together with crypto will have another run.

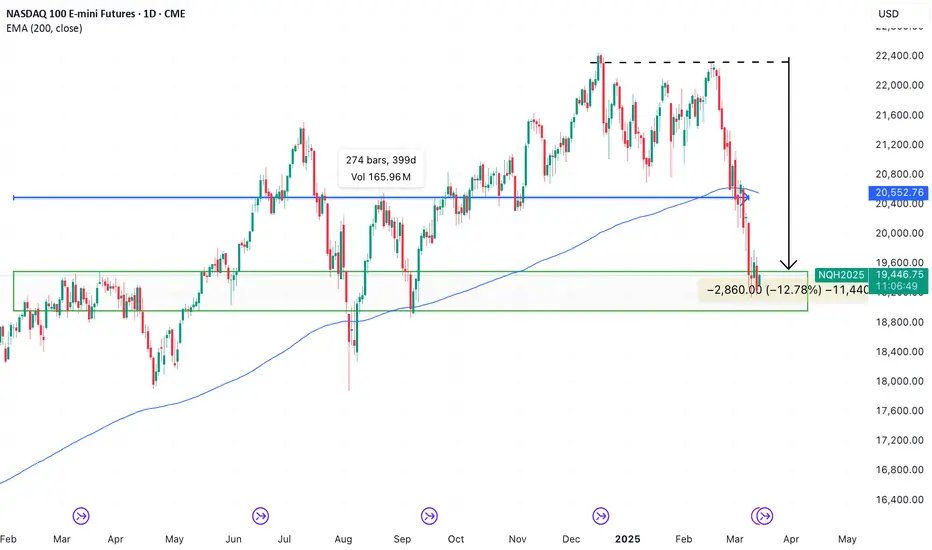
NASDAQ 100: Same Song, Different LyricsAfter a 12% pullback, NQ is retesting price levels from 400 days ago, and to many, it looks like a crash is coming. But what’s really driving the jitters?
1.Apple’s sales concerns & downgrades
2.Tariff fears (that haven’t even been imposed yet)
3.Doomsday takes on the U.S. economy
Sounds familiar? Same melody, just different words.
Yes, the stop is wide, but the profit target from here is at least 5X.
The question is—who sees an opportunity, and at what levels?
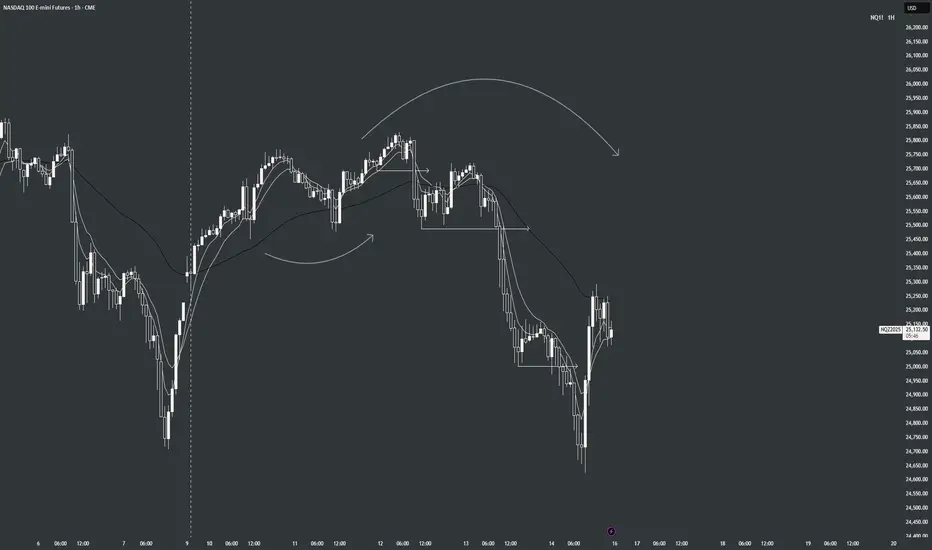
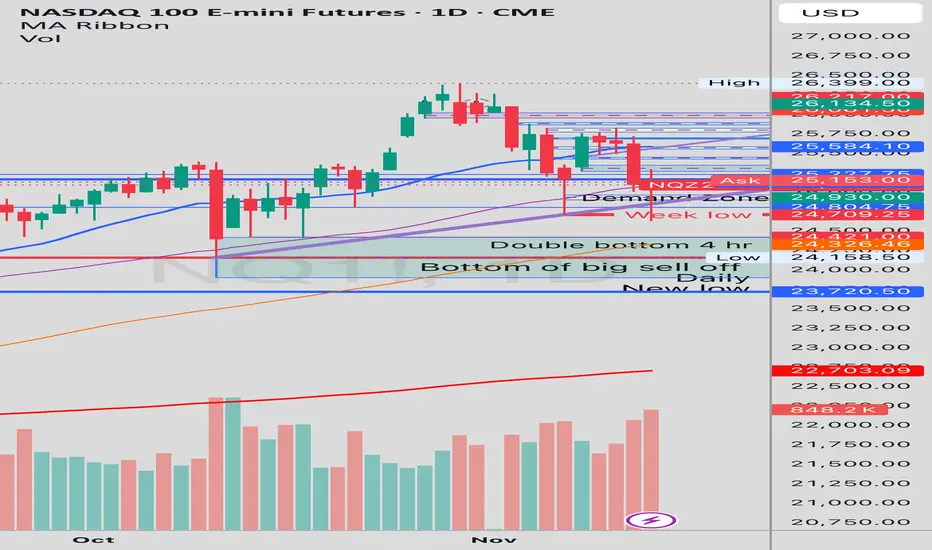
NQ Weekly Recap | November 10–14, 2025Method: I track impulse/correction and BOS (break of structure). Trend filter is the 50 EMA (black); momentum/trigger EMAs are the 5 & 10 (white).
Recap
Mon: Clear upside impulse with BOS up. White EMAs above the black 50 → bullish continuation vibe.
Tue: Early follow‑through, then momentum faded; corrections got deeper and EMAs started to flatten.
Wed: Failed attempts to hold above the white EMAs, then a clean BOS down as price slipped under the black 50 → trend flipped.
Thu: Follow‑through short. Lower highs into the white EMAs; corrections kept getting sold while staying below the black 50.
Fri: Flush then sharp bounce. Price reclaimed the white EMAs intraday but stalled around the black 50—looks corrective; no full BOS up yet.
Takeaways
Early week was bullish.
Midweek we failed below the EMAs and followed shorts.
The late‑week bounce is just a correction unless we get a fresh BOS up and hold above the EMAs with the black 50 turning back up.
NQ1 - Bullish Whipsaw = Dip Buys In Choice StocksNasdaq just printed a big bullish whipsaw on the 4 hour chart to tap liquidity below support and rebound back up.
This is quite a significant bullish signal.
It is lower time frame so we will need to see it hold and it may chop around...
But in this area is where we're likely to see bullish recoveries and breakouts in choice stocks and even crypto 🧐.

Liquidity Hunting On!A perfect drop post buy side Liquidity Hunting now going for the sell side Liquidity.
NQ to Retest low before going back up I have been watching trading NQ alot lately and here is my prediction for the next moves.


NQ Short opportunityBased on TA, i see a shortBased on the market structure, there are few unmitigated orders that are not filled which needs to be tapped into before covering the gap formed below. Daily TF, there is a WICK CE available to get retraced into

Bitcoin Is Crashing… Nasdaq Still at Highs. Who’s Lying?For years, Bitcoin and the Nasdaq 100 have shown consistently high correlation, driven by the same macro forces:
• global liquidity cycles,
• risk appetite,
• real-rate expectations,
• and flows into high-beta growth assets.
Both are classic risk-on instruments—they benefit when liquidity expands and suffer when uncertainty rises.
However, the chart above shows a significant decoupling over the past weeks:
🔻 BINANCE:BTCUSDT : Deep Correction & Negative YTD
• Down more than 25% from the highs
• Trading –5% YTD in USD terms
• Volatility expanding and long liquidations accelerating
• Risk sentiment turning sharply lower within crypto
🔺 LSE:NQ11 : Near All-Time Highs
• Still hovering close to ATH levels
• Posting +16% YTD in USD
• Supported by strong earnings, mega-cap tech flows, and continued growth leadership
⚠️ This divergence is unusual — and historically meaningful
BTC and Nasdaq rarely disconnect to this magnitude without one of two outcomes:
1️⃣ Bitcoin Is Leading the Next Risk-Off Move
Crypto often reacts faster to changes in liquidity conditions and risk appetite.
If this is another leading signal, equities (especially high-beta tech) may follow with a lag.
2️⃣ Correlation Break Is Temporary
If the move was primarily crypto-specific (liquidations, funding resets, derivatives unwinds),
BTC could mean-revert upward as flows stabilize.
📌 Our View
Historically, when divergences of this scale have appeared:
Bitcoin leads, equities follow.
The magnitude of BTC’s correction vs the Nasdaq’s resilience suggests that:
👉 BTC may be pricing in a shift in risk conditions ahead of equities, not the opposite.
The key question for the next weeks:
Is the Nasdaq ignoring a message that crypto is already discounting?

Would you consider this a H&S break on NQ?Would you consider this a H&S break?
I know things are volitile and wierd right now...which makes me think that this could be a weird looking H&S. Remember, the patterns show us an idea, a story. Does this tell the story to you? It shows what an H&S shows. It is just sloppy because of volitile movements...
NQ1Here is a couple of possibilities: If we can bounce here at the diagonal green line then it will be making a higher low to continue the uptrend.
However, the green horizontal line is the neck line @ 24,119 for a possible head and shoulders pattern or a double bottom...either way it should bounce there... but we will have to wait for pattern development.

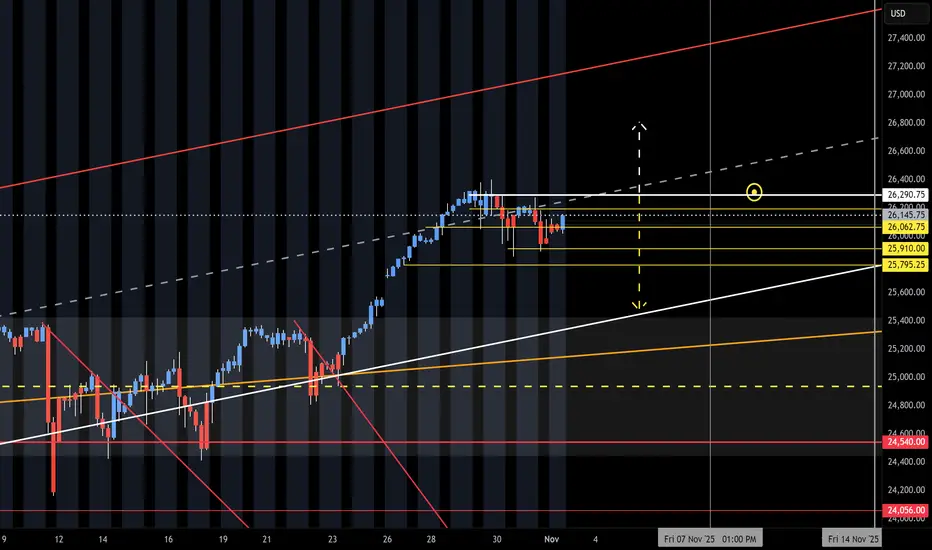
NQ Range (11-03-25, Week 6)The F-M Long move is on with new month and O/N Gap Open UP. Curveball form Friday Close and late head fake. Again, the NAZ will have to use the O/N to lift it back up. Need to see how the Open Drive and Reg Session reacts to the low volume O/N lift. Run up to upper target above KL 26,290 and Short on reject of. Under 290 is a potential drop to 25k or 25,550.
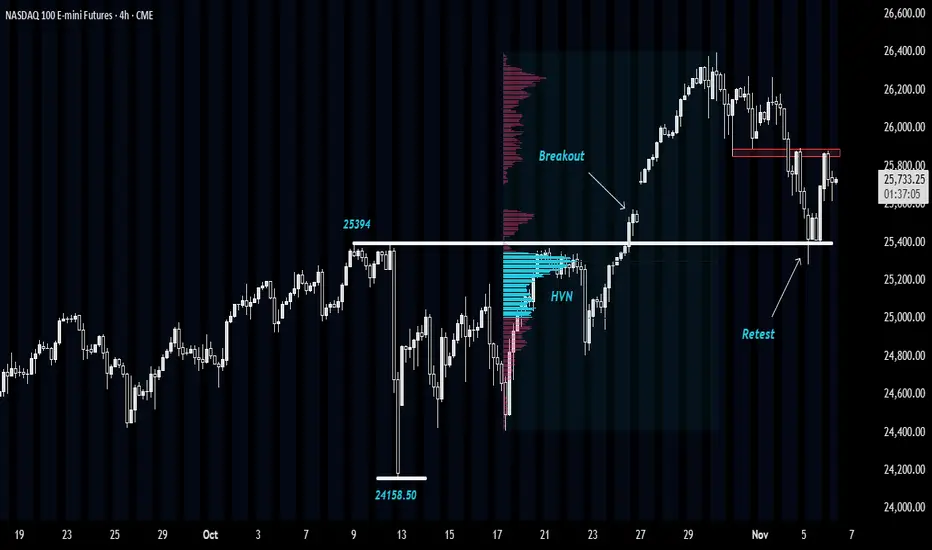
NASDAQ: Retesting Breakout ZoneThis idea is based upon successful Breakout Retest scenario near a High-Volume Node (HVN).
Let's first get to the basics:
A successful Breakout Retest -
A breakout retest scenario occurs when the price breaks through a key level of support or resistance and then returns to test that same level before continuing in the breakout direction.
For example, if the price breaks above a resistance zone, traders wait to see if the price comes back down to that zone. If it holds as new support and shows rejection candles or strong buying, that’s called a successful retest.
At a successful retest, several things typically happen:
➡The old resistance acts as new support (or vice versa in case of breakdown).
➡Traders who missed the initial breakout enter the trade, adding momentum.
➡Weak hands or short-term traders exit, cleaning up the order flow.
➡The price often accelerates in the direction of the breakout with stronger conviction and volume.
In simple terms, a successful retest confirms that the breakout was genuine and not a false move.
High Volume Node -
HVN is a price level or zone on a volume profile where a large amount of trading activity has occurred. It represents an area where buyers and sellers actively agreed on price, leading to high transaction volume.
These zones usually act as balance areas- price tends to pause, consolidate, or even reverse near them because many traders have open positions there. When price revisits an HVN, it often encounters strong support or resistance, as market participants react to protect or exit their earlier trades.
In short, an HVN marks a fair value area on the chart where market consensus was strongest.
NASDAQ Analysis -
In the Nasdaq E-mini chart, we can observe a sharp decline from 25,394 to 24,158, but without any meaningful follow-through on the downside.
Subsequently, the price reacted once again from this same zone on 21st and 22nd October, before eventually breaking above 25,394 with strong momentum to form new highs.
At present, the market has pulled back to the 25,394 level, which previously acted as resistance. This area is now holding as support, suggesting a successful retest and presenting a potential buying opportunity.
Moreover, this retest is aligning with a HVN around 25,300, further reinforcing the support zone.
In the short term, the price is facing resistance near 25,900. A conservative long entry could be considered after a sustained move above 25,900, while an aggressive low-risk entry could be initiated around 25,500, closer to support.
📣Disclaimer:
Everything shared here is meant for education and general awareness only. It’s not financial advice, nor a recommendation to buy, sell, or hold any asset. Do your own research, manage your risk, and make sure you understand what you’re getting into.
FVG & ORB5-Minute ORB + FVG Day-Trading Playbook (ES/NQ)
What you need
Platform: TradingView for markup; your execution platform (e.g., TopstepX / your broker) for orders.
Chart: ES (S&P 500 futures) or NQ (Nasdaq futures). Timeframe: 5 minutes.
Indicators:
Volume
Fair Value Gap
Key Levels (15-Min/5-Min Opening Range, New York Session or London)
Chicago time (your local): NY cash open is 8:30 a.m. CT. The “US evening reopen” (the Globex reopen) is 5:00 p.m. CT (use with caution; liquidity can be thin).
The strategy in one page
1) Define the Opening Range
Use the first 5-minute bar after the NY cash open (8:30:00–8:34:59 CT).
Mark ORH = that bar’s high, ORL = that bar’s low.
2) Direction filter = FVG
Bearish setup: Price breaks below ORL, and there is a bearish FVG nearby that has not been fully filled.
Bullish setup: Price breaks above ORH, and there is a bullish FVG nearby that has not been fully filled.
If an FVG fills/invalidates immediately after the break, skip the trade.
3) Entry
Enter on the break (or on a tiny retrace back to the level) in the FVG direction:
Below ORL with a short bias when a bearish FVG stands.
Above ORH with a long bias when a bullish FVG stands.
4) Stop & Target (bracket)
Stop: default at the opposite OR level (conservative).
Short below ORL → stop just above ORL (or the nearest invalidation level if tighter is justified).
Long above ORH → stop just below ORH.
Target: aim for 2R (risk:reward = 1:2), close above half, and trail the rest.
Example: If your stop is 10 ES points (=$500 per contract), target 20 ES points (=$1,000 per contract).
5) Risk per trade
Pick a fixed dollar risk that protects your account limits. With a $50k evaluation & ~$2,000 trailing max loss, many traders use $100–$300 per trade and micros (MES/MNQ) to scale precisely.
Contract & tick quick-ref
ES: 1 point = $50 (tick = 0.25, $12.50/tick)
NQ: 1 point = $20 (tick = 0.25, $5/tick)
MES (micro ES): 1 point = $5
MNQ (micro NQ): 1 point = $2
Sizing example, with MES (conservative)
You want a max loss of $200~300.
Signal requires 4 ES points to stop (=$200/contract).
Trade 1 ES or 4 MES (same risk), target 8 ES points for 2R.
Exact checklist (print this)
Pre-market
Chart on 5m, session = New York.
Mark ORH / ORL after the first 5-min bar closes.
Confirm bias by FVG: bullish FVG above / bearish FVG below, still unfilled.
News/Volatility check (FOMC/CPIs/major earnings): be extra cautious or skip.
Entry
Price breaks ORH/ORL in the same direction as the FVG.
No immediate fulfillment of that FVG.
Place bracket: Stop at opposite OR level (or clear invalidation), Target = 2R.
Manage
Set-and-forget if you struggle with tinkering.
If it snaps back and fully fills the FVG, early flattening is allowed by your rules (consistency > perfection).
No averaging losers.
Post-trade
Journal the screenshot, OR values, FVG state, R multiple, and any deviation from the plan.
When to skip
The first break immediately reverses and fully fills the FVG.
The OR is abnormally wide; the stop would exceed your risk budget.
Chop: multiple whipsaws through ORH/ORL within a few bars.
Event risk minutes away (e.g., CPI/FOMC); spreads/volatility unpredictable.
Low volume conditions (late sessions, holidays), unless your data says you have an edge there.
A realistic take on funded accounts & pacing
Evaluations often have daily loss, trailing drawdown, and max position rules. Treat the trailing specifically as if it’s glued to your closed PnL high-water mark—don’t let one impulsive add blow the account.
Keep resets rare by capping loss/day (e.g., 1–2R). One clean 2R win can offset two 1R losses.
Micros let you keep your exact dollar risk steady as the OR width changes day to day.
Routines that help
Two windows: TradingView (markup) and Execution DOM/ladder. Copy ORH/ORL and draw a rectangle for the FVG if your execution platform lacks the indicator.
Auto-brackets: pre-define your $ risk and 2R target so every entry is consistent.
Two sessions max: NY opens first; optionally, the US evening reopens (5:00 p.m. CT) only if your data says you have positive expectancy there.
Trade less, filter more: It’s normal to get 2–3 quality trades/week. No setup → no trade.
A compact rules card (copy/paste)
Timeframe: 5m. Levels: First 5-min bar → ORH/ORL.
Filter: Trade only with an unfilled FVG in the same direction as the OR break.
Entry: Break of ORH (long) or ORL (short).
Invalidation: FVG fully filled right after break → stand down/exit.
Stop: Opposite OR level (or nearest structure that truly invalidates).
Target: 2R.
Risk: Fixed $ per trade; use micros to fit the plan.
Daily max: 1–2R down → stop for the day.
Journal every trade (screenshot + R result + notes).
Journal template (quick)
Date / Ticker / Session (NY/Evening)
ORH / ORL values; OR width (points)
FVG direction & location (filled? unfilled?)
Entry price & rationale (break + FVG alignment)
Stop (points/$), Target (points/$), Size (contracts)
Outcome (R): __
Did I follow the plan? Y/N (what deviated?)
Screenshot link
Guardrails (important)
“Making money in days” is possible but not typical; survivorship bias is real. Your edge is strict filtering + small, repeatable risk + patience.
Commissions/slippage matter—micros help sizing but raise the per-rake cost %; include this in your journaling.
Don’t scale to full contracts until your live track record shows consistency over at least 20–30 trades following the exact rules.
Screener:
www.tradingview.com

Elliott Wave Analysis of Nasdaq (NQ) Forecasts New All Time HighThe bullish cycle in the Nasdaq (NQ) that commenced from the April 2025 low remains underway, unfolding as an impulsive Elliott Wave structure. Within this broader advance, wave (3) of the eight-month rally concluded at 26,399. The subsequent corrective phase, wave (4), developed as a double three structure. This is an Elliott Wave pattern characterized by a combination of corrective sequences.
From the peak of wave (3), wave ((a)) declined to 25,853, followed by a rebound in wave ((b)) that reached 26,274. The final leg of the correction, wave ((c)), extended lower to 25,282, thereby completing wave W of a higher degree. A subsequent rally in wave X peaked at 25,880 before the index turned lower once more in wave Y, which has taken the form of a zigzag.
Within wave Y, wave ((a)) declined to 25,162, followed by a corrective bounce in wave ((b)) to 25,354.75. The final leg, wave ((c)), dropped to 24,707.1, marking the completion of wave Y of (4). From this low, the index has resumed its upward trajectory in wave (5). Advancing from wave (4), wave ((i)) topped at 25,768.75, and the pullback in wave ((ii)) found support at 25,478.50. Provided the pivot at 24,707.1 remains intact, the near-term outlook favors further upside continuation in wave (5)
