NQ Range (12-01-25)NAZ lower in O/N and inside wide Churn Zone, look Long above 25339 and Short below 25,125. May see opposite direction trades at these levels and some sideways churn until breakout. Look at 1,000 point range of 25,910 - 24,910 as a wider CZ range.
NASDAQ 100 E-mini Futures
No trades
Trade ideas

NQ1 - DAY TRDERS OUTLOOK GUIDE FOR 202-12-02Good Morning,
I hope all is well. I always trade with the overall market trend. Here is my guide for the day.
Likely Scenarios for Today
Scenario A – Most Probable (≈60%): Bullish Grind with Pullbacks
Price dips into 25,350–25,300, finds buyers at the EMAs.
Momentum rebuilds.
Slow grind upward toward 25,600 retest.
You will see:
MACD curling upward
DI+ widening over DI-
ADX flat or slightly rising
Best play: Buy the pullback into hourly support.
Scenario B – Rejection and Deeper Pullback (≈30%)
If price loses 25,300, the market likely accelerates downward into:
25,150 (trend-support reset)
Possibly 25,000 liquidation sweep
The indicators would show:
MACD bear cross
DI- crossing above DI+
Oscillators breaking below midline
This would be the only bearish scenario worth taking seriously.
Scenario C – Immediate Breakout (≈10%)
Price surges through 25,600 early in the session and runs momentum into:
25,720
25,850 as the extension
But volume suggests this is less likely unless macro news triggers it.
Today’s Bias Summary
Trend: Bullish
Momentum: Cooling
ADX: Weak trend
Structure: Rising into overhead supply
Key battleground: 25,350 support vs 25,600 resistance
Bias:
Bullish continuation IF 25,300 holds.
Bearish flush IF 25,300 fails.
Hope you Enjoy!

NASDAQ ANALYSIS ON 30 MIN CHART Long & Short analysis on nasdaq based purely on high-probability zones. i trade from zones only—because when price enters a valid zone, a move is expected. these zones are not session or time dependent. execution, risk management, and psychology decide how much you extract from that move. analysis alone never guarantees profits. discipline does.
trade smart. manage risk. stay consistent.
happy trading.
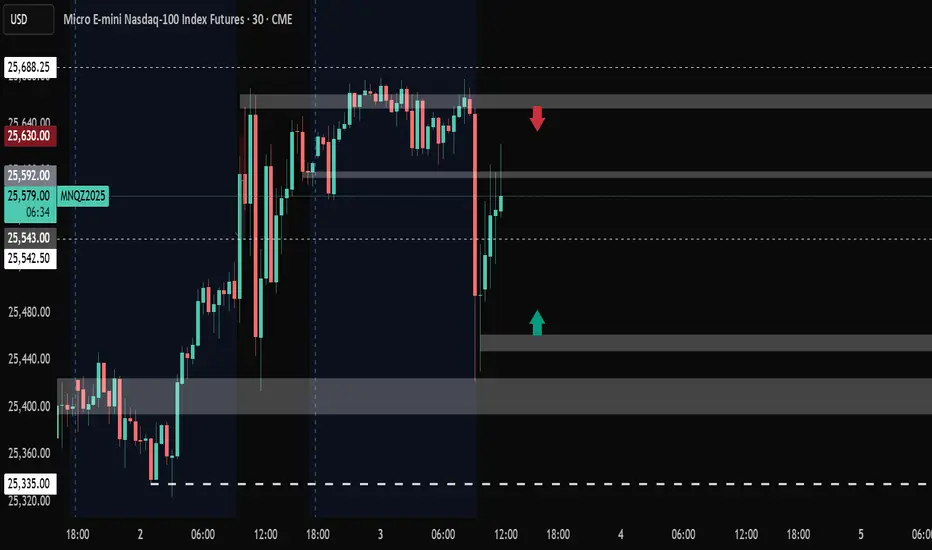
Location 30m NY Session 1 Dec 2025There are 3 setups based on a 30 minute structure on 1st December 2025.
Location 1 :
- Structure breakout buy
Location 2 :
- Structure breakout buy
Location 3 :
- Structure breakout buy

NQ UpdateLooks like it's still melting up, though it's a slow melt up.
Probably not gonna trade today.

NQ1 - Holding... Santa Rally Incoming?NQ1 Indices1
Still looking dangerous in the short term having printed a quick slump through resistance.
But its holding here and perhaps it can continue up from here.
If it was going to collapse then we might see plenty of leading slumps in stocks.
And we are seeing slump action in crypto and crypto stocks, but most stocks that I cover are looking positive and pushing up as we enter December.
Could a Santa Rally be on 🤨🎅.

NASDAQ - The Good The Bad The UglyGood Afternoon Everyone,
I hope all is well. I have for you a 3 set analysis on what we can expect from the markets this week. Nasdaq TA completed on Weekly, Daily & 1Hour Time Frames.
WEEKLY TREND (Dominant Macro Structure)
Status: Long-term bullish
Signals:
Price inside a multi-month bull channel
Slight channel edge break, but no reversal
Momentum slowing → consolidation expected
Weekly support zones are strong
Weekly takeaway:
The long-term trend is bullish, but entering a cooling/consolidation phase.
Weekly = macro anchor. It strongly biases the market upward over time.
DAILY TREND (Intermediate Structure)
Status: Mixed / Transitioning
Signals:
Price broke down from daily bull channel
Attempted to re-enter → rejected
Sitting between the 50 EMA and 200 EMA
Daily support zones are key
Daily candles show indecision
Daily takeaway:
Trend is no longer strongly bullish. A corrective process or deeper retest is likely before continuation.
Daily = controls medium-term direction and determines where the weekly trend re-engages.
1-HOUR TREND (Short-Term Structure)
Status: Short-term bullish
Signals:
Price broke out of short-term bearish channel
Formed a new, tight bullish channel
Recently rejected at underside of long-term weekly channel
Short-term support forming
Price above 50 EMA & 200 EMA intraday
1H takeaway:
Short-term momentum is bullish, but rejected at major higher-timeframe resistance. Needs support to hold.
1-hour = entry timeframe and shows how the daily trend is forming in real time.
COMBINED MULTI-SCENARIO OUTLOOK
Below are the 3 most realistic combined scenarios using all three timeframes together.
They are ranked from most likely → least likely.
SCENARIO 1 — Controlled Pullback → Higher Low → Trend Resumes Upward
Probability: ★★★★☆ (60–65%) → Most Likely
How This Unfolds (Multi-Timeframe Logic)
Weekly:
Staying bullish but consolidating
Weekly support will eventually absorb selling
Daily:
Mixed trend resolves with a higher low above major support
50 EMA or support #1 holds
1-Hour:
Pullback into short-term support
Bounce signals bullish continuation
Price Path:
1-hour pulls back to support
Daily prints a higher low
Weekly resumes its upward grind
Price re-attempts to re-enter/top the long-term bull channel
This scenario is ideal for:
Swing longs
Daily HL entries
1-hour EMA bounce setups
Continuation plays into the top of the long-term channel
Why most likely?
Because every timeframe except the 1H is cooling, not reversing.
SCENARIO 2 — Deeper Correction Into Major Support → Then Strong Bounce
Probability: ★★★☆☆ (30–35%)
This is your deeper pullback scenario but still bullish long-term.
How It Unfolds (Multi-Timeframe Logic)
Weekly:
Sideways consolidation expands lower
Price moves toward deeper weekly support zone
Daily:
Daily loses the 50 EMA
Price moves toward the 200 EMA
This forms a deeper corrective wave
1-Hour:
Short-term bull channel breaks
Price trends downward intraday
1H shows lower lows until 200 EMA daily zone is reached
Price Path:
1H breakdown → pullback
Daily breaks support #1, moves to support #2
Strong bounce at daily 200 EMA
Weekly trend reasserts → new multi-week rally
This scenario is ideal for:
Buying the daily 200 EMA
Position trades
Mean-reversion long setups
Why it happens?
Because daily trend has weakened AND weekly momentum is slowing — deeper retests are common.
SCENARIO 3 — Breakdown of Daily & Weekly Supports (Full Trend Reversal)
Probability: ★☆☆☆☆ (5–10%) → Least Likely
This would require multiple failures across all timeframes.
How It Unfolds (Multi-Timeframe Logic)
Weekly:
Both long-term support zones break
Weekly closes below the bull channel
Daily:
Price loses both support levels
200 EMA fails
Lower highs and lower lows form
1-Hour:
Sustained intraday lower lows
Bearish channel resumes
No re-entry attempts succeed
Price Path:
1H → breakdown
Daily → breakdown
Weekly → full structural reversal
Why unlikely?
No topping pattern on weekly
Macro trend remains bullish
Daily structure is corrective, not reversal-based
Buyers have not shown exhaustion at any major swing level
I hope you found this useful! Enjoy your week!

This is Monday we'll look at shorter contractsTake a look at the patterns on smaller contracts of gold silver and there was an oil market that we didn't get to see because I didn't know how to push the buttons and there's another market as well that we talked about all of them less risky but rest good return but not you know they you don't if you start trading these markets you have to trade the smaller contracts and then you get a feel.

possible bounce NQ from trendlineNQ is testing a 4h symmetrical traingle line sfp frome here might deliver a bounce or otherwise we go lower.
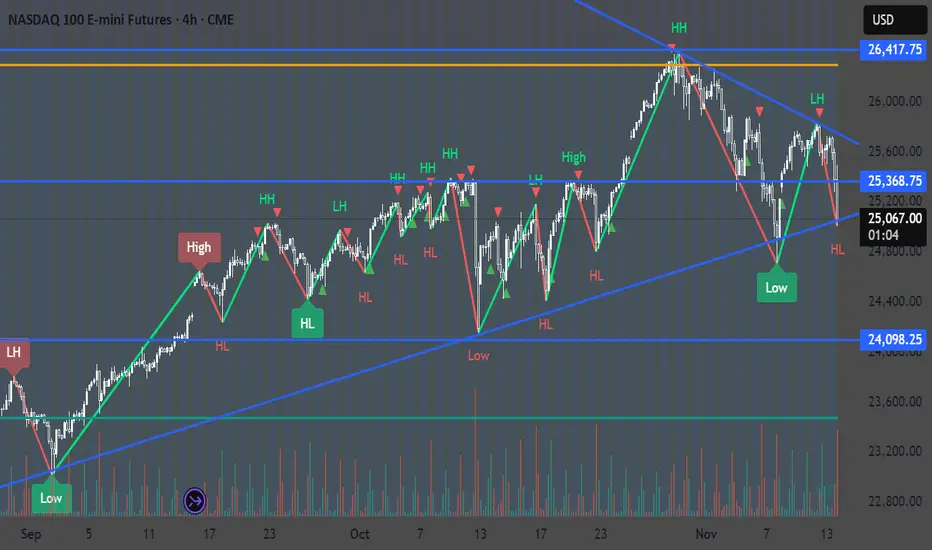
NQ Week 48 T.A explained -
BackSide (BS)
FrontSide (FS)
Inverse BS (Inv.BS)
Inverse FS (Inv.FS)
BS & FS levels are expected support when dashed lines, tested when dotted and resistance when solid lines.
The inverse is true for the Inv. BS Inv. FS levels, they are resistance as dashed lines, tested as dotted and support as solid lines.
Monthly timeframe is color pink
weekly grey
daily is red
4hr is orange
1hr is yellow
15min is blue
5min is green if they are shown.
strength favors the higher timeframe.
2x dotted levels are origin levels where trends have or will originate. When trends break, price will target the origin of the trend. its math, when the trend breaks, the vertex breaks too so the higher timeframe level/trend that breaks, the more volatility there could be as strength in the orders flow in to fuel the move.

Possibly Bearish Nasdaq has push above a major zone this weekend and currently at the neckline of that 4HR H&S so if price fall back below that major zone I can see sellers come into play and push it lower.

NQ UpdateOdd that MFI went up on no movement
At this point, I'm mostly cash. My favorite long play was GM calls, and that looks topped out.
Not sure about NQ, but I think ES will double top, so no put options for now. I did think about buying GM puts but decided not to.
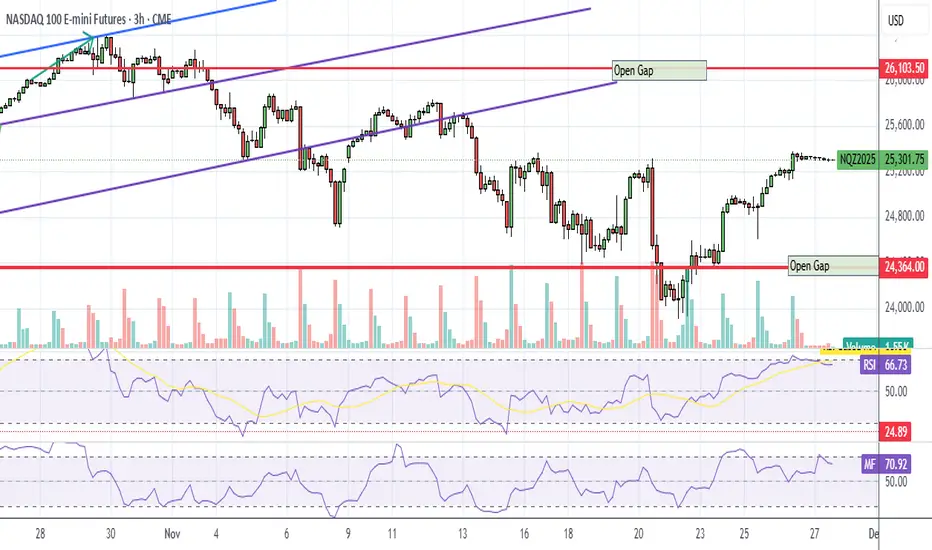
Thanksgiving NQ LevelsNasdaq-100 E-mini futures are trading near 25,318 this morning, showing a modest rise driven by growing optimism about a potential Federal Reserve rate cut in December. This momentum follows renewed strength in major tech names—especially AI-linked stocks—which has helped lift the broader Nasdaq Composite over the past several sessions. With expectations of lower rates, dovish Fed signals, and improving confidence in growth and tech sectors, the near-term outlook points toward continued upside or steady consolidation at current levels. However, gains may be capped if enthusiasm around AI fades or if upcoming economic data weakens the argument for rate easing.
Happy Thanksgiving to you all
Gobble, gobble!!
FVG Reversal Play – NASDAQ 100 Futures [NQ1!]CME_MINI:NQ1! FVG Reversal Play – NASDAQ 100 Futures
Signal: 🟢 BUY
Entry: 25,106.00TP1: 25,327.75TP2: 25,376.00TP3: 25,500.00SL: 24,924.50
Insights:
Price retraced into a Fair Value Gap (FVG) and sits near the 0.618–0.705 Fibonacci cluster, aligning with high-volume nodes on VRVP.
RSI is recovering from oversold territory, MACD histogram shows bullish divergence, and price is near the 200 MA support zone.
Strong confluence across all indicators suggests a potential bullish reversal from a liquidity sweep zone.
🌟 Trade Like Hunter (for professional edge)
✅ High-Probability Setup:
VRVP shows volume concentration at entry zone
MA acts as dynamic support
RSI and MACD signal bullish momentum shift
📊 Risk-Reward Ratio:
R:R ≈ 2.5:1 (TP2), up to 3.5:1 (TP3)
🔑 Liquidity Zone Confirmation:
Entry aligns with imbalance zone and previous demand sweep
🧠 Market Psychology:
Signs of accumulation post-selloff; potential breakout momentum building
⚡ Probability Score:
80% High Probability
📈 Scalability:
Setup aligns with 1H and Daily timeframes for broader confirmation
🔒 Risk Disclaimer:Always use proper risk management. Past performance does not guarantee future results. Trade responsibly.
@LunaGoldHunter
Calling Santa´s rallyyeap lets ask the Lord and Santa to take us to paradise,
olympus, or any heaven u wish ASAP.
nothing else
Merry Chrismas to Everybody even hades thinkers ;)

NQ UpdateORCL earnings caused a drop AH, NQ has been going sideways for a week and a half now, lol.
Can't make any money when it's going sideways, find something else...

NQNice retracement from todays FOMC. Going to look for longs once we take out some liquidity to continue to the upside

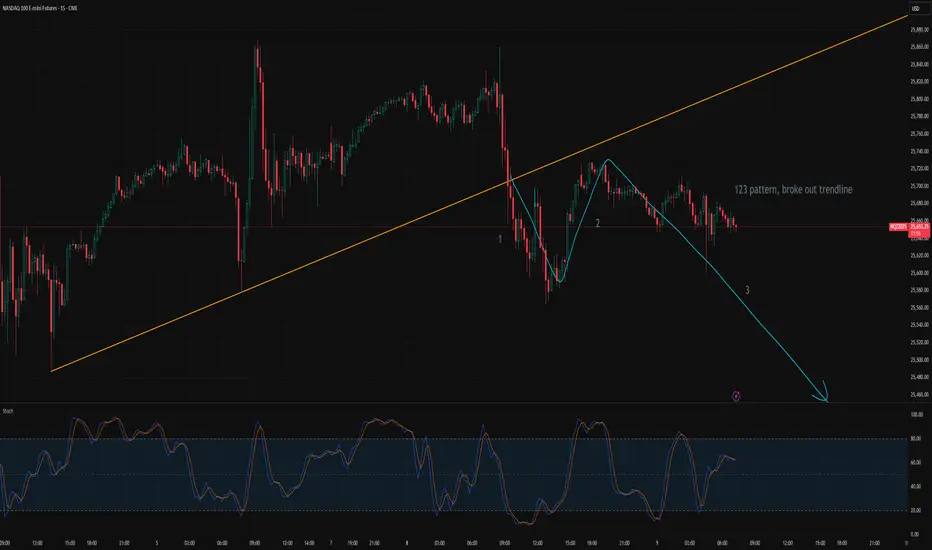
Trendline Break and Weak Retest Hint at Deeper PullbackI believe the market is currently forming a classic 1-2-3 pattern along the trendline. The price has already broken below the rising trendline, and the subsequent pullback failed to reclaim the previous high, which strengthens the bearish signal. If this structure continues to play out, the next step will likely be a clean break of the neckline, confirming a potential trend reversal. After the neckline is breached, the market may experience a short period of consolidation or a multi-day pullback before choosing its next direction.
ICT liquidity sweep entry on fvgPrice swept highs and had a market structure shift and may go to internal liquidity

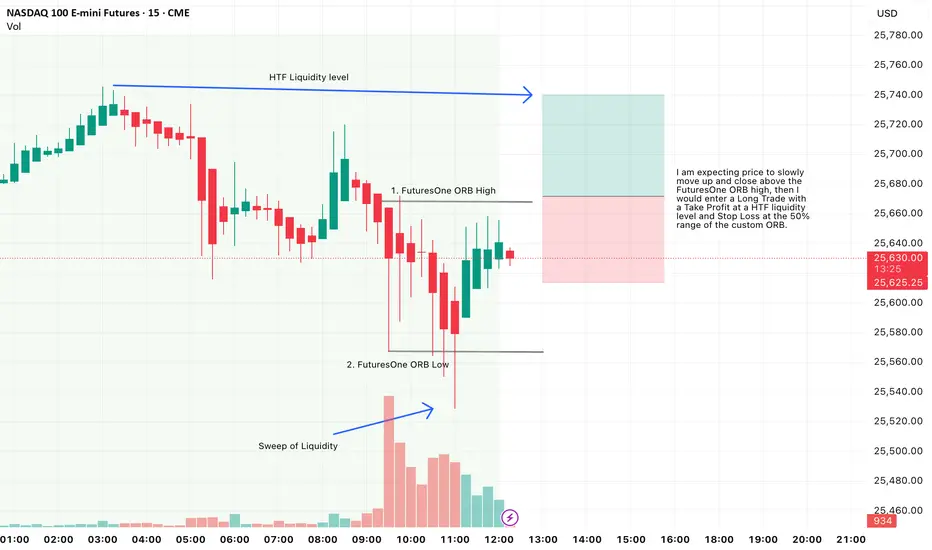
NQ1 Long, Using FuturesOne ORB System for HTF Bias & EntryFor this setup, I am expecting price to slowly move up and close above the FuturesOne ORB high, then I would enter a Long Trade with a Take Profit at a HTF liquidity level and Stop Loss at the 50% range of the custom ORB.

Algo's Logic: Why price moves ''crazy'' with red folder news?WHY PRICE MOVES LIKE THIS
The market is not a chaotic auction of buyers and sellers seeking fair value; it is a highly engineered delivery system designed to seek and destroy liquidity. The current consolidation you see is not indecision; it is a 'Liquidity Coil'. The algorithm is purposefully compressing price action ahead of the 'Red Folder' events to engineer a 'Straddle Inducement'.
By keeping the range tight, the Interbank Price Delivery Algorithm (IPDA) encourages retail traders to place tight buy-stops above the range and tight sell-stops below it. This creates two massive pools of liquidity—fuel for the machine. The news event is not the cause of the move; it is the 'Key' that unlocks this volatility. The initial move is almost always a 'Judas Swing'—a fraudulent manipulation designed to trigger one side of these stops (usually the sell-stops below) to harvest the necessary liquidity to fuel the *real* move in the opposite direction. We do not trade the news; we trade the algorithmic reaction to the liquidity harvest.
THE THESIS
The algorithm is currently in a 'Suspended State' of pre-event accumulation utilizing the impending volatility of the Macro Data Injection to engineer a classic 'Judas Swing' manipulation. The narrative is strictly governed by the 'Seek and Destroy' protocol: The market will utilize the news release to aggressively harvest the internal Sell-Side Liquidity (SSL) resting below the 25,550.00 shelf to fuel the terminal expansion towards the external Buy-Side Liquidity (BSL) at 25,900.00.
THE EXECUTION VECTOR
Entry: 25,525.00 (Buy Limit / Post-News Reclaim)
Stop loss: 25,380.00 (145.00 points)
Take profit: 25,950.00 (425.00 points)
Risk to reward ratio: 2.93R
THE CAUSAL RATIONALE
The Pre-News Narrative (The Trap)
Current price action (25,650.00) is a 'Volatility Compression' zone. The algorithm is holding price in a narrow range. Do not trade the drift. The drift is the bait. The algorithm is waiting for the 08:30 AM / 10:00 AM timestamp to unlock the high-velocity engine. The 'Red Folders' are simply the authorized time windows for the Market Makers to reprice the asset.
The News Event (The Judas Swing)
Upon the data release, expect an immediate, violent displacement. The highest probability vector is a 'False Bearish Breakout' (The Judas Goat). The algorithm will likely spike price DOWN into the 25,550.00 - 25,500.00 region. This serves two purposes:
1. Trigger the sell-stops of the overnight longs.
2. Induce breakout sellers to provide the necessary Buy-Side liquidity for the Smart Money to fill their long orders at a discount.
The Post-News Expansion (The Real Move)
Once the SSL is harvested and the 25,500.00 region (Bullish Order Block / FVG) is mitigated, look for an impulsive reclaim of the 25,600.00 level. This 'Sponsorship' signal confirms that the low is in, and the algorithm will switch to a 'Low Resistance Liquidity Run' targeting the clean highs at 25,900.00.
THE INVALIDATION (THE OMEGA POINT)
The bullish news model is ontologically corrupted if the news candle displaces below 25,380.00 and *sustains* acceptance there (15-minute close). A simple wick is not invalidation; it is a feature. But a closure below this level implies the macro data has triggered a 'Risk-Off' regime shift, targeting deeper discount arrays at 25,000.00.
KEY TRAJECTORY WAYPOINTS
Target 1: 25,750.00 | Type: Equilibrium / Initial Rebound | Probability: 90%
Target 2: 25,900.00 | Type: External Buy-Side Liquidity | Probability: 75%
Target 3: 26,100.00 | Type: Blue Sky Expansion | Probability: 40%
THE SHADOW REALITY
A 30% probability exists for the 'Bull Trap' scenario. In this reality, the news spikes price UP first into 25,850.00. If the first move is UP, fade it. The algorithm rarely gives the true move first during high-impact news.
All-In-One Magnificent 7 — Market Strength Engine NQThe All-In-One Magnificent 7 indicator converts the combined percentage performance of AAPL, MSFT, AMZN, NVDA, TSLA, META, and GOOGL into a single market-strength signal.
It displays the composite trend, moving-average direction, acceleration icons, significant change markers, and bullish/bearish bias zones — giving a real-time read on mega-cap leadership.
This tool helps confirm directional bias for ES/MES, NQ/MNQ, SPX/QQQ, and intraday trades by showing whether the Magnificent 7 are strengthening, weakening, or accelerating.
Ideal for futures traders, options traders, and anyone using market breadth for confirmation.
This is for educational purposes only. Not financial advice.
