NQ Short setup on 1HR Bearish DivergenceNQ Short setup on 1HR Bearish Divergence
Entry: 25447
SL: 25835
TP: 24282
RR: 1:3
NASDAQ 100 E-mini Futures
No trades
Trade ideas

1:11 Trade idea;Nasdaq
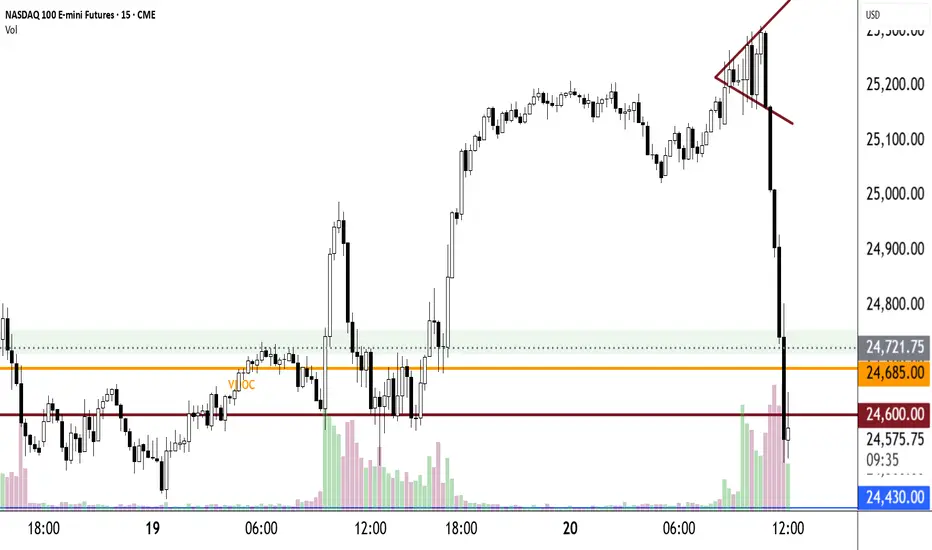
A good zone for big trades
Its an instituional level, a lot of agressive buyers

Caution FormationAny reverse formation shouts "Caution!" Turn this pattern around and you have a Symmetrical Triangle which is a consolidation pattern and typically indicates continuation of the trend. It would also be a price coil. This Reverse Symmetrical Triangle is a price expansion. Whenever you see this reverse pattern think Caution.
Right now, 12:05, we have a very high probability win rate BTD trade forming, an Exhaustion Candle immediately followed by a White Bull @ strong near the prior day's close.
Some days require two charts. Today is one of them
.5% risk after taking a loss yesterdaySeeing which PD arrays were being respected and it was the bullish ones, looks like a 1H PO3 coming on now at 10am however.

"Traffic"Stereophonics 1997
Daily Grind
Congestion
Setup
1. many supports & resistances
2. much swirling market moving news
3. strong fundamentals
4. historical bull market
5. strong resistance @ 25000 = a very round number
6. jobless data out soon
7. 4.2% est 3rd qtr growth
8. NVDAs earnings out & great
Trading Plan
1. Good BTD - 25000, wait for the bounce
2. Breakouts - always
3. Pivots, & Jokers - always

Nasdaq Big crash is started from november 2025 month. Good luck.Technically on charts, Nasdaq has completed its viscous fed liquidity supported; all 5 elliot waves starting from 2001 dot com low 797 to present year high 26399. Today is 20.11.2025. Pic is attached for your reference. Will see this chart again after a year or may become obsolelte if nasdaq again crosses 26399 and stays above it for a month. Lets see.

NQTargets are above unless price respects this demand and continues moving up. After price reaches a target, wait for confirmation on the lower timeframes — that’s what will tell you whether price will continue or not. You don’t predict; you react to each zone.

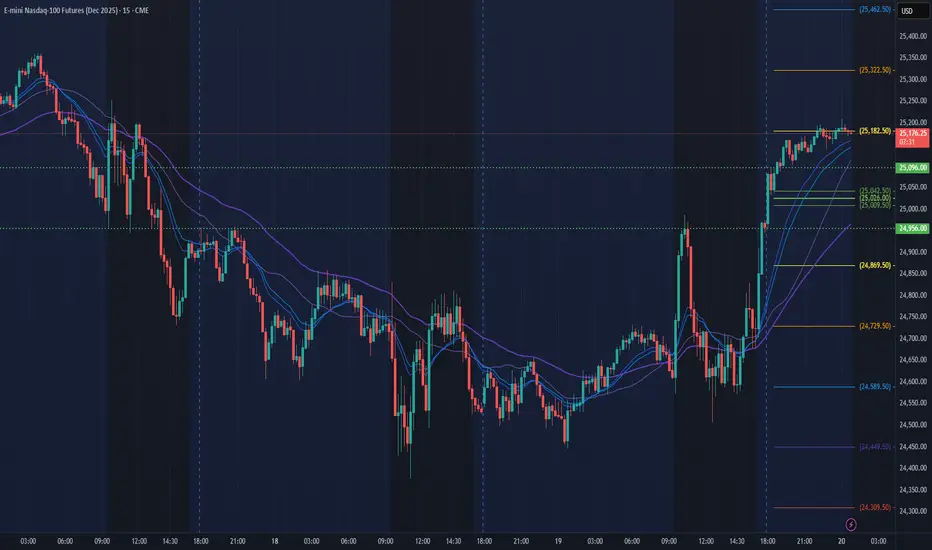
NQ Power Range Report with FIB Ext - 11/20/2025 SessionCME_MINI:NQZ2025
- PR High: 25110.75
- PR Low: 24955.50
- NZ Spread: 211.5
Key scheduled economic events:
08:30 | Philadelphia Fed Manufacturing Index
10:00 | Existing Home Sales
Session Open Stats (As of 12:15 AM)
- Session Open ATR: 478.35
- Volume: 49K
- Open Int: 292K
- Trend Grade: Long
- From BA ATH: -4.6% (Rounded)
Key Levels (Rounded - Think of these as ranges)
- Long: 26636
- Mid: 25410
- Short: 24039
Keep in mind this is not speculation or a prediction. Only a report of the Power Range with Fib extensions for target hunting. Do your DD! You determine your risk tolerance. You are fully capable of making your own decisions.
BA: Back Adjusted
BuZ/BeZ: Bull Zone / Bear Zone
NZ: Neutral Zone
NQ Daily Outlook | November 20, 20251H timeframe — 50 EMA (black) for trend + 5/10 EMAs (white) for momentum/BOS.
Quick read: Price broke above the 5/10 EMAs and cleared the 50 EMA with a strong impulse. All EMAs are now below price, so we’re in a bullish state for the first time in a while.
Bullish idea (favored)
Now that we’re above all EMAs, I’m looking for:
A small pullback into the whites
A bullish BOS
Then continuation higher
As long as we stay above the 50 EMA, momentum stays bullish.
Bearish idea
Only shifts bearish again if:
We drop back under the 5/10 EMAs
Lose the 50 EMA
Print a BOS down
Until that happens, shorts are lower probability.
Bias: Bullish — EMAs reclaimed + impulse confirms momentum. I’m looking for continuation up unless we lose the whites and fall back under the 50 EMA.

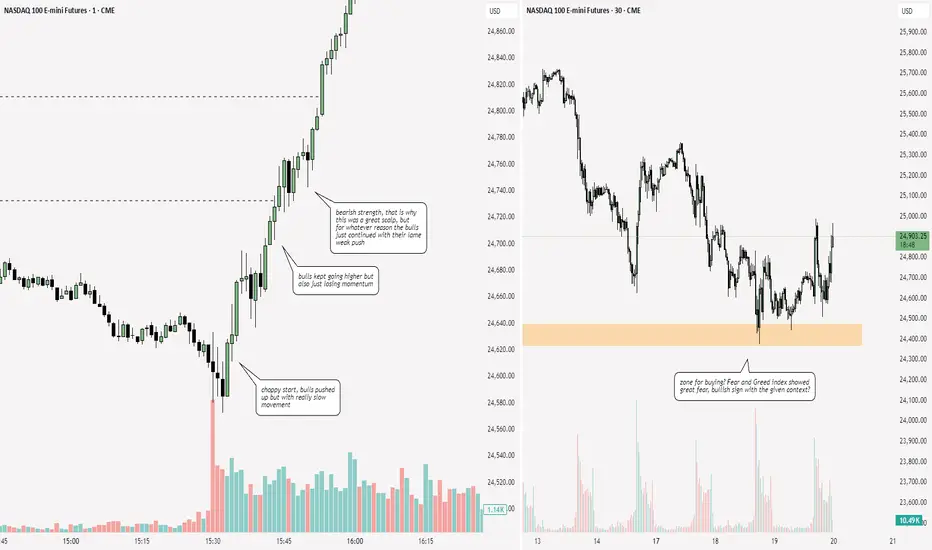
NQ UpdatePretty much the same as ES.
Since I didn't buy any calls this afternoon, I'm probably just staying out for now. No point in chasing a 1.5% futures pump.

NQ: 285th trading session - recapI'm back now, haven't scalped in a while since my gf decided to break things up which really messed me up. I'm trying to get my stuff together and start over with scalping after a longer break. One of the first days of me actually being able to have a sort of normal session lmao
Garrett Ball Spelling Garrett with two t doesn't make sense. We really need to sweep the t out of his name


"Tiny Bubbles"Don Ho 1966
Setup
6.3% moderate pull back
Px coil atop strong support
Breakout trade just above 09:30 close
09:30 5m candle big volume
Don't think this is a bubble. Just a normal pull back.
All fundamentals remain strong.
His entries
+4 @ 24640; target: 24659
+4 @ 24660; target: 24679
+4 @ 24680; target: 24699
+4 @ 24700; target: 24719
+4 @ 24720; target: 24739
This was a really good setup, so he used +4 for first five entries. He very seldom does 5 trades in a row of +4. That tells you how good this setup was. 24740 is a bit of resistance so he switched to +3 entries.
From here to 24840, the next resistance, he bot +3 in 20-point increments with corresponding 19-point targets.
From here to 24940, the next resistance, +2 in 20-point increments with corresponding 19-point increments.
From here on +1 in 20-point increments same 19-point target.

Diabolical trading could frustrate you if you let it, in hindsight the play was right at the off when the bodies were respecting that very first OB+


bullish move in the makingusing trendline trading strategy time-frame analysis its clear that a bullish move is about to happen. As always money management is key and trading is risky. This is not a financial advice.

AI Valuation TechnicallyThese are the three largest market-cap listed companies on the Nasdaq.
If we are concerned about an AI bubble, I’m going to show you how I perform a quick glance at some top companies and their index to determine the likelihood of an upcoming short-, mid-, or long-term correction.
In 2017, Microsoft’s P/E reached its highest at 45 — and it continued to rise after that.
In 2023, Nvidia’s P/E reached its highest at 147 — and it continued to rise after that.
In 2024, Apple’s P/E reached its highest at 40 — and it continued to rise after that.
Video version:
Micro E-mini Nasdaq-100 Index
Ticker: MNQ
Minimum fluctuation:
0.25 index points = $0.50
Disclaimer:
• What presented here is not a recommendation, please consult your licensed broker.
• Our mission is to create lateral thinking skills for every investor and trader, knowing when to take a calculated risk with market uncertainty and a bolder risk when opportunity arises.
CME Real-time Market Data help identify trading set-ups in real-time and express my market views. If you have futures in your trading portfolio, you can check out on CME Group data plans available that suit your trading needs tradingview.com/cme/

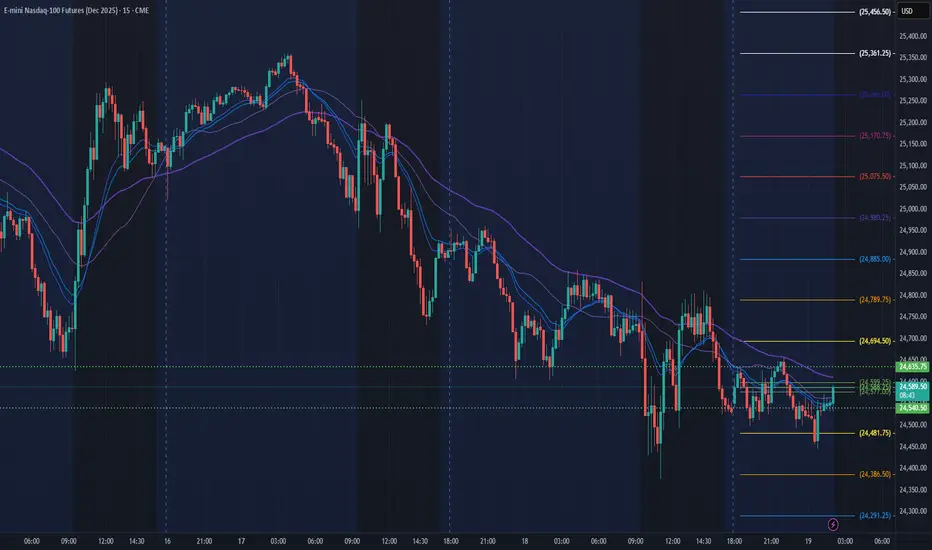
NQ Power Range Report with FIB Ext - 11/19/2025 SessionCME_MINI:NQZ2025
- PR High: 24635.25
- PR Low: 24540.75
- NZ Spread: 211.5
Key scheduled economic events:
14:00 | FOMC Meeting Minutes
Session Open Stats (As of 12:35 AM)
- Session Open ATR: 468.50
- Volume: 51K
- Open Int: 295K
- Trend Grade: Long
- From BA ATH: -6.9% (Rounded)
Key Levels (Rounded - Think of these as ranges)
- Long: 26636
- Mid: 25410
- Short: 24039
Keep in mind this is not speculation or a prediction. Only a report of the Power Range with Fib extensions for target hunting. Do your DD! You determine your risk tolerance. You are fully capable of making your own decisions.
BA: Back Adjusted
BuZ/BeZ: Bull Zone / Bear Zone
NZ: Neutral Zone
NQ1! 1H Chart – Bearish Channel + Hidden DivergencePrice is moving within a descending channel on the 1-hour chart. A hidden bearish divergence is confirmed on the stochastic oscillator, aligning with the channel structure.
System-based short setup using EMA 100 structure and divergence logic.

Do You Know Bitcoin and Nasdaq Have a 92% Correlation?* Most traders still believe Bitcoin and the Nasdaq 100 belong to two different worlds — one is “digital currency,” the other is “US tech stocks.”
- But in reality, Bitcoin and Nasdaq have nearly 92% positive correlation (based on past +10 years data).
The current market movements are showing signs of a market crash on the way...........
- See for arounf past 10 years, Bitcoin stayed above the tech index.
- It was the month of Nov only in 2015, when Bitcoin crossed above Nasdaq on the chart
After 10 straight years - Its 2025 & the month of November itself
- And Bitcoin has slipped below Nasdaq, forming its first bearish crossover in a decade.
This is a major shift.
- When a long-term leader loses momentum, it often signals deeper structural weakness — not only for Bitcoin, but for the entire risk-on ecosystem.
- Remember, Nasdaq & Bitcoin has over a 92% correlation
- And US tech industry is brewing a bubble somewhere - where the epicenter lies in the AI sector
A crash in one will sink the other with it
Checkout the chart (Nasdaq Futures & Bitcoin Weekly)

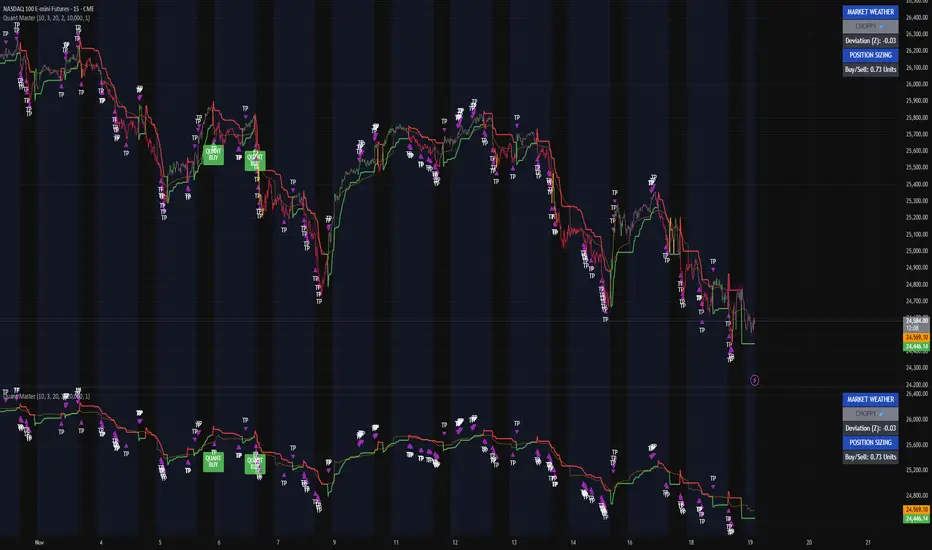
Pure signal reading. Here’s how I’m reading NQ right now.I’m tracking NASDAQ 100 e-mini futures (NQ) on the 15-minute using my Quant Master Trend System — the same model I use to separate real directional pressure from intraday noise.
This entire chart is a perfect example of why most traders get chopped to death: they trade emotions, but I trade structure.
The ribbon is choppy, fragmented, and constantly flipping, which is exactly what I expect when Market Weather is labeled CHOPPY in the panel.
That mode tells me one thing:
Breakouts fail.
Breakdowns fail.
Momentum has no conviction.
When the system is in CHOPPY mode, every pullback looks like a setup, but it’s not — the model purposely suppresses continuation trades and fires more TP clusters because it’s detecting distribution, not trend.
You can see it clearly:
• Every time the ribbon tries to go green, it gets rejected within a handful of bars.
• Every red flip lacks strong downside extension — everything fizzles.
• Price oscillates around the volatility stop instead of respecting it.
• TP clusters fire rapidly — that’s your model’s “don’t trust this move” signature.
Even the Quant Buy signals tell the story.
They’re valid moves, but they’re short-lived, because the underlying pressure isn’t unified. That’s the entire point of this system: it’s telling you the environment, not just the direction.
The deviation reading is mild at Z ≈ -0.38, which means price isn’t stretched in either direction — the perfect recipe for messy intraday action.
So here’s how I’m interpreting this:
This is not a trending environment.
This is rotational flow, liquidity probing both sides, and no clean edge.
The ribbon’s behavior, the failed retests, the compression, and the constant TP firing confirm that NQ is stuck in a structure where continuation trades have the lowest probability.
Until Market Weather leaves CHOPPY and we get a clean ribbon alignment, I’m treating everything as low conviction and short-duration.
NQ Daily Outlook | November 19, 20251H timeframe — using the 50 EMA (black) for trend + 5/10 EMAs (white) for momentum/BOS.
Quick read: We’re still under the 50 EMA, and the whites are curled down. Structure is still making lower-highs and lower-lows, so momentum stays bearish for now.
Bearish idea (favored)
If we stay under the 5/10 EMAs and reject the 50 again, I’m looking for a BOS down and continuation into the lows.
Bullish idea
If we reclaim the whites, break a lower-high, and hold above the 50 EMA, then I’ll flip long and look for a clean BOS up.
Bias: Bearish until price breaks structure to the upside and holds above the 50 EMA.
