NQ Range (11-10-25, Week 7)The 7 week Forecast is in the final week and we are up about 300 points after getting rejected at upper Target. NAZ back in the Churn Zone and did U Turn off Friday lows just under the Mid Level CZ. KL 483 is TZ to 25,333. Key fact is the NAZ and NDX are at long tern TL. Under the TL is Danger Zone
About NASDAQ 100 E-mini Futures
An index composed of the 100 largest, most actively traded US companies listed on the Nasdaq stock exchange. This index includes companies from a broad range of industries with the exception of those that operate in the financial industry, such as banks and investment companies.
Related futures

"Get Up Offa That Thing"James Brown 1976 Funk
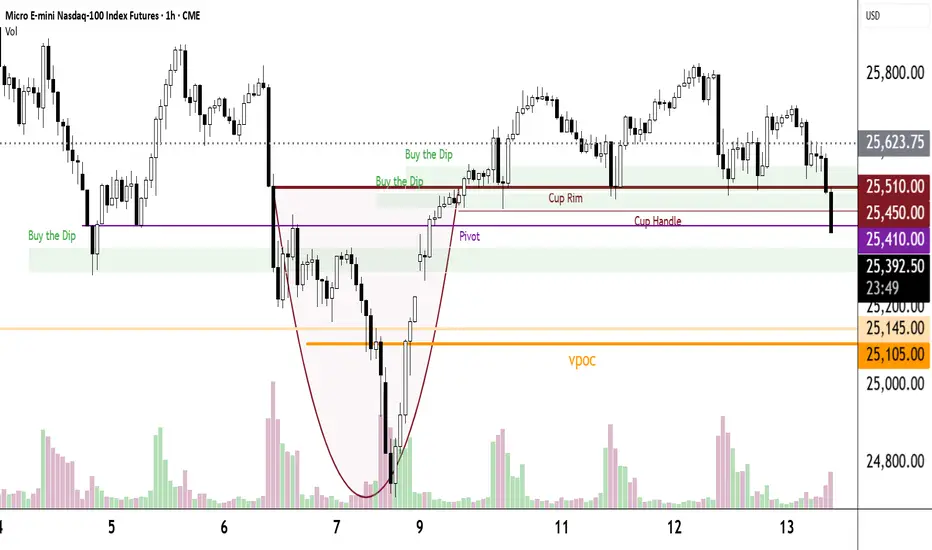
Get up offa the shutdown.
Get up offa the dance floor.
Today's Dance Floor is 25510.
Hmmm...What's happening? He thought we would have seen a much bigger bounce last night when the shutdown ended.
Today's key landmarks are clearly seen.
Buy the Dips
***Wait for a bounce
***H
NAS100 - Head and ShouldersWithout a doubt, a Head and Shoulders according to the bullish channel, RSI in oversold territory, looking ahead to the Year-End rally...

BULLISHNQ
BIAS: BULLISH
DAILY: Price is currently above the daily -OB MT. Yesterday, price retraced to the 4H + inversion fair value gap and respected this discount array and took off.
PDH & Asian High (equal highs): Has been raided ahead London opening plus the Old High on Thursday Nov. 06, 2025. Then

TREND LINE 5M30 SECOND MODELPrice swept the prior session’s Asia low, tapping into a 4H demand zone aligned with a 1H bullish order block. On the 1-minute chart, liquidity was taken and a clean BISI formed. Entered long on the first retracement into the FVG with stops below the swing low. Targeted the opposing 15M liquidity po

NASDAQ 100 (NQ1!): Time To Buy This Dip? Oh Yeah!Welcome back to the Weekly Forex Forecast for the week of Nov. 10-14th.
In this video, we will analyze the following FX market: NASDAQ (NQ1!) NAS100
The NASDAQ pulled back after rallying for weeks! We patiently waited for a dip buying opportunity to form. Well, Friday might have given us the in

NQ Weekly Recap | November 2–7, 2025Hey everyone, this is the 1-hour chart. It shows the big picture of where price is going. We also use the 5-minute and 1-minute charts to find the exact spot to get in and put our stop loss nice and tight.This week NQ started around 26,400 and just kept falling, falling, falling… all the way down to

NQ = NAS100Elite Strategy
NASDAQ (MNQ/NQ) – Multi-Timeframe Analysis
Price tapped into the 45-minute imbalance inside a 4H premium zone. The overall structure remains bearish, and the reaction confirms sellers defending this level.
Expecting continuation toward 25,300 and possibly 25,000 as the next liquidity

Ode to Joy Jr.Buy the Dips worked well.
He always waits for a bounce in a BTD area (accumulation/distribution area). He buys 1 MNQ in 5-point intervals. Every target is 21 points. His first entry was 610 and his bottom entry was 490.
He has entered NQ Breakouts. First entry at 620 and every 20 points thereafter.

NQ Daily Outlook | November 12th, 2025Most likely direction: Up (bullish)
Why:
Trend is still up on my read of structure.
NY session pulled back deeper than expected and slipped under the black 50 EMA.
I see it as a correction within the trend. I expect price to reclaim and trade back above the EMAs and continue higher.
Scenarios:
Pr

See all ideas
Summarizing what the indicators are suggesting.
Neutral
SellBuy
Strong sellStrong buy
Strong sellSellNeutralBuyStrong buy
Neutral
SellBuy
Strong sellStrong buy
Strong sellSellNeutralBuyStrong buy
Neutral
SellBuy
Strong sellStrong buy
Strong sellSellNeutralBuyStrong buy
A representation of what an asset is worth today and what the market thinks it will be worth in the future.
Displays a symbol's price movements over previous years to identify recurring trends.
Frequently Asked Questions
The current price of NASDAQ 100 E-mini Futures is 25,094.00 USD — it has risen 0.15% in the past 24 hours. Watch NASDAQ 100 E-mini Futures price in more detail on the chart.
The volume of NASDAQ 100 E-mini Futures is 848.20 K. Track more important stats on the NASDAQ 100 E-mini Futures chart.
Open interest is the number of contracts held by traders in active positions — they're not closed or expired. For NASDAQ 100 E-mini Futures this number is 302.09 K. You can use it to track a prevailing market trend and adjust your own strategy: declining open interest for NASDAQ 100 E-mini Futures shows that traders are closing their positions, which means a weakening trend.
Buying or selling futures contracts depends on many factors: season, underlying commodity, your own trading strategy. So mostly it's up to you, but if you look for some certain calculations to take into account, you can study technical analysis for NASDAQ 100 E-mini Futures. Today its technical rating is sell, but remember that market conditions change all the time, so it's always crucial to do your own research. See more of NASDAQ 100 E-mini Futures technicals for a more comprehensive analysis.