NASDAQ on the Edge: Head & Shoulders + Bearish SeptemberOn the daily chart, a clear Head & Shoulders formation has developed: left shoulder in mid-July, head in early August, and right shoulder completed at the end of August. The neckline has been broken with volatility, and price is now retesting the supply zone at 23,600–23,800. This pullback aligns with a weekly area of strong supply, suggesting a potential rejection.
The projected target of the pattern points toward 22,800–22,600, an area overlapping with a key structural support. RSI shows bearish divergence and remains below the midline, reinforcing the short bias.
COT Report (August 26, 2025)
Non-Commercials (funds/speculators): +1,875 longs, -362 shorts → small long increase, but without strong conviction.
Commercials (hedgers): -5,832 longs, -1,579 shorts → clear reduction in long exposure, less bullish protection.
Net change: -5,275 longs → overall unwinding of long positioning, signaling underlying weakness.
Interpretation: Speculators remain net long, but commercials significantly cut exposure, suggesting caution on further upside.
Seasonality (September)
Historically, September has been a negative month for NASDAQ:
10-year average: -148 pts
5-year average: -313 pts
2-year average: -804 pts
The seasonal pattern supports a bearish bias, with weakness usually concentrated in the first half of the month.
Synthesis & Trade Bias
Technical: Bearish Head & Shoulders → target 22,800–22,600.
COT: Net long reduction by commercials → bearish pressure.
Seasonality: September statistically weak.
➡️ Bias: Short on NASDAQ (NQ).
NQU2022 trade ideas

SHORT 1HOUR CHART SL 88% FIBOThe previus setap was good.. but no profit no loss
Same strategy
SL 88%
TP LOCAL LOW
SLM TRAILING

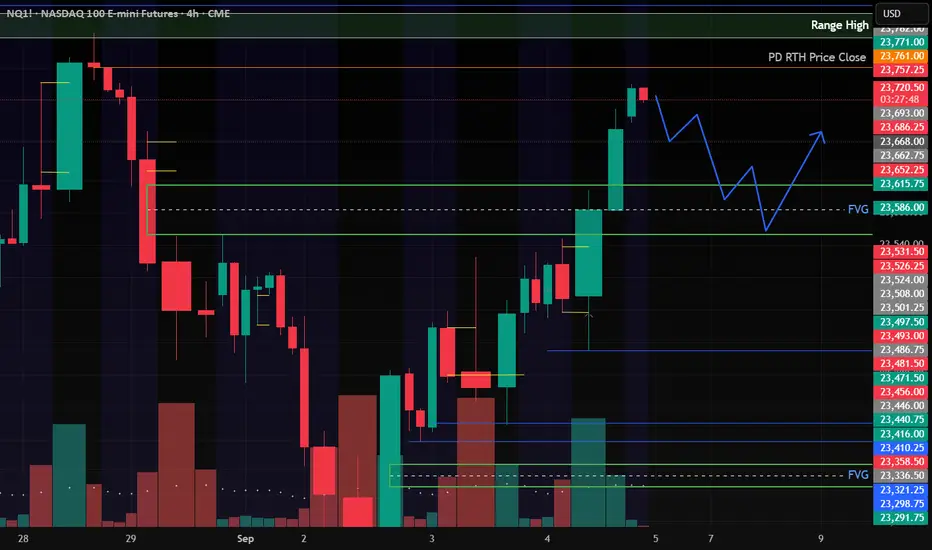
NQ Inverted fair value gap retest for possible long position
NQ seeming quite bullish starting in September. On this 4hr chart we can see price completely disregard the FVG create last Friday. I can see price staying above the 23,584.00 range and possibly filling the entirety of the inversion area before heading back to the upside. Volume footprint shows that there were very few buyers in last Fridays dump.
Ill be keeping an eye out on this trade to see how price reacts before entering.
NQ Range (09-05-25)NAZ in a range of 7 direction changes going into a Friday. Looking Short and gambling with the idea that the F-M Long Play will break down, again. The next direction change would be a move lower. KL's to watch: TLX 24,056 is pop turn zone, 24,600 is Max Pop and Long Term TL retest. TLX 22,662 is lower target after the reject at TLX 24,056 to 24,600 range. I do not see this lifting to max pop (24,600), just using as a Tweet, Magic O/N play should the F-M Play go North today and Monday. White arrow to yellow arrow is the idea here.

NQ Short (09-02-25)NAZ H/S to failed auction bottom retest (TLX 234, Turd Zone), for next big move. Seems like Tariff social media noise from Wash Street is in question and may bring some BALANCE or reality (Short). Play KL's lower and watch for the O/N to switch gears with some selling, NDX 21,850 Gap Fill may be in the mix. Go Fed, BTD, FOMO with Mr. Retail into the Long Trap.

NQ! WEEK 2 LEVELSFor the 2nd week of September, I’ve structured my Nasdaq futures charting setup around key pivot levels (weekly and daily). My focus is on identifying price reactions at the central pivot, with clear support (S1, S2, S3) and resistance (R1, R2, R3) zones. These levels serve as my primary reference for intraday bias, potential reversals, and breakout continuations. I’ll be monitoring how price behaves around these pivots to align short-term entries with the broader weekly context.

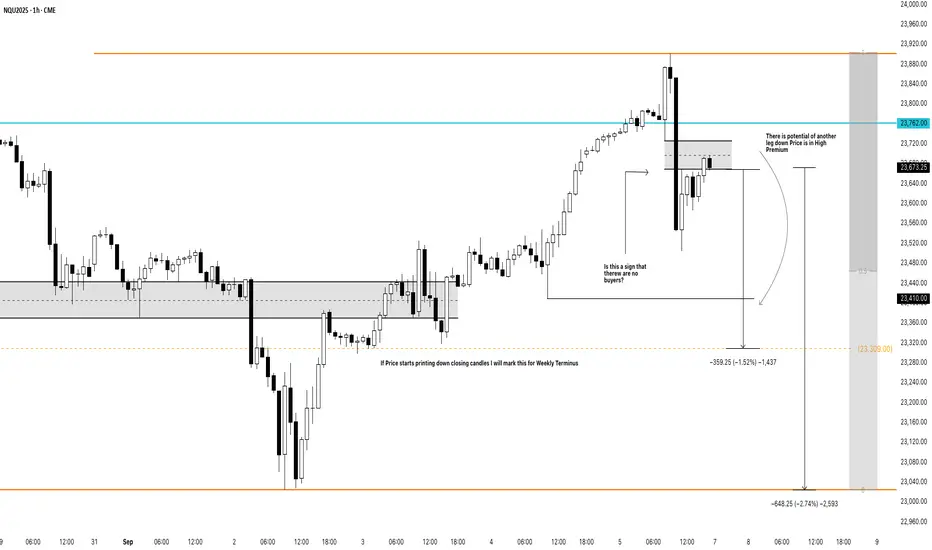
NASDAQ Caution + ConfirmationCME_MINI:NQU2025
Strong Rejection at Premium Pricing
Price rallied into a high-premium area above 23,800 and sharply rejected, leaving a large bearish displacement candle.
This suggests aggressive selling pressure and potentially an exhaustion of buyers at higher levels.
High Premium Context
Price is consolidating in a “high premium” zone (above equilibrium of the most recent swing).
The gray box marks the imbalance, which is currently acting as resistance where sellers may re-enter.
Liquidity & Posible Weekly Terminus
watching for confirmation of sustained bearish order flow.
Key Support Zones
23,410 → First downside target, aligning with partial fill of prior inefficiency and structural support.
23,309 → Major liquidity pool and marked as a potential weekly terminus if price breaks lower.
23,040 → Extended downside projection, aligning with prior weekly low sweep.
Market Sentiment
buyers failed to sustain price above 23,762.
If true, this supports a bearish continuation narrative into next week.
Bias & Trade Scenarios
Bearish Bias (Primary)
Trigger: Failure to reclaim 23,762 or rejection inside the gray FVG zone.
Entry: Look for bearish price action confirmation in the 23,700–23,750 zone.
Targets:
TP1 → 23,410
TP2 → 23,309
TP3 (extended) → 23,040
Stop: Above 23,880 (previous high / invalidation).
Bullish Counter Scenario (Secondary)
Trigger: A clean break and close above 23,762 followed by acceptance above 23,800.
Target: Re-test of 23,900 highs with potential continuation toward 24,000 round number.
Stop: Below 23,600.
Summary
Nasdaq futures rejecting a high-premium zone near 23,900, with price now consolidating inside a bearish FVG. Unless buyers reclaim 23,762 decisively, the path of least resistance favors another leg lower toward 23,410 → 23,309 → 23,040.
This setup highlights a bearish displacement with downside liquidity objectives, but traders should monitor reactions at 23,410 and 23,309 as potential bounce zones.
Non-Farm Payroll will be interestingI believe price will continue to rise ahead of Non-Farm Payroll but I will not stand in front of it. I will like to see some manipulation to the downside to possibly fill imbalances price has left. Mainly will hunt setups going long to use Previous Week High as my Draw.

NQ100 Intraday Outlook – Sept 8, 2025🧠 NQ100 Intraday Outlook – Sept 8, 2025
Bias: Intraday Bearish after NY Open
Price is currently trading within a well-defined premium zone, between the Sunday-Monday Order Block and the BPR M30 area.
🧩 Key Observations:
Price tapped into a minor M5 Order Block (OB) right after the 8:30 NY macro event.
We're seeing a reaction to a short-term OB, with a small push up likely to grab liquidity above the London session high.
Expecting liquidity run + rejection from the upper OB zone (23,810–23,830).
🔽 Bearish Scenario:
After the sweep of local highs, I anticipate a sell-off toward the Imbalance zone below (23,710 area).
Main targets are:
Imbalance fill
Possibly further down toward Weekly Open near 23,680
🔧 Confluence:
Midnight Open has already been reclaimed.
NY AM session is about to open – expecting expansion to provide confirmation.
Potential divergence between NQ (stronger) and ES (weaker) gives context for relative weakness later in the session.
📌 Idea Summary:
I expect one final push into the premium zone to grab liquidity before reversing down toward the Imbalance and possibly into the Weekly Open.

From -$450 to +450 to -$450 to +$350. Revenge trading example First 2 trades minus 200. Should have stopped. Wild swings from profit to loss to profit. Bad trading but good result. Lesson not learned.
I'm using fixed range volume profile, overnight highs and lows, 9 and 21 ema's, and VWAP. I trade momentum with breaks and retests of key levels (explained in the video). Bear and bull flags.
I tried to include screenshots of my Ninja execution screen and Apex PnL screen but they didn't come through.

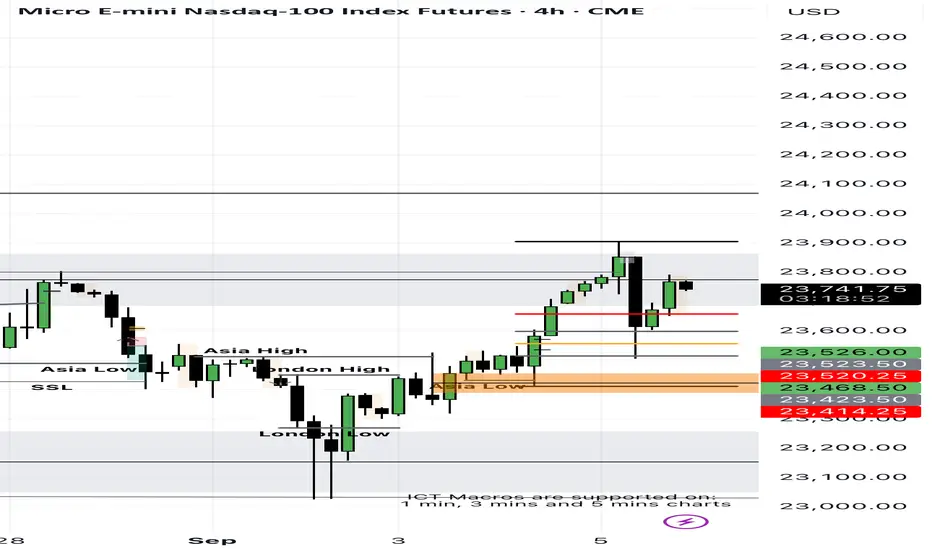
Target areas above and below current NQ price for Market open.Target areas above and below current NQ price for Market open.

Sunday Charting Market Outlook
The weekly chart remains in consolidation, with the daily chart revealing internal structure developing within a larger framework. Both buy-side and sell-side liquidity remain untapped. The most recent daily candle printed a doji, clearing prior liquidity and trading directly into a daily Optimal Trade Entry (OTE) zone — highlighting an area of interest for potential reversal.
On the four-hour chart, clean sell-side liquidity is visible at 23,019, and the last four candles have established a bearish Fair Value Gap (FVG) within the daily OTE zone.
While the broader order flow still supports a buying program, my long-term bias is for a downside move. Until a valid reversal confirms, I will continue trading intraday longs. A shift to short setups will require the four-hour bearish FVG to hold and be validated as a point of resistance.
Confluence of Tradingview's reversal indicator and S/R on NQ Today’s NQ session highlighted how powerful confluence can be. By combining TradingView’s Reversal Indicator with well-defined Support & Resistance levels, multiple signals aligned to show potential turning points in the market. This approach demonstrates how blending indicators with price structure can improve clarity and confidence in trade decisions.

NQ 09-08-2025We were overbought on NQ and paired with resistance along with FFMAT it was a great short opportunity

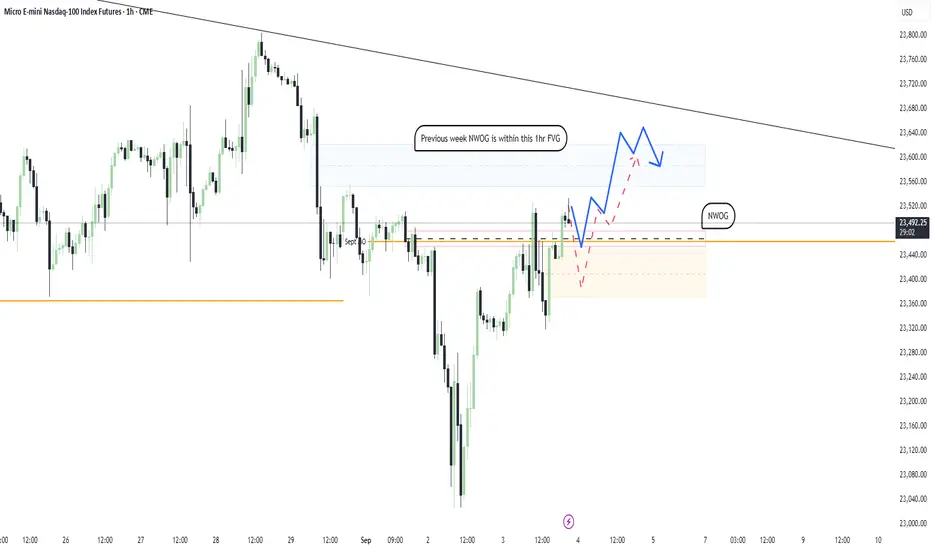
Is Nasdaq still Bullish?I’m still sensing bullish momentum on Nasdaq. My expectation is for price to retrace back into this week’s NWOG before making a push toward last week’s NWOG and the 1-hour gap at 23,583.00. There’s also a possibility we dip to fill the gap at 23,400.00 first, but if that scenario plays out, I don’t see price maintaining its bullish momentum afterward.
On the weekly chart, price continues to strongly respect the Bullish OB formed in the first week of August. As long as this level holds, I expect momentum to carry us higher in the near term.
We'll see tomorrow morning⚡
NQ (Nasdaq Futures) – Tuesday Setup 09/09/2025
🧠 Market Context
Weekly Bias: Buy-side liquidity above Friday’s and Monday’s highs remains intact → a natural draw for price.
Daily Bias: Price is consolidating near these highs, suggesting engineered liquidity.
Tuesday Profile (ICT concept): Often prints the high or low of the week. Expect a Judas Swing in the morning session before the real move develops.
🎯 Trading Idea
I expect New York Open (9:30–10:00 NY) to deliver a pump above Monday/Tuesday highs → running buy stops (BSL).
After this liquidity grab, look for rejection + Market Structure Shift (MSS) on 5m/15m charts.
That would confirm distribution and set up the short.
✅ Execution Plan
Wait for the Sweep:
Levels to watch: 23,890–23,910 (Friday & Monday highs).
Confirmation:
SMT divergence (ES fails to make new high while NQ takes it).
BOS/MSS on 5m → entry on FVG/OB retracement.
Targets:
TP1 → 23,800 (intra-day liquidity).
TP2 → 23,750 (Weekly Open level).
📌 Key Notes
If price continues bullish above 23,910 without rejection, invalidate the short idea → bias shifts to continuation higher (24,000+).
Otherwise, this is a textbook “Tuesday High of the Week” setup.
✍️ Summary:
I’m anticipating a Judas Swing to the upside at NY Open, taking buy-side liquidity, followed by a reversal into sell-side liquidity at 23,750.

#202535 - priceactiontds - weekly update - nasdaq e-miniGood Day and I hope you are well.
comment: Neutral. I see the current range from 22800 - 24069 and the middle of it is 23460ish and we closed right at it. Bears can argue a head & shoulders on the daily chart and bulls still have two decent bull trend lines going for them. I don’t think around 23500 you can have any edge. I’d like for this to not hit 24k again but the odds for that are low. Best to wait.
current market cycle: bull trend
key levels for next week: 22700 - 24100
bull case: Bulls got a new ath and the market is overdue for a pullback but that does not mean we will get one. Bulls are still in full control as long as they keep the market above 22800. Having said that, it’s overdone, overbought and we are likely at the peak of the bubble.
Invalidation is below 22780
bear case: Bears need to do more. Anything below 23000 would be a start. That would break both trend lines and opens the possibility for 22000 over the next weeks. For now I don’t think it’s good to sell around the midpoint of this triangle.
Invalidation is above 23800
short term: Neutral around 23500. Same as last week.
medium-long term - Update from 2024-08-10: 22000 likely to get hit this year gain. 20000 seems a bit much for 3 months left.

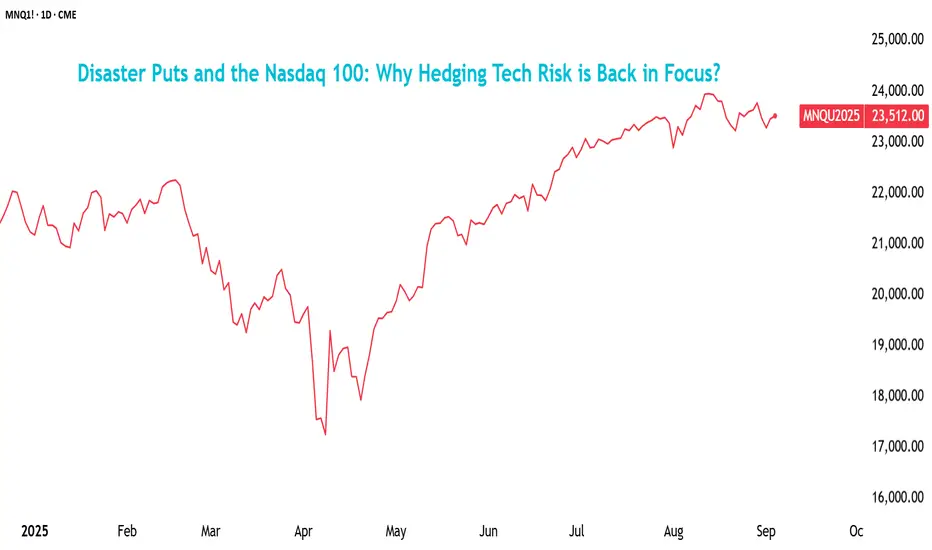
Disaster Puts & Nasdaq: Why Hedging Tech Risk is Back in Focus?Periods of calm in financial markets often mask the risks that lie beneath. With the Nasdaq 100 trading at elevated valuations and implied volatilities back at subdued levels, the cost of buying protection has rarely looked cheaper.
That sets the stage for a discussion around “disaster puts,” those deep out-of-the-money (OTM) put options designed to protect against sudden and severe drawdowns. These hedges, which would otherwise appear unnecessary, become relevant in cases where history repeats itself, reminding investors of how quickly corrections can turn into crashes.
The Nasdaq 100 has surged nearly 40% since its April bottom, powered by the Magnificent 7 rally (+50%). But options traders aren’t buying the calm; they’re piling into disaster puts on QQQ (an ETF tracking the index), driving the 2-month 10-delta to 25-delta put volatility ratio to a three-year high.
Source: Bloomberg
Put skew simply measures how expensive deep OTM crash protection is compared to nearer-the-money downside hedges. Here, a 10-delta put is a very low-probability and a deep OTM option—essentially as insurance against a rare and severe plunge. The 25-delta put is much closer to the current price and represents more standard protection.
The ratio rising toward 1.8x means those deep crash hedges are nearly 80% more expensive than regular downside hedges. Normally, these “disaster puts” always cost more, but the increasing gap shows investors are paying up for tail-risk protection, worried about another sudden April-style selloff rather than just a typical 5–10% correction.
So while the elevated put skew underscores crash hedging demand, it’s only part of the story. To see how the market is weighing downside protection against upside chase in general, we can look at the call/put skew:
Source: CME QuikStrike
Nasdaq 100 ( NQ ) 10-delta skew also shows deep OTM puts trading at a heavy premium to upside calls. Elevated put skew reflects persistent demand for crash protection, while negative call skew signals little appetite for chasing extreme rallies.
Though not as extreme in magnitude, the preference of calls over puts is clearly reflected in the same chart on the 25-delta skew:
Source: CME QuikStrike
Bearish Tilt in ETF and Futures Positioning
As of 02/Sept, options OI for NQ across all expiries is decisively bearish, with the put-call ratio being 1.45 overall:
Source: CME QuikStrike
Among all expiries through to the end of the year, it is the one expiring on 19/Sept that has the highest OI, followed by the 19/Dec and 17/Oct expiries. The October expiry has the most bearish OI outlook, with a PCR of 1.89.
This QuikStrike table below tracks daily open interest changes for the weekly Nasdaq-100 (NQ) options contract expiring Friday, September 5th.
Source: CME QuikStrike
The build-up of put positions over the past session stands out. On 29/Aug, 90 puts were added for the 23,300 strike; 133 puts were added for the 23,175 strike; and 84 puts were added for the 22,900 strike—a 2.3% decline from the current price.
Source: CME QuikStrike
Going even further deep OTM, we see that strikes as low as 20,950 have also garnered put interest recently:
The additions of 44 puts for that, along with the high concentration of puts above the 22,500 strike, reinforce the hedging demand build-up for the index.
Having said that, near-the-money calls have also seen some interest, with the call interest falling dramatically above the 24,000 strike.
Taken together, the recent OI change mirrors the broader skew dynamics, where investors are paying for tail protection, but there also remains a pocket of bullish positioning near-the-money, reflecting both optimism in the rally’s resilience and nervousness about another outsized swing.
The chart below shows the Commitment of Traders (CoT) report for the Micro Nasdaq 100 ( MNQ ) contract:
Source: CME QuikStrike
This reflects that retail investors (non-reportable) have already taken note: the positioning has flipped decisively net short starting in July. As of August 26, retail traders held 36,507 longs versus 55,534 shorts, leaving them net short by about 19,000 contracts. This marks a sharp contrast to June, when retail had a strong net long bias.
Source: CME QuikStrike
However, CoT data for asset managers and hedge funds (leveraged) shows that speculators here are still leaning net long. While the latter did add a lot of short positions, it was a 21% week-on-week decline as against the 30% increase in their long positions.
History’s Warning: Valuations and Vulnerability
This renewed appetite for disaster insurance reflects a deeper truth: the Nasdaq 100 has never been a gentle market to own when sentiment turns. Its tech-heavy composition leaves it more exposed than the S&P 500 when valuations come under pressure. Four episodes stand out.
The dot-com bust from March 2000 to October 2002 remains the starkest example. The Nasdaq 100 collapsed by nearly 80%, compared with a 45% decline for the S&P 500. An era of speculative IPOs and unprofitable startups had inflated expectations well beyond what fundamentals could support. When capital dried up, the selling pressure was relentless, and the recovery took more than a decade.
A similar concern about high capex for firms pivoting around AI and their corresponding high valuations worries those who are averse to a call back to post-Y2K events.
A July 2025 report from MIT highlights that 95% of companies investing in GenAI have yet to see financial returns, while Ted Mortonson of Baird flags sky-high valuations in AI stocks with scant earnings as reminiscent of past excess.
The firms are priced to perfection; expectations so high that they are valued with the assumption that everything will go right. In these cases, even a small disappointment can cause the stock to fall sharply because expectations are already maxed out.
OpenAI CEO Sam Altman also cautioned last month that investors are possibly “overexcited,” while Apollo’s Torsten Slok noted that the top-tier S&P names today may be more overvalued than during the 1999 tech apex.
Source: Apollo Academy
The top-10 for both—the S&P 500 and the Nasdaq-100—constitutes the same names, with Berkshire Hathaway replacing Netflix in the former index. Though the chart above pertains to the S&P 500, the situation looks meeker for the Nasdaq 100.
The 2022 bear market brought the focus back to valuations and rates. As the Federal Reserve hiked aggressively to contain inflation, the S&P 500 slipped about 25%. The Nasdaq 100, with its sensitivity to discount rates and long-duration earnings, fell closer to 35%. This reinforced the dot-com lesson: when the cost of capital rises, growth stocks are punished most severely.
Hedging in a Calm Market
Today, the volatility markets tell an interesting story. The Cboe Nasdaq-100 Volatility Index (VXN) shows option premiums to be at near-yearly lows.
Overall, option premiums are subdued, making standard hedges unusually cheap. Tying it back to the disaster puts, the relative cost of crash protection has still spiked with investors crowding into deep OTM puts. In other words, plain insurance is inexpensive, but extreme insurance is at a premium.
Having said that, net ETF flows into QQQ also continue to indicate that investors remain confident in tech, even as concentration risk rises. In August, the inflows netted over $1.8 billion. Assets under management (AUM) have also reached an all-time high, having recovered after the slump in April.
All of this, and especially the subdued IVs, means that hedging is now cheaper; it is also more urgent, given how quickly positioning can flip.
And while protection is unusually inexpensive now, this isn’t as much about predicting the next crash via disaster puts, but more about taking advantage of the market’s calm to lock in cost-efficient insurance. Just as homeowners don’t buy fire insurance because they expect a blaze tomorrow, prudent investors can use puts to guard against shocks.
CME’s weekly Micro E-mini Nasdaq-100 options (and Micro E-mini S&P 500 options) offer a flexible way to manage near-term risks, with contract sizes one-tenth the notional of standard E-minis.
These options allow hedgers to size positions precisely, hedge around specific events like Fed meetings, CPI releases, or major earnings weeks, and do so at a fraction of the capital cost. Protection can be rolled week to week, letting investors adjust to changing conditions without tying up excessive premium budgets.
The Micro weeklies strike the middle ground wherein the long-haul protection of disaster puts can be replaced with more agile and affordable coverage, offering “rolling” caution for the kind of shocks that arrive when least expected.
MARKET DATA
CME Real-time Market Data helps identify trading set-ups and express market views better. If you have futures in your trading portfolio, you can check out on CME Group data plans available that suit your trading needs tradingview.com/cme .
DISCLAIMER
This case study is for educational purposes only and does not constitute investment recommendations or advice. Nor are they used to promote any specific products, or services.
Trading or investment ideas cited here are for illustration only, as an integral part of a case study to demonstrate the fundamental concepts in risk management or trading under the market scenarios being discussed. Please read the FULL DISCLAIMER the link to which is provided in our profile description.
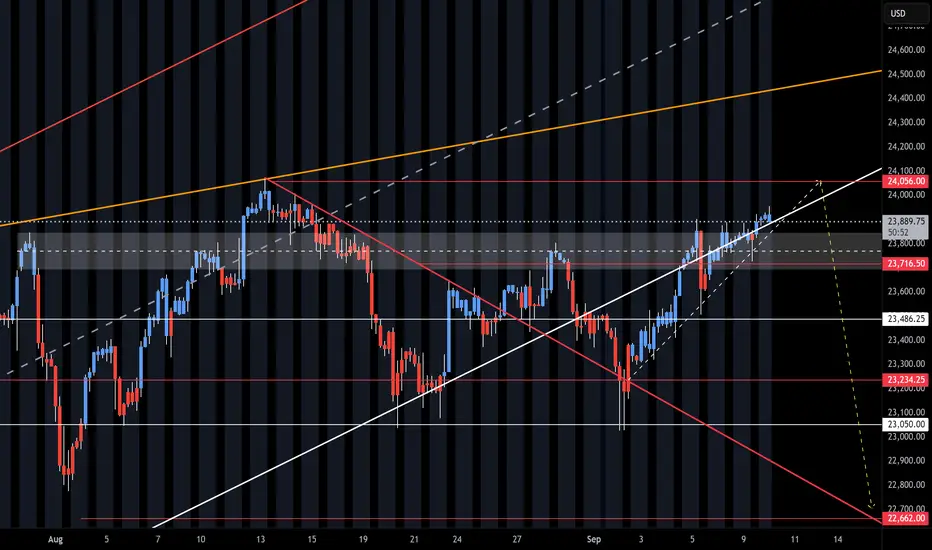
NQ Range (09-10-25)NAZ has been nibbling higher for 3 days and stopping at 23,900. Turn Zone above is 24,060, watch O/N Pump/Dump today at Reg Session open. Looking for yellow arrow to play out. Watch the Tweets during the Dead Zone or any Govt issued news (to the Long side). These may be knee jerk head fake longs or stall out set up to the short side. No drop, BTD and FOMO with the crowd.
NASDAQ (NQ1!): Buy It Until The Market Notifies Us Otherwise!Welcome back to the Weekly Forex Forecast for the week of Sept 8 - 12.
In this video, we will analyze the following FX market: NASDAQ (NQ1!) NAS100
The NASDAQ looks poised to move higher. There is potential for it to make a new ATH.
Wait for pullbacks to poi's for valid long setups.
I do not see a reason to sell this market. Until there is a bearish break of market structure, buys are the ticket.
Enjoy!
May profits be upon you.
Leave any questions or comments in the comment section.
I appreciate any feedback from my viewers!
Like and/or subscribe if you want more accurate analysis.
Thank you so much!
Disclaimer:
I do not provide personal investment advice and I am not a qualified licensed investment advisor.
All information found here, including any ideas, opinions, views, predictions, forecasts, commentaries, suggestions, expressed or implied herein, are for informational, entertainment or educational purposes only and should not be construed as personal investment advice. While the information provided is believed to be accurate, it may include errors or inaccuracies.
I will not and cannot be held liable for any actions you take as a result of anything you read here.
Conduct your own due diligence, or consult a licensed financial advisor or broker before making any and all investment decisions. Any investments, trades, speculations, or decisions made on the basis of any information found on this channel, expressed or implied herein, are committed at your own risk, financial or otherwise.

NQ 9/5Daily resistance on top of price.
Price is currently testing and being held by a 15min Inverse FS level.
A distribution trend is trying to form. If the BS candle is not formed to create the future origin level needed to create the trend, then price is targeting a higher range.
Price is supported by an hourly BS level, (unmarked) and the 4hr RAT with its accumulation trend. The 4hr level has the potential to break the daily distribution trend.
seems likely the price will need to find support again before breaking out.


NQ FUTURES IDEA 9/7We are looking to test the top of 23,773 NQ but if we fall below 23,685 NQ we going short. I think we have a higher chance of going higher to retest 23,773 and even push up to PWH at 23,800 NQ tomorrow before pushing back.
