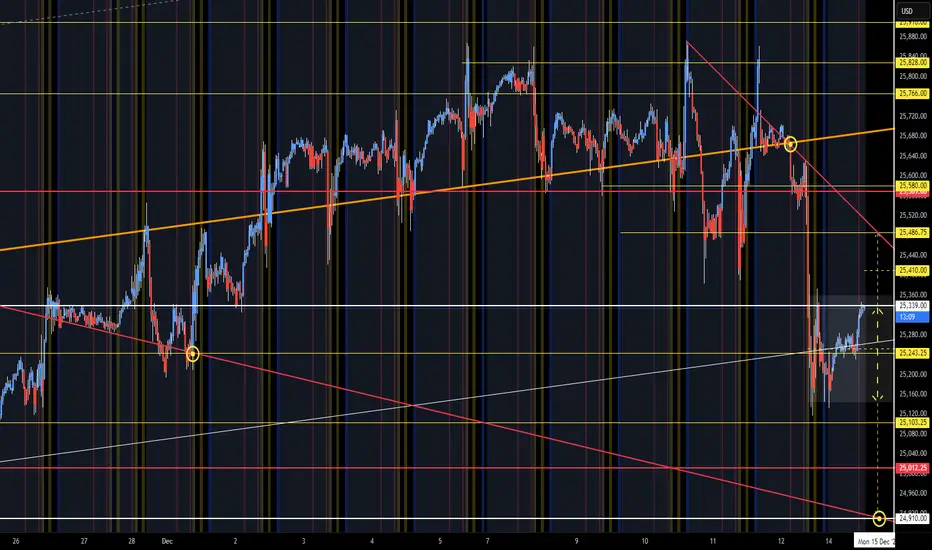
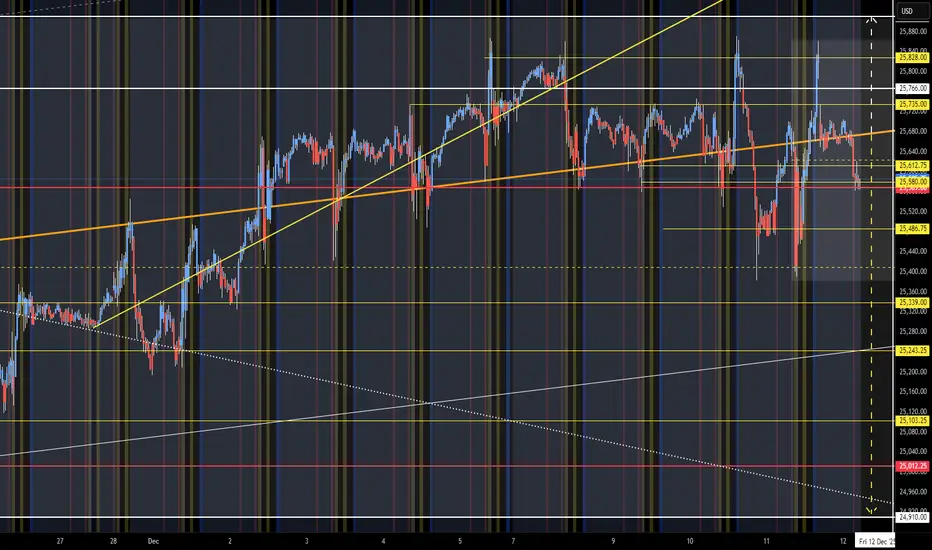
NQ Range (12-15-25)After the drop back into the Churn Zone, we have a NAZ Triangle of Range. Upper circle is the break under 10/22 TL, Mid circle is near mid CZ and Diablo pop on 12/1 and lower circle is CZ bottom and U Turn Target. Open Range (Reg Session) is shaded zone (yellow arrow), white arrow is break out to retest Diablo and lower yellow will be to KL 24,910. Watch the counter moves (Spikes) prior to actual larger moves, Overnight Pump/Dump at Open Drive and of course the Tweets during the Dead Zone. IDS27 Friday Open to current Chart:
NASDAQ 100 E-mini Futures
No trades
Market insights
NQ Range (12-18-25)The O/N has retraced 200 of the 400 points needed to get the NDX out of the Danger Zone range. NQ is at KL 25,103 & Diablo. U Turn attempt in the Overnight is underway. After the Washington Street & Meme Coin public address, they may need to try all Long side tricks to stabilize these markets. My 12/16 Short call was a half day early and needed to let the O/N pump/dump play out before the NAZ dropped 600 points. Watch Diablo today and 25,060 level for Long above and Short below. Utilizing KL's for trade entry may help. Many times the opposite direction trades at a KL will provide scalps and provide signals for direction turns (back to opposite direction KL). I would not be surprised to see the VIX pick up and some wild Long side O/N plays should the Reg Session continue to sell off the O/N long side Rig Pumps. Since 12/10 we have seen 3 Long Traps paly into the BTD/FOMO crowd, I would think that these traps are looking for a much lower drop test.
NDX YTD Chart
IDS27 View

NQ Range (12-17-25)Not what it seems, have to follow the crumbs of Tricks. On 12/26 NQZ hit KL 24,910 and is now at 25,245 (White Arrow). This is the actual PRICE of NQ, which is under Channel and 200 plus points lower. NDX will gap open higher (and above danger zone), that was the goal today. Knowing the Tricks may help with your next trade, which should be Short (at some point).
NDX Chart
IDS27 Chart

NQ Range (12-19-25)NAZ Overnight X Games may just pull it off. We are going into probably the final Friday-Monday Long Play of the year. This with the added volatility of contract changes and expirations. The current and previous Overnight session have been keeping the NAZ above the Danger Zone. Looking for the F-M play to try to push higher and if not, look for a drop back into lower CZ below (25,339 -24,910). Yellow arrow is Open Drive Range. The 12/17, 600 point drop was follow up with the typical 85% retracement the following day and primarily from the Extreme Rig of the O/N. Usually a 2% plus drop in the NAZ will take days to retrace the 85%, this one was juiced immediately for some reason. Will be leaving early today, will update what I can.

NASDAQ: Dip Buy Time! Wait For Valid Buy Setups!Welcome back to the Weekly Forex Forecast for the week of Dec. 15 - 19th.
In this video, we will analyze the following FX market: NASDAQ (NQ1!) NAS100
The NASDAQ is is still bullish, despite the leeriness toward AI and tech stocks. Profits were taken Friday, causing a bearish close on the day. But there are supporting structures for higher prices nearby, and I will personally be watching for price to contact those areas and look for valid market shifts to signal buys are in order!
Enjoy!
May profits be upon you.
Leave any questions or comments in the comment section.
I appreciate any feedback from my viewers!
Like and/or subscribe if you want more accurate analysis.
Thank you so much!
Disclaimer:
I do not provide personal investment advice and I am not a qualified licensed investment advisor.
All information found here, including any ideas, opinions, views, predictions, forecasts, commentaries, suggestions, expressed or implied herein, are for informational, entertainment or educational purposes only and should not be construed as personal investment advice. While the information provided is believed to be accurate, it may include errors or inaccuracies.
I will not and cannot be held liable for any actions you take as a result of anything you read here.
Conduct your own due diligence, or consult a licensed financial advisor or broker before making any and all investment decisions. Any investments, trades, speculations, or decisions made on the basis of any information found on this channel, expressed or implied herein, are committed at your own risk, financial or otherwise.

NQ Resistance at 25,800: Volume Cluster from Friday’s Sell-OffFriday’s strong sell-off on NQ created a high-volume cluster near 25,800.
This shows sellers built short positions in that area before pushing price lower.
If price pulls back to 25,800, sellers are likely to defend it again.

25076 is a super level. Watch for further drops if it breaksSee all the arrows where this level got respected. Some sessions it was the perfect bounce on CME_MINI:NQ1! CME_MINI:MNQ1! and other sessions, it was the level that caused an instant flush down or rocket up. I suspect price to hover around this level and either accumulate before a complete reversal or trap some bulls before a drop down to mid 24000s. I'd set the next max bounce level around 24649 if we give up this level.
Set your TradingView alerts and see what happens around this level. You can put alerts on your horizontal line if you really want to. See image below.
One last thing: if you see the 4 hour chart a little more zoomed in you'll notice an inverse cup and handle:
This should give another 200 point flush at the very minimum. If you are really eager to catch a bounce, watch this demand zone at 24816.

NQ Possible Longs IncomingUsing Volume Profile from intraday volume for 12/16/2025. Price keeps reacting to the area in rectangle for some time. It tried breaking below and pushed back up into the resistance area. Looking for price to break through the resistance and turn support out of the POC.

NQ 100 Futures biasWe have been consolidating during the last week and during friday we unespectally dropped to an old OPRG. We left 4 equal highs I think the algo will target during the next week.

NASDAQ Trade Journaling . 16 DECEMBER - TUESDAYNASDAQ Trade Journaling
16 DECEMBER - TUESDAY
HTF: BULLISH
Price takes Support from 4H-BISI
Once Support taken, it creates a Bullish Break of Structure and creates a Bullish Fair Value Gap
1:1.8 R/R Bullish Trade Entry

NQ Update 24,816 - Funded Future's TraderMy target for EOD tomorrow. Obviously through future's you have the ability to follow these through options a bit better.
100% On all future callouts and option callouts. I stream live on YT everyday.
Ask about the indicator it's free.

$11,300 in 14 minutes!Trading isn’t hard.
Interpreting everything at once is.
This NQ trade wasn’t about predicting anything.
It was about confluence being clear enough to act without hesitation.
Trend, momentum, structure, and higher-timeframe context were aligned.
No mixed signals. No mental gymnastics. No second-guessing.
When multiple inputs agree, the trade becomes obvious.
Execution gets simple.
Management gets boring.
And exits stop feeling like guesses.
This is what happens when you’re not juggling indicators in your head, but reading one coherent market state instead.
Same market.
Same volatility.
Just organized context.
Clarity, bar by bar.

NQ Short (12-09-25)Basically same idea as Monday, not expecting much until Fed Decision. The O/N did use some failed auctions to pump the NAZ above nearside Danger Zone of 25,620-40 to upper resistance and KL 25,735, we are back under DZ at this time. Range today may be 630-730 for next move should the NAZ stay above 25,580, under play lower KL's.

NQ UpdateMFI touching oversold and RSI is close.
I did not short anything Friday because it might hit oversold Sunday night and reverse up. Also, Supreme Court decision on tariffs could happen as soon as this week, though most are anticipating end of the month or possibly Jan.
The market will pop big when it happens and wipe out puts in minutes, so I'm just going long when things get oversold.

Mastering the Morning Breakout: The New York 15m/30m ORB SetupThe first 15-30 minutes of the market are often pure chaos for novices, but for professionals, it is where the day's structure is built.
The **Opening Range Breakout (ORB)** works because it defines the "Initial Balance"—the battleground where buyers and sellers fight for control. Once price breaks this zone with conviction, it often signals the true trend for the rest of the session.
**The Problem:**
Most traders fail at the open because they chase volatility. They enter on wicks, get trapped by fake-outs, or miscalculate their levels manually.
**The Solution (Chart Breakdown):**
In this NQ example, we strip away the noise and focus on pure structure:
1. **Define the Battlefield:** We let the first 15 minutes pass, or 30 minutes if you wish to wait for more confirmation.
2. **Wait for range to form** Notice the breakout. We don't guess. We wait for a **Candle CLOSE** outside the box.
3. **The Trigger:** The "BULL/BEAR" label only appears when buyers have proven they can hold price above or below the range. This filters out the "wicks" that stop out early shorts.
4. **Precision Targets:** Instead of guessing where to take profit, we use the 1x and 2x measured moves based on the range's own volatility.
**Why this approach saves accounts:**
It forces objectivity. By automating the levels and waiting for the confirmed break, you remove the emotional "FOMO" that ruins morning sessions. You aren't predicting the move; you are executing on confirmed momentum.
*This setup is running on a free community tool. You can add it to your chart using the link below to automate your own morning levels.*

NQ Short (12-12-25)25,623 is Mid Level of recent range, we have seen 2 Long Trap lock ins that drop after Reg Session BTD/FOMO lifts into now a Gap open and lower O/N Session. Sometimes the Gut Feeling Indicator is the best. Orange TL seems to be the KL to watch. Yellow is lower and White is higher, the Edge Trades in opposite direction are working until a breakout. Looking for the same play today and waiting for the BTD/FOMO crowd to bail, I am pretty sure that Santa, Easter Bunny and Plus Plus Plus Plus Plus are not real.
NQ UpdateI didn't post a plot premarket because I figured it'd be misleading. MFI is way oversold but RSI isn't there yet. Should hit oversold tomorrow.

MNQ – Spazdaq bleeds greenMarket: Micro E-mini Nasdaq-100 Futures (MNQ)
Bias: Bearish
Timeframes: Intraday (15m/30m) with Daily context
Thesis
Price Made a Double Top when it reached within 25% of the November Highs.
After a Bounce around 23,908 Price attempted to re-enter the higher-timeframe uptrend but failed at key dynamic resistance, followed by impulsive downside confirmation. The rejection confirms lower-high continuation risk.
What I’m Seeing
Failed re-entry into the long-term trend channel on the daily
Double-top structure confirmed with rejection from upper fib zone
Intraday breakdown after a weak bounce (no sustained VWAP reclaim)
Bearish price action: shallow pullbacks, compressed structure, seller control.
Measured fib extensions lining up with logical downside targets
Key Levels
Bearish Invalidation if we Reclaim:
0D SMA with a daily close.
21D EMA with a daily close.
50D EMA with a daily close.
The Trade:
Short.
Downside Targets:
Target 1: ~24,888
Target 2: ~24,643
Extended: ~24,300 - 24,360 (Gap Fill)
Double Top Confirmed Targets:
Re - Enter Short upon action below 23,908.75
Execution:
Entry
Scaled. Hoping for bullish pullback into the NFP reports tomorrow morning.
SL:
~25,320.
Final Notes
This is a context-driven idea, not a signal. I’m watching price behavior around resistance, not predicting direction. Let price confirm.
If this breaks down cleanly, downside opens fast.
#MNQ #NASDAQ #Futures #PriceAction #DoubleTop #TrendFailure #IntradayTrading

NQ bouncing off .5 Fib from November low to Dec highExpecting a bounce here if NFP come in line or soft. 4hr RSI oversold. Some of the big tech names have some room to go up. Seasonality points toward a rally.
If NFPs/CPI this week come in hot I expect further downside. If they print in-line/soft my price targets are as follows.
TP1 - ~25378 NQZ
TP2 - ~25682 NQZ
TP3 - ~25870 NQZ
TP4 - ~26273 (Price target if we get a strong year end Santa Rally) NQZ
Looking for these moves to be made into the beginning of January.

NQ UpdateFutures are slightly green but NQ still looks like it wants to go oversold on RSI. Could be a whipsaw start to the week, but eventually that gap above will fill.
Probably won't have time to post premarket tomorrow. Still plan to go long if NQ RSI goes oversold.

NQ 24,958 TargetShorting NQ from the 35,317.5 or so will obviously need to adapt and adjust as time goes on reference my previous post for levels

NQ at Crossroads: AI Optimism Meets Auction Reality1. Macro Context and Narrative
The Nasdaq continues to trade at the intersection of macro-optimism and valuation sensitivity. The underlying narrative remains dominated by growth expectations, policy signaling, and the ongoing AI investment cycle. While rate volatility and geopolitical headlines continue to inject short term noise, the broader sentiment surrounding NQ remains constructive, albeit increasingly selective.
AI remains the central driver of price discovery in the index. Capital expenditure commitments tied to data centers, semiconductors, and cloud infrastructure continue to reinforce the long term growth narrative. Market participants have been willing to pay a premium for earnings visibility tied to AI monetization, particularly among mega cap constituents that dominate NQ weightings. However, as expectations rise, the market has become less forgiving. Each earnings cycle and macro headline is now filtered through a valuation lens, which has resulted in more two way trade and sharper rotations rather than one directional expansion.
This shift has created an environment where upside progress requires acceptance and follow through, while failure to hold value areas invites responsive selling. In our opinion, sentiment is no longer euphoric but remains optimistic, with positioning sensitive to both macro headlines and technical acceptance.
2. What the Market Has Done?
• The market spent August in a well defined consolidation range, building value and compressing volatility.
• In September, the market imbalanced higher out of that consolidation range and trended upward, reaching the 25400 area and printing new all time highs.
• On October 10, the market sold off sharply down to 24250, which aligned with the high of the prior consolidation range, as Trump renewed China tariff threats.
• Buyers responded at that level and the market balanced, forming bid block 1.
• The market then resumed its uptrend and made new all time highs as US China tariff tensions eased, supported by headlines around Trump and Xi meeting and confirmation of a trade deal.
• From the end of October through the rest of November, the market stalled at 26400, where sellers re entered and auctioned price lower toward 24709, which aligned with the bid block midpoint.
• Buyers attempted to reassert control and bid prices higher, but sellers stepped down offers at 25850, the level where they had previously taken control and drove prices lower through the bid block to 24000 which aligns with the top range of the consolidation range.
• Buyers responded again at 24000 and successfully auctioned price back up toward 25850.
• Over the past week, the market balanced within the December 1 weekly range and value area, but sold off on Friday and closed below the December 1 weekly low.
3. What to Expect in the Coming Week
The key level to watch remains the previous week’s settlement at 25213.50.
Bullish Scenario
• If the market is able to hold above 25213.50, I expect a move back toward the 25850 area, which aligns with composite weekly VAH and the weekly one standard deviation high.
• There is a high probability of two way repair within the prior week’s low volume area between 25213.50 and 25475, which aligns with the two week composite VAL, before continuation higher through the previous week’s value area toward 25828.50.
• If sellers fail to respond in that zone, the market could extend higher toward 26250, which aligns with the October 27 weekly VAH, and potentially toward 26444, the weekly two standard deviation high, to make new all time highs.
Bearish Scenario
• If the market is unable to hold above 25213.50, expect a move lower toward the November 24 weekly VPOC, where buyers should respond.
• Failure of buyers to hold there opens the door for continuation lower toward 24600, which aligns with the November 24 weekly low volume area and the weekly one standard deviation low.
• Further weakness could target the 24400 area, which aligns with a key daily support level.
Neutral Scenario
• If the market lacks volume, and velocity while attempting to move above 25500, which aligns with the prior week’s value area low, or below 24600, which aligns with the November 24 weekly VPOC, expect two way rotation and balance to develop.
Conclusion
In our opinion, NQ remains structurally strong, but the market is no longer forgiving. Acceptance and follow through are required for upside continuation, while failure to hold key value references continues to invite responsive selling. With AI optimism still intact but valuations elevated, the index is increasingly dependent on auction quality rather than narrative alone. As always, context, acceptance, and participant response at key levels will define the next leg.
What is your take on NQ for the upcoming week? Please drop a comment and give a boost so that more from the community can join in the conversation.
Disclaimer: This is not financial advice. Analysis is for educational purposes only; trade your own plan and manage risk.

NQ levels BearishTake a look at my charts and levels I call things ahead of things and see action before it happens
