NASDAQ 100 E-mini Futures
No trades
Market insights

Nasdaq reqdy for new all time highsChart looks great .
I think there is another push to the upside .
Equities together with crypto will have another run.

NDX - DONT HURT ME NO MORE!Good Morning,
Hope all is well. NDX !!! Don't hurt me no more. Nope! We saw this coming from quite a distance away. I first observed a pull-back coming into effect on a shorter time frame and have since charted it on longer time frames.
Lets get down to basics. The markets had a phenomenal run this year, there can only be so much confidence in something before people start to get weary. That is exactly what we have here. Currently are we finished the pull-back? No - Are we going to dive into a reversal?, unlikely. There is still a very long way to go until we hit that point.
My TFSA has been limited at this point, I am not buying much and am holding a 75% cash reserve. My other two accounts are swing and day trade accounts so I do not bother and instead play the positions when opportunity arises.
Trade Safely!
Enjoy!

NQ1! 4HR Setup – EMA 100 + Divergence Structure📊 NASDAQ 100 Futures (NQ1!) – 4HR Chart
- Entry: 24,893
- Stop: 25,398
- Target: 24,403
🧩 Structure:
- Descending channel breakout potential
- EMA 20 touch + divergence structure
- Hidden divergence confirmation on stochastic

NQ Power Range Report with FIB Ext - 11/18/2025 SessionCME_MINI:NQZ2025
- PR High: 24954.50
- PR Low: 24882.00
- NZ Spread: 162.25
No key scheduled economic events
Session Open Stats (As of 12:35 AM)
- Session Open ATR: 475.50
- Volume: 67K
- Open Int: 291K
- Trend Grade: Long
- From BA ATH: -6.3% (Rounded)
Key Levels (Rounded - Think of these as ranges)
- Long: 26636
- Mid: 25410
- Short: 24039
Keep in mind this is not speculation or a prediction. Only a report of the Power Range with Fib extensions for target hunting. Do your DD! You determine your risk tolerance. You are fully capable of making your own decisions.
BA: Back Adjusted
BuZ/BeZ: Bull Zone / Bear Zone
NZ: Neutral Zone
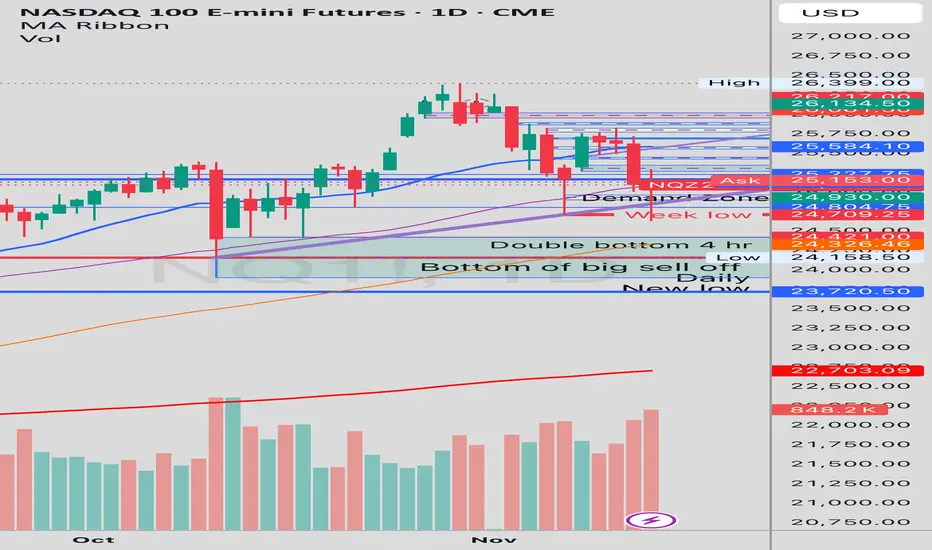
4HR NQ – Attempting a New Direction4HR NQ – Attempting a New Direction (For Educational Purposes Only)
This analysis is shared strictly for educational purposes and is not financial advice. It is intended to illustrate chart-reading techniques, structure mapping, and scenario planning.
Bullish Scenario – Potential Uptrend Zone
The chart outlines a clearly defined uptrend continuation area:
A green expansion zone highlights the upside target region toward 25,891.50.
A –1% risk bubble shows the approximate drawdown tolerance for a long bias.
A break and sustained move above 25,591.50 (white dotted line) would strengthen bullish momentum.
The yellow dashed line above represents a major resistance area that the market must reclaim to shift direction convincingly.
Bearish Scenario – Potential Downtrend Zone
The lower side of the chart maps the downside continuation possibility:
A red zone defines the bearish target area toward 24,704.75.
A –1% risk bubble marks the downside tolerance for a bearish setup.
Losing the central grey zone opens the path toward the deeper support band, signaling continuation of downward pressure.
Pattern & Symmetry Structure (Educational Highlight)
On the left side, the chart features a harmonic/symmetry-based analytical framework used for pattern recognition:
A boxed structure spans 22 bars, with two vertical 8-bar segments forming time symmetry.
Two 2.14% price swings mark the upper and lower rotational boundaries.
Curved arcs and diagonals are used to visualize price rotation, volatility compression, and potential reversal points.
This section is included to demonstrate how symmetry and measured movements can support probabilistic forecasting in technical analysis.
Neutral Decision Zone (Market Pivot Area)
The central grey band represents the equilibrium zone, where buyers and sellers are in temporary balance.
Price is currently interacting with this zone, making it the key decision point.
Orange blocks above and below may indicate smaller supply/demand pockets or micro-imbalances.
A directional break from this zone typically sets the next short-term trend.
Summary Market at a Critical Turning Point
Above the grey zone → momentum favors the green uptrend zone.
Below the grey zone → momentum favors the red downtrend zone.

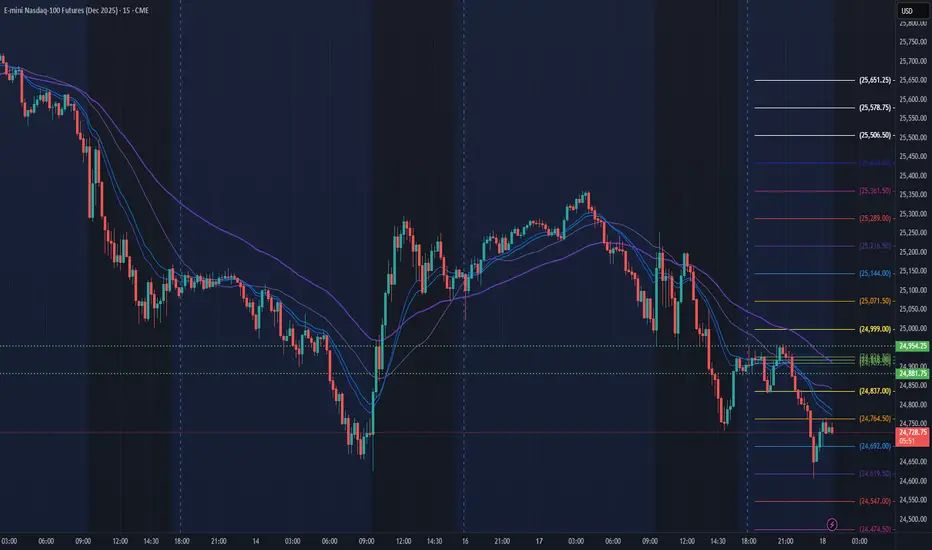
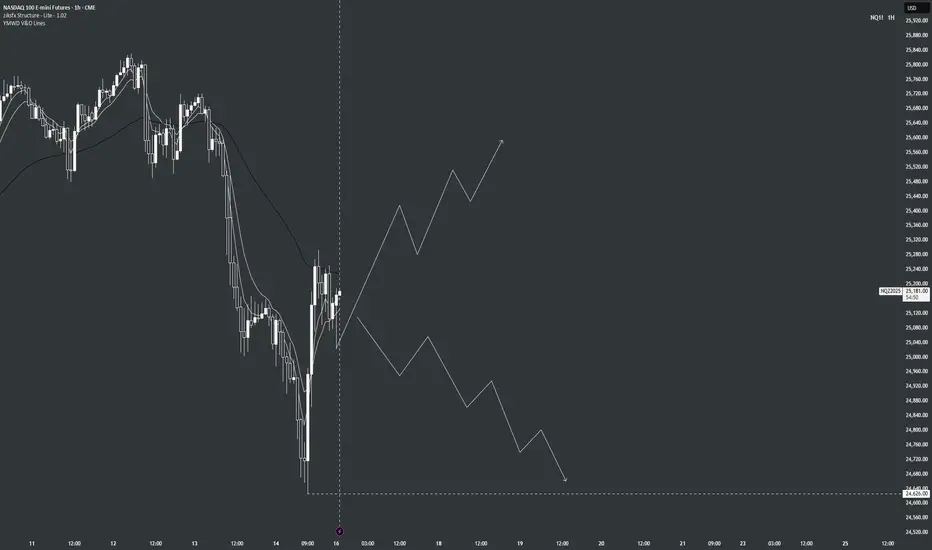
NQ Daily Outlook | November 18, 20251H timeframe — 50 EMA (black) for trend, 5 & 10 EMAs (white) for momentum/BOS.
Quick read: Still under the 50 EMA after a bounce. Whites are curled down; structure is lower‑high/lower‑low.
Two scenarios I’m watching
Bearish trend (favored): Stay under the whites and reject the 50 → print BOS down → ride impulse down, sell pops into the whites.
Bullish trend: Reclaim the whites, push and hold over the 50 → print BOS up → impulse > shallow correction > continuation higher.
Bias: Leaning bearish while we’re below the 50 with no upside BOS. I flip long only after we clear a lower high and hold above the 50 EMA.

NQ UpdateClosed out most of my puts, but did not go long. NQ hasn't hit oversold yet, look at the MFI.
Gap direction will depend on FDAX which is oversold and at support. If it breaks support, indicators won't mean much.
NVDA earnings Wed AH, jobs report THU premarket, Fed minutes Thu.

Tuesday NQ looks good for big trades againIn following the HTF on previous post. If downside is going to continue, we have these 2 options for today.
1st is the 80% trade to fill yesterday's open VA, which keeps us inside the area of not invalidating the downside trade. With the way Vol has been, it will probably happen overnight, and we will miss the upside. For the downside the .5 entry with TP at .25 being a must to protect profit from another bounce out of the support zone. Hold runners and hope this is the time we crack it. Prefer this way of breaking the support.
2nd is the pdVAL holds us down, and we break through the support. If this happens, prefer it happens around RTH open. Otherwise, safer to wait for a solid closes below that level to not get trapped.
Top of fib pull invalidates.

Buried Treasure MapPicture Buy the Dip areas as not so hidden pirate treasure.
Here is one of this trader's favorite BTD setups. A bounce:
1.In a green shaded BTD area aka accumulation/distribution area
2.Exhaustion Candle: 5m chart, 10:05 candle
3.White bullish candle,10:10 candle
4.@ prior day's close
5.@ prior vpoc
6.Double Bottom
7.9:30 White Tail with bigger than usual volume
8.As you can see, the more supports the better chance of success.
His Buy the Dip Trade Plan
1.Buy 1 MNQ contract @ top of BTD area 25145
2.Buy 1 MNQ contract every 5 points - 25140, 25135, 25130... all the way down to the low of the BTD area 25070.
3.21-point target per entry
4.No stop loss
5.If some entries fx and the 21-point exit doesn't, he simply holds until it does. Ultimately, in this bull market, nearly all hit their targets.
His goal is five a day. Somedays he gets none. Somedays twenty or more. This year he has far exceeded that goal.
On a good setup like the one above you will find that nearly 100% will be round trips - meaning they will hit their profit targets.
Make it your own. Buy 1 every 10 points. If you want to buy the most successful zone of the BTD area, divide the area into thirds and buy only the middle third. Caveat: that middle third is simply his experience. It is not a result of a scientific study. Perhaps someone more skilled with such a study will do a back test and provide us with the results. If you want to use a stop by all means use one.
Always be careful. Sometimes the Px will continue to fall. Always save dry powder for that event because it does happen. The above setup is far less likely to fall than others.
Always trade with an ear to the news. News events can and do turn markets.
Most importantly of all - use your good common sense.

Macro trade again, trading view laggingA buy of 20 points, which worked but tradingview didn't put it on.

NQ – Today’s High-Probability Setup 11/17/2025Market popped, got smacked, and is bleeding right back into imbalance, classic setup. I’m looking for it to run stops first before giving the real bounce. Any little pullback is just ammo for the next push down. Let it flush, then we sniper the reversal.

NQ Long Setup at 24,765: Strong Buyer ZoneNQ created a strong support at 24,765 after a sharp rejection of lower prices. A heavy volume cluster formed right where buyers stepped in, and a wide fair value gap confirms strong buying aggression. The beginning of this FVG marks the key reaction level. Waiting for a pullback into 24,765 offers a clean long setup with solid confluence.

Bullish Continuation After Strong Rebound From FVG DemandCME_MINI:NQ1! has successfully rebounded from the Fair Value Gap (FVG) demand zone at 25,150–25,220, confirming this area as a strong short-term base for buyers. The earlier sweep of multiple SSS (sell-side liquidity) levels around 24,850–24,900 seems to have cleared out weak hands, allowing the market to rebuild a bullish structure.
With the FVG now acting as a defended demand zone, bullish momentum is beginning to form. The recent rejection from the lows and the shift back above short-term structure indicate that buyers are reclaiming control.
As long as NQ holds above the FVG demand, price is well-positioned to extend higher toward:
25,450 (first reaction point)
25,600 (continuation target)
25,750–25,820 (major supply zone + previous rejection area)
A higher low above the FVG would further strengthen the bullish outlook and signal continuation toward the upper supply. Current flow favors a sustained push upward as long as demand continues to hold.

NQ Power Range Report with FIB Ext - 11/17/2025 SessionCME_MINI:NQZ2025
- PR High: 25188.25
- PR Low: 25022.00
- NZ Spread: 372.0
No key scheduled economic events
Session Open Stats (As of 12:35 AM)
- Session Open ATR: 458.87
- Volume: 48K
- Open Int: 290K
- Trend Grade: Long
- From BA ATH: -4.2% (Rounded)
Key Levels (Rounded - Think of these as ranges)
- Long: 26636
- Mid: 25410
- Short: 24039
Keep in mind this is not speculation or a prediction. Only a report of the Power Range with Fib extensions for target hunting. Do your DD! You determine your risk tolerance. You are fully capable of making your own decisions.
BA: Back Adjusted
BuZ/BeZ: Bull Zone / Bear Zone
NZ: Neutral Zone
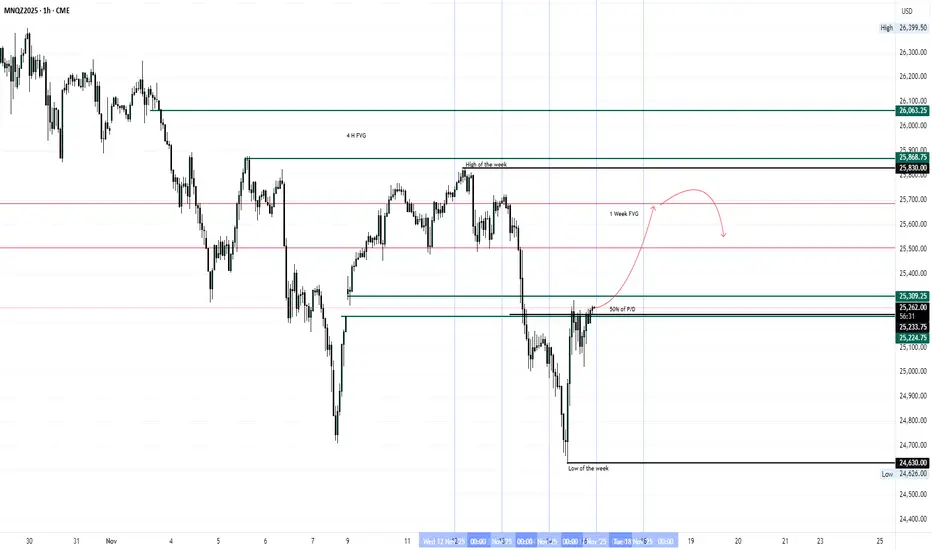
POSSIBLE FORECAST MNQZ2025 17-21 NOV 25 This week will probably have a very good opportunities 25700 and 25300 we have to see if it's possible to reach the high of the week 25900 search for the bullish scenarios
NQ UpdateAlgos pumping futures despite all other markets being red. A bit surprised they can do that.
I don't think the market selloff is over, maybe we just repeat last week?
Not sure how much trading I'm gonna do this week, feeling too bearish maybe. You get yourself in trouble if you lean too much in either direction.

NQ Long - 17/11/2025Candle 2 formed on daily timeframe, confirmed by 1hr CISD. Looking for expansion in candle 3; targeting internal fair value gap.

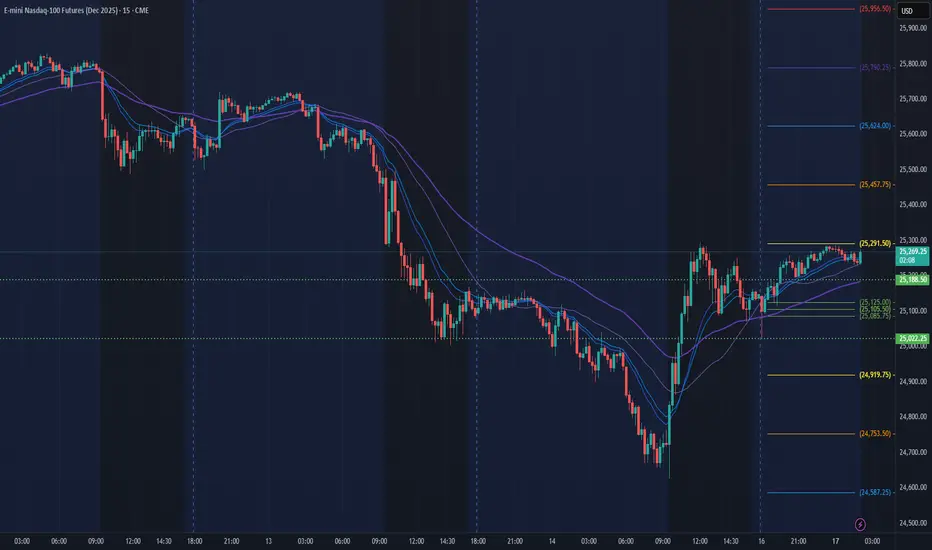
NQ Weekly Outlook | November 17–21, 20251H timeframe — 50 EMA (black) for trend, 5 & 10 EMAs (white) for momentum.
Two scenarios I’m watching
Upper path (bullish): Hold above the white EMAs, reclaim and stay over the black 50, print BOS up → ride impulse > shallow correction > continuation higher.
Lower path (bearish): Reject at/under the black 50, lose the whites, print BOS down → impulse down > corrective pop into the whites > continuation lower.
Bias: Leaning bullish if we reclaim/hold above the 50 with an upside BOS. If we stay capped under it and BOS down prints, I’ll follow shorts.
Bitcoin Is Crashing… Nasdaq Still at Highs. Who’s Lying?For years, Bitcoin and the Nasdaq 100 have shown consistently high correlation, driven by the same macro forces:
• global liquidity cycles,
• risk appetite,
• real-rate expectations,
• and flows into high-beta growth assets.
Both are classic risk-on instruments—they benefit when liquidity expands and suffer when uncertainty rises.
However, the chart above shows a significant decoupling over the past weeks:
🔻 BINANCE:BTCUSDT : Deep Correction & Negative YTD
• Down more than 25% from the highs
• Trading –5% YTD in USD terms
• Volatility expanding and long liquidations accelerating
• Risk sentiment turning sharply lower within crypto
🔺 LSE:NQ11 : Near All-Time Highs
• Still hovering close to ATH levels
• Posting +16% YTD in USD
• Supported by strong earnings, mega-cap tech flows, and continued growth leadership
⚠️ This divergence is unusual — and historically meaningful
BTC and Nasdaq rarely disconnect to this magnitude without one of two outcomes:
1️⃣ Bitcoin Is Leading the Next Risk-Off Move
Crypto often reacts faster to changes in liquidity conditions and risk appetite.
If this is another leading signal, equities (especially high-beta tech) may follow with a lag.
2️⃣ Correlation Break Is Temporary
If the move was primarily crypto-specific (liquidations, funding resets, derivatives unwinds),
BTC could mean-revert upward as flows stabilize.
📌 Our View
Historically, when divergences of this scale have appeared:
Bitcoin leads, equities follow.
The magnitude of BTC’s correction vs the Nasdaq’s resilience suggests that:
👉 BTC may be pricing in a shift in risk conditions ahead of equities, not the opposite.
The key question for the next weeks:
Is the Nasdaq ignoring a message that crypto is already discounting?

#202546 - priceactiontds - weekly update – nasdaq e-miniGood Evening and I hope you are well.
comment: Again, not much difference to dax. Also in a triangle and for now I highly doubt we will see a big range expansion out of 24600 - 25500. We had two weeks where the bears showed strength but what do they have to show for? We closed above 25000 in both weeks. That’s still as bullish as it gets. Only a bearish daily close below 24600 could change my outlook.
current market cycle: trading range 24000 - 26500 / 4h chart it’s a triangle 24700 - 25500
key levels for next week: 24500 - 25500
bull case: Bulls bought 24700 heavily again and closed the week above 25000. Bears can have no confidence in shorts when we rally for 667 points after a 1095 point drop. Problem for the bulls is that they also have to be very careful with buying high again since the downside can be huge. Which will likely mean that we won’t see much interest in buying above 25400ish. Even longing 25000 when we can drop down to 24600 or lower, is a tough trade.
Invalidation is below 24709.
bear case: Every dip is heavily bought. Has not changed. Can only become more bearish with a daily close below 24000 and that’s far. 25830 is likely the stop, most bears have to have for most shorts next week. That’s a big range and it any short below 25300 from being decent imo. We are making lower highs and lower lows but the lower lows just barely. Until that changes, we will most likely continue sideways in the given range.
Invalidation is above 25830.
short term: Neutral around 25000. Short closer to 25700 and longs closer to 25600.
medium-long term - Update from 2024-11-02: Market went further in the wrong direction so my targets become increasingly unrealistic. Right now the 50% retracement is 21750 and would mean a 18% drop. That’s a bit too much to ask for as of now. 24150 is the breakout-retest of the prior ath from 2024-12 and a more realistic target.

Weekly outlook on NQ, ES and Dow. Index Triad NYSEThis week will be a tricky one. I need more data to understand about the expansion on the weekly. We will take it on a day to day basis after each daily closures

Would you consider this a H&S break on NQ?Would you consider this a H&S break?
I know things are volitile and wierd right now...which makes me think that this could be a weird looking H&S. Remember, the patterns show us an idea, a story. Does this tell the story to you? It shows what an H&S shows. It is just sloppy because of volitile movements...