Trade ideas

NQ - August 22, 2025 - lunchtimePowell's comments at Jackson Hole symposium sent the market soaring.
FUNDAMENTALS : Powell signalled being more concerned about employment and leaned towards the idea that tariff driven inflation wouldn't persist. Result, markets are now pricing in a rate cut for September.
TECHNICALS : If the daily closes above 23,400 its looking good for the bulls.
Good trading :)

NQ Short (08-18-25)Friday did not lift and the O/N is at low, look for anu reg session selling to gain some strength under the DZ. Looking for 400 point range this week and break lower can move 1,000 points under the DZ. Expect Tricks/Tweets (damage spin) and more Tweets early this week. Low volume buying should turn into high volume selling. Washington Street Asset Management will have its work cut out over the next month or so and may be why we got propped up.

NQ - August 22 2025 - Before the open
So yesterday was an inside day, which means we traded inside the previous days range (failed to break previous days high or low).
23,000 is a very strong support. If it breaks with conviction there is no real support until about 22,500.
FUNDAMENTALS : I think we will need a strong fundamental reason for 23,000 to break down. Something such as Powell saying they wont cut rates in September. The market is keeping an eye on inflation data and employment because these will determine if they cut or not.
Rate cut scenarios:
1. If inflation spikes due to tariffs as we saw in most recent PPI report, I think they may hold rates.
2. If employment drops a lot (bad NFP report, most importantly unemployment rate goes up) that may force them to cut in September.
3. If inflation drops near 2%, they will likely cut in September regardless of if employment data is good or bad.
***Keep in mind the market is sort of expecting inflation due to tariffs, so if inflation holds steady or is slightly better than expected that maybe enough for them to cut in September.
TECHNICALS : So far we have strong buying near 23,000 level but for the last 3 days buyers are lacking conviction at lower and lower prices. (Selling near 23,300).
Good trading :)

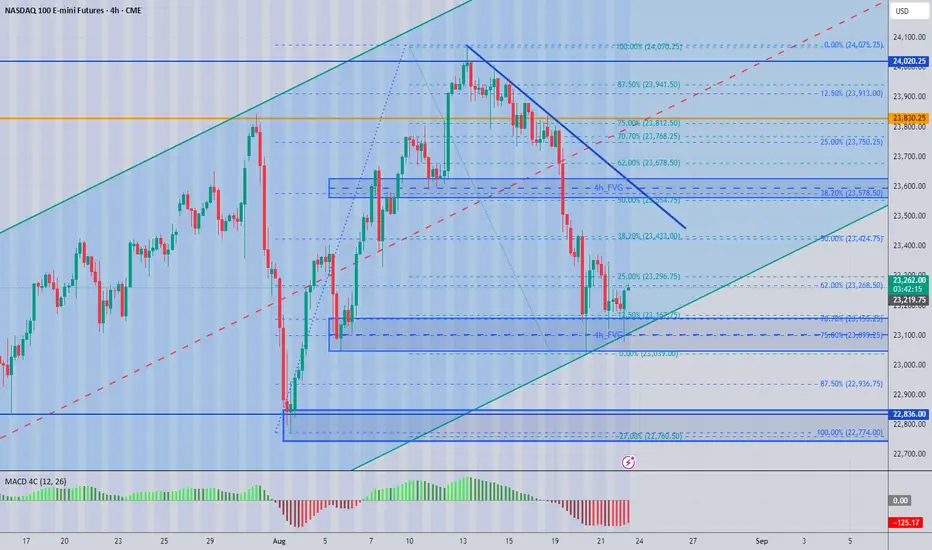
NQ Levels and set up for today With Jackson Hole upon us, we're going to get some explosive moves. I have mapped out my thoughts on the 4H chart. Good luck, be careful out there
NQ Power Range Report with FIB Ext - 8/22/2025 SessionCME_MINI:NQU2025
- PR High: 23250.25
- PR Low: 23223.25
- NZ Spread: 60.5
Key scheduled economic events:
10:00 | Fed Chair Powell Speaks
Session Open Stats (As of 12:35 AM 8/22)
- Session Open ATR: 283.49
- Volume: 20K
- Open Int: 280K
- Trend Grade: Long
- From BA ATH: -3.6% (Rounded)
Key Levels (Rounded - Think of these as ranges)
- Long: 24382
- Mid: 23239
- Short: 22096
Keep in mind this is not speculation or a prediction. Only a report of the Power Range with Fib extensions for target hunting. Do your DD! You determine your risk tolerance. You are fully capable of making your own decisions.
BA: Back Adjusted
BuZ/BeZ: Bull Zone / Bear Zone
NZ: Neutral Zone
21 August 2025took 1 trade today. Missed couple of trades but capital preservation is more important.
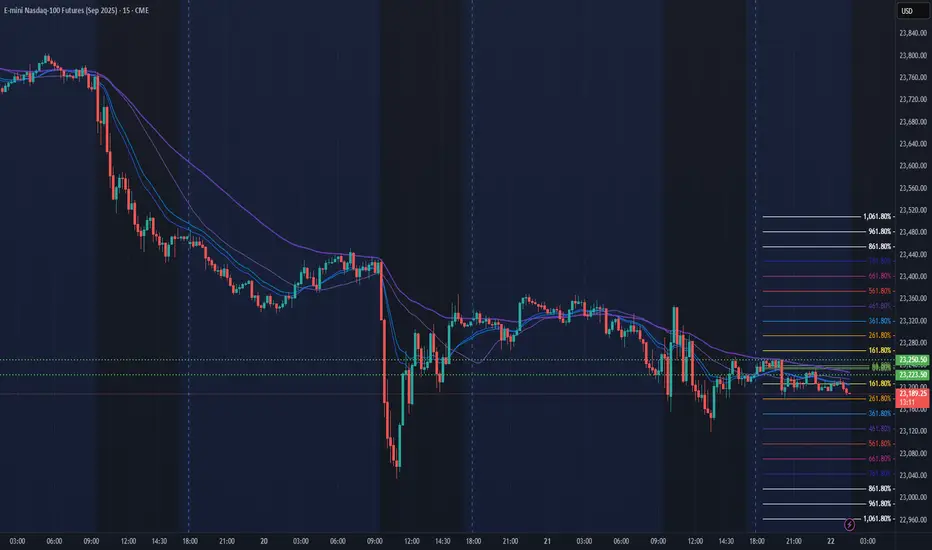
5min inversion targeting PXH

NASDAQ (NQ1!): Started Retracing Last Week. Will It Continue?Welcome back to the Weekly Forex Forecast for the week of Aug 18 - 22nd.
In this video, we will analyze the following FX market: NASDAQ (NQ1!) NAS100
The NASDAQ reached ATHs Tuesday, and retraced for the rest of the week. Will there be some
follow through to open next week? Wait for the market to tip its hand and show you strength or weakness.
If the highlighted +OB fails, look for sells.
If the OB holds, buys until a bearish BOS takes place.
Enjoy!
May profits be upon you.
Leave any questions or comments in the comment section.
I appreciate any feedback from my viewers!
Like and/or subscribe if you want more accurate analysis.
Thank you so much!
Disclaimer:
I do not provide personal investment advice and I am not a qualified licensed investment advisor.
All information found here, including any ideas, opinions, views, predictions, forecasts, commentaries, suggestions, expressed or implied herein, are for informational, entertainment or educational purposes only and should not be construed as personal investment advice. While the information provided is believed to be accurate, it may include errors or inaccuracies.
I will not and cannot be held liable for any actions you take as a result of anything you read here.
Conduct your own due diligence, or consult a licensed financial advisor or broker before making any and all investment decisions. Any investments, trades, speculations, or decisions made on the basis of any information found on this channel, expressed or implied herein, are committed at your own risk, financial or otherwise.

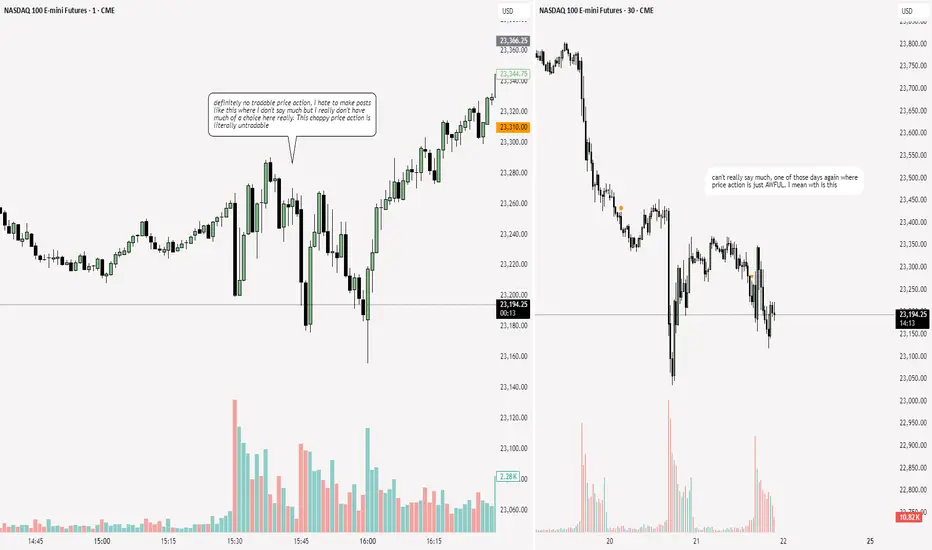
NQ: 239th trading session - recapNot much to recap. Ignore this post - price action was horrible. If this would be like a Watch Mojo top 10 tier list for worst price action ever then this day would definitely be in the top 5
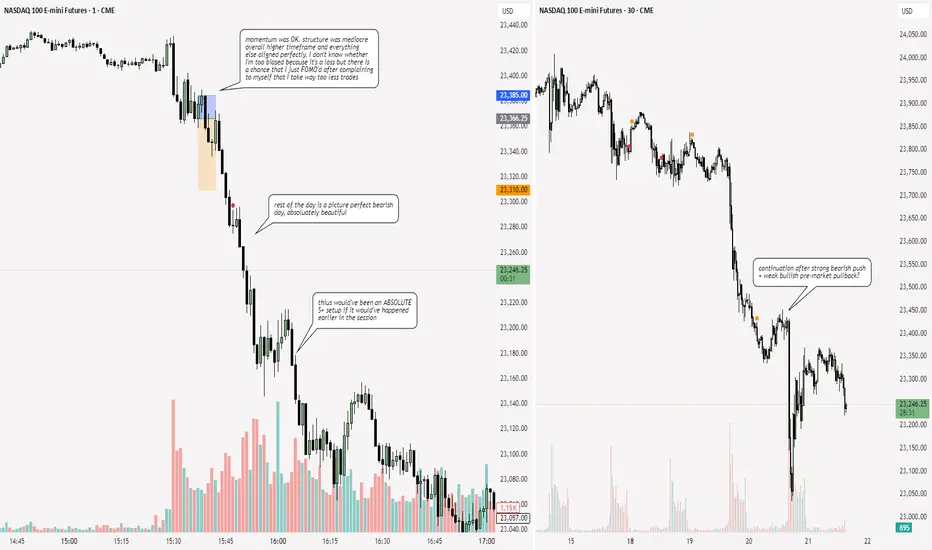
NQ: 238th trading session - recapPosting this late on purpose - needed to reflect and istg I'm NOT biased: This setup was mediocre, and I payed the price for taking it
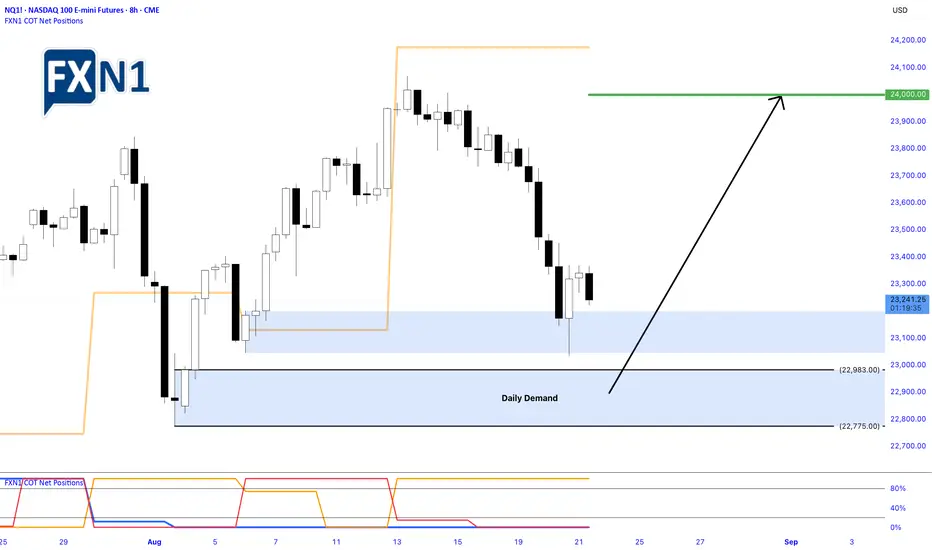
Nasdaq Bounces Off Demand Zone: Opportunities for a Bullish Rev.Yesterday, the Nasdaq experienced a notable rebound from the daily demand zone around 23,201, signaling buying interest at that level. However, as the EU trading session commenced, the index quickly shifted to a bearish impulse, reflecting ongoing market uncertainties and cautious sentiment among traders.
Key Levels and Opportunities
Despite the short-term pullback, the chart presents a compelling opportunity for traders to consider a "buy low" approach near the next demand zone at approximately 22,983. If the market finds support there, it could set the stage for a recovery, with the potential for the Nasdaq to rally back toward the 24,000 mark or even higher.
Market Outlook and Analyst Projections
Analysts remain optimistic about the index’s prospects, with many projecting a strong finish to the year. The Nasdaq, known for its volatility and lucrative trading opportunities, continues to attract traders seeking to capitalize on its upward momentum. As always, projections are optimistic, but the current technical setup suggests that there could be a favorable risk/reward ratio for those willing to position for a rally.
Final Thoughts
In a market characterized by rapid shifts and unpredictable moves, identifying key demand zones and monitoring reaction levels is crucial. The upcoming sessions could provide a prime entry point for those looking to buy dips, with the potential for the Nasdaq to forge ahead into the year’s final stretch with gains.
✅ Please share your thoughts about NQ1! in the comments section below and HIT LIKE if you appreciate my analysis. Don't forget to FOLLOW ME; you will help us a lot with this small contribution.
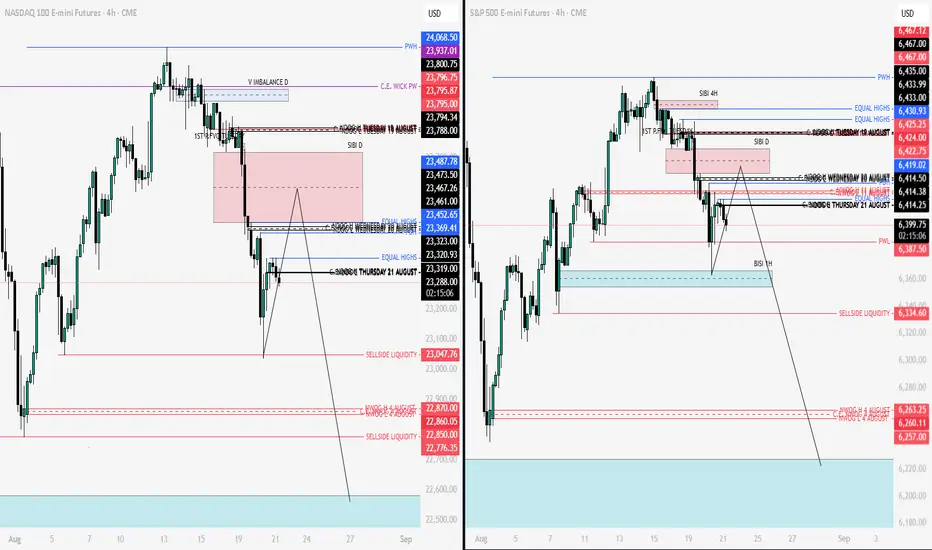
Nq & Es Key levels & Scenarios 21-08-2025Good morning everyone,
My overall bias remains bearish, but at the moment we are trading within a discount area. This means that with the market open at 09:30 NY time, we may see potential high-probability long setups, with the main target being the SIBI on the daily chart.
So while the broader bias is to the downside, it is important to also take advantage of short-term moves to the upside, as price may need to rise first before continuing lower.
Wishing you all a successful trading session.
⚠️ Disclaimer: This analysis reflects personal market observations and is for educational purposes only. It does not constitute financial advice.
DG rundown of a trade setup and bottoming processAs always the focus shall be on two timeframes : In the chart above (NQ September contract), the daily TF is on the left and 60M TF on the right. We have inserted manually key weekly and monthly levels (HTF terminations) in order to monitor/confirm a potential bottoming process. This is done automatically with the All-in-one indicator.
The bottoming process is defined as a first close above the upcoming or “live” EBOT. Remember also that a Zone/Area holds when the close is in the Zone/Area. And only then Area 1 needs to become strong support, then Area 2 needs to follow by becoming support.
You can see on the hourly chart how the first candle demonstrated a strong down flow (long range; huge distance between open and close; close almost at extreme).
As we are not at a key HTF area but in between, we do nothing and wait for the close. The hourly will need 2-3 hourly candles closes before confirming a bottoming process (2-3 rule on all timeframes). Price is also far away from the PLdot so we also need to wait for the PLdot to "catch up" with price.
Second hourly candle is also down with good flow, albeit smaller range so potentially first indication of minor change of flow, reaching key terminations (weekly and monthly) and closing below the upcoming EBOT so no bottoming yet.
However, the PLdot is “swinging” downwards which could be interpreted as a first sign of an exhaust. Both of candle 1 and 2 are c-waves down.
Next candle is finding support @ key HTF areas and closes above the upcoming EBOT and stops the c-waves down. This candle also allowed the PLdot to catch up with the price.
This candle goes for the PLdot refresh, first to the live EBOT, then static EBOT then the live PLdot and finally static PLdot which confirms the refresh of new energy that pushes the price to close lower than the static PLdot almost at the place of the live PLdot. Remember how the closes are always important and how the live energy is always most relevant at the end of the time frame – for the hourly candle that would be in the last 30-15 minutes before the candle closes. So, a first safe entry would be LONG at the close of this candle. The conservative stop loss could be the static EBOT while another option would be the live EBOT.
A more aggressive entry would be to go down to the 5 minutes timeframe and monitor around the HTF terminations the flow there and notice the spot where the c-waves stop (yellow box). Stop loss would be the blue line in this case.
The fourth candle is a congestion entrance candle that provide a target of two PLdots back around 23362 which aligns with the daily static EBOT. This would be the target for the trade.
The fourth candle closes below the ETOP so no c-waves yet, and the candle afterwards manages to close above the PLdot, still confirming the trend and finally
the fifth candle starts a c-wave, hits the planned target
Duration in trade - 4h (four candles after entry).
What is next:
We are in a daily PLdot refresh coming from the static EBOT. Either the refresh fails to break static EBOT and the daily down c-wave continues. The 60 minutes needs to start up c-waves in this area in order to confirm up-flow, otherwise the daily needs to have the 2-3 candles (2-3 days) to confirm bottoming. Daily is still in a c-wave down. As you can see, the daily needs to go through exactly what the hourly did in this example in order to start its bottoming process.
You can use this on any timeframe, monitor and learn.

NQ Power Range Report with FIB Ext - 8/21/2025 SessionCME_MINI:NQU2025
- PR High: 23342.50
- PR Low: 23313.25
- NZ Spread: 65.25
Key scheduled economic events:
08:30 | Initial Jobless Claims
- Philadelphia Fed Manufacturing PMI
09:45 | S&P Global Manufacturing PMI
- S&P Global Services PMI
10:00 | Existing Home Sales
Session Open Stats (As of 12:25 AM 8/21)
- Session Open ATR: 289.20
- Volume: 29K
- Open Int: 280K
- Trend Grade: Long
- From BA ATH: -2.9% (Rounded)
Key Levels (Rounded - Think of these as ranges)
- Long: 24382
- Mid: 23239
- Short: 22096
Keep in mind this is not speculation or a prediction. Only a report of the Power Range with Fib extensions for target hunting. Do your DD! You determine your risk tolerance. You are fully capable of making your own decisions.
BA: Back Adjusted
BuZ/BeZ: Bull Zone / Bear Zone
NZ: Neutral Zone
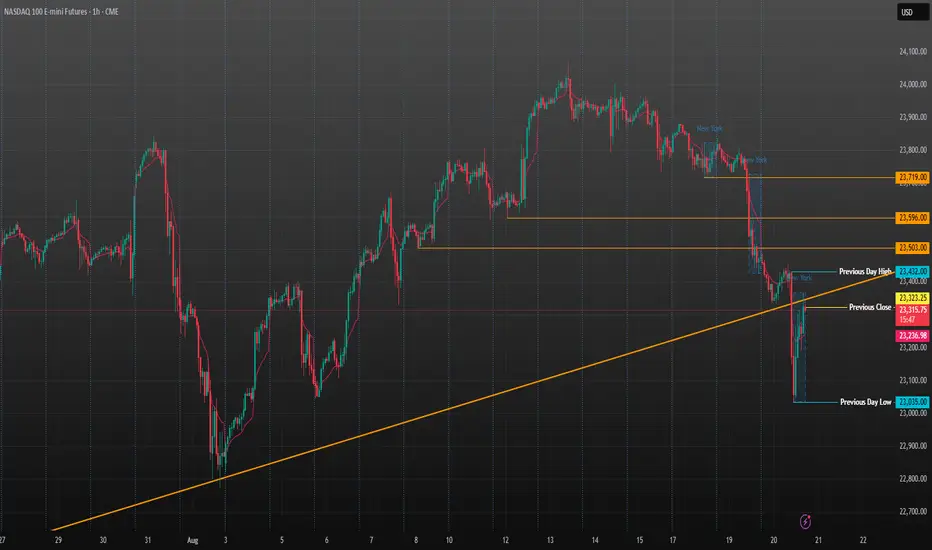
NQ - 2025 August 20 after the close
If we regain the downtrendline we go back to restest 23,500 and if we cant hold above the trendline we will try to retest todays lows.
Seeing how quickly the dip was bought back today I would lean towards a break back above the downtrend and retest of 23,500.
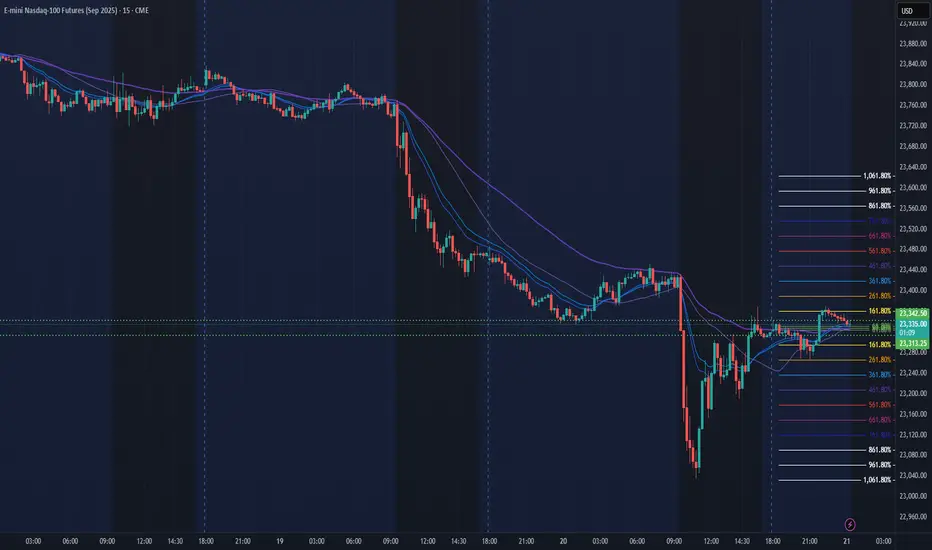
Nq Long OpportunitiesPrice found support at a cluster slightly lower than the one I highlighted this morning. It then broke through the blue zone (BISI) and moved down to the daily low.
Once that level was taken out, notice the strong reaction: price quickly reversed to the upside, providing an excellent long opportunity for a profitable trade.
⚠️ Disclaimer: This analysis reflects personal market observations and is for educational purposes only. It does not constitute financial advice.

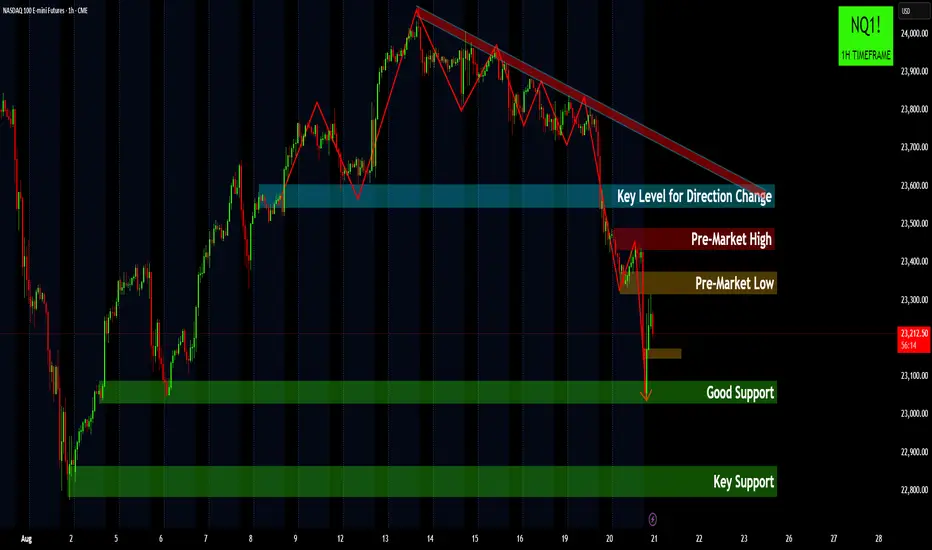
NASDAQ 100 Futures: Bearish Momentum Accelerates Below Key LevelThe NASDAQ 100 Futures are in a confirmed downtrend , having decisively broken below the critical 23,600 "Key Level for Direction Change." Price is currently targeting the "Good Support" zone around 23,100, following a rejection from recent "Pre-Market Highs" and "Lows."
E mini Nasdaq 100. NYSE. 20.08.2025, WednesdayCME_MINI:NQU2025
Outlined the daily Institutional Order flow. And the Market Efficiency Paradigm

DG Rundown on NQ Trade – Key Points to RememberTip 1: Focus on Two Timeframes
Prefer swing trading. Zoom out. Use weekly as your focal timeframe and daily to understand what the weekly is doing in terms of strength, support, and resistance.
In the chart above (NQ September contract), the weekly is on the left and daily on the right .
We start with last week’s analysis by answering:
1. Where is price?
The weekly candle closed in Area 5 , below the upcoming EBOT . Closes are key in DG.
2. What is it doing?
(Is there a weekly/monthly top/bottom? How many days are left? What’s the envelope direction? Is PLdot swinging? Is flow shifting? Is it entering congestion, continuing a trend, or exhausting?)
Price had been in a c-wave for the last two weeks, closing above ETOP.
First August candle showed strong upward flow : wide range, close at the extreme, PLdot slope increasing, and opposite to July’s down candle.
That August candle negated July’s down flow and was confirmed by the second August candle.
This flow also reshaped the channel structure .
Tip 2: Structure Holds When No Lower TF C-Waves Start
When a candle closes in Area 5, exhaust zone, or higher, the next candle often treats that zone as support instead of resistance. That’s what happened with the s econd August candle – it found support and pushed higher.
However, that same candle closed below the upcoming ETOP , which is a key warning.
Tip 3: A Zone Holds When the Close Is in the Zone
Price attempted to push above Zone 5 but was rejected, closing back in Area 5. That meant Area 5 was holding and flipping downwards .
Flow also shifted: smaller range, closer open/close, no close at extremes.
In DG, a topping pattern unfolds in 3 steps (3 candles on weekly):
Touch exhaust upper limit + close in exhaust
Bounce from ETOP but no exhaust close
Reject from Area 5 + close below upcoming ETOP
By this definition, NQ’s weekly chart may be in a topping process, with ETOP now likely acting as strong resistance.
3.What’s Next?
We could expect a rollover to the downside at least for a PLdot refresh .
Daily Price Action
Friday’s candle = Congestion entrance with a projected target ~23,722 (2–3 Pldots back).
Monday’s candle hit that target but failed at the daily PLdot.
Tuesday’s candle touched the daily static PLdot again and confirmed the downward flow → a daily c-wave down.
Daily action confirms that for the weekly to top, the daily must print c-waves down – and that’s what we’re seeing.
Tip 5: 60-Minute C-Waves Are Key for Flow
Flow shifts usually start on lower TFs, but 60m is the most reliable.
On the hourly, the down flow slowed at the weekly static PLdot.
Confirmation came when 60m candles failed to close above ETOP – meaning the flow was still down.
The 2–3 candle rule for topping/bottoming applies to all timeframes.
Tip 6: LTF C-Waves Can Break HTF Terminations
When a higher timeframe level (PLdot, ETOP, EBOT) breaks, velocity increases and candle ranges expand.
Here, 60m c-waves broke the weekly PLdot, driving price lower into the weekly EBOT area.
What’s Next? (Scenarios)
Bottoming begins only when:
Area 1 (Exhaust) becomes strong support,
Then Area 2 becomes strong support.
This usually triggers only a PLdot refresh , which may occur at EBOT, live PLdot, or static PLdot.
If the refresh fails to break static EBOT, the down c-wave continues.
If daily channel bottom acts as resistance, 60m must first exhaust and re-enter its channel before a retrace or further breakdown.
What happens after the PLdot refresh is decisive for the next move (“definition of done”).
Entry idea:
When 60m looks like it’s bottoming at a key daily area → drop to 15m/5m for entries.
Time Element – Crucial for Execution
Big moves tend to align with time-of-bar closes:
1H → last 30–15 minutes
15m → last 2 minutes
5m → last 1 minute
Daily → last few hours
Weekly → Friday afternoon
Avoid arbitrary entries. Be systematic: flow + time + structure = higher probability trades.

NQ - If you're curious to where Nasdaq is going todayNot much to babble.
This is my intraday Chart.
TGT at the Centerline...where else? §8-)
Trade save. NO FOMO!!!

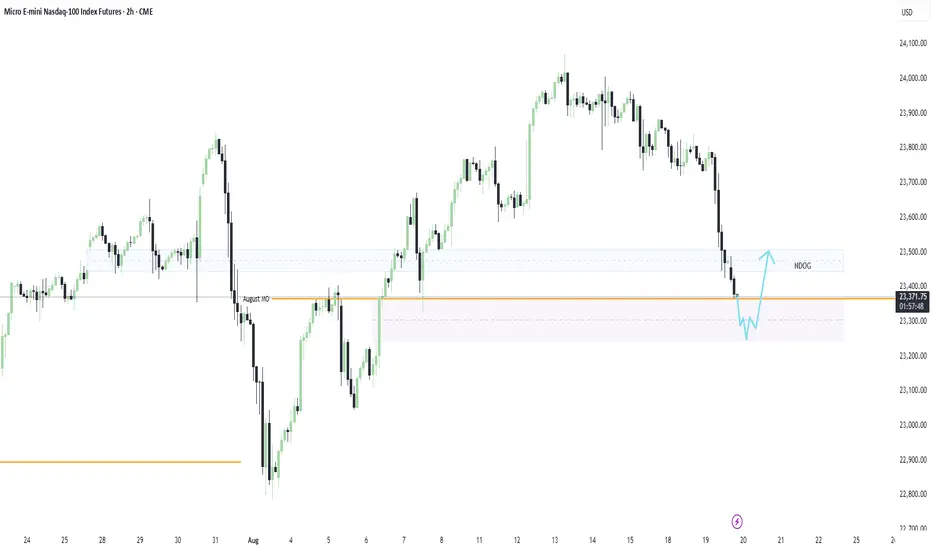
Gap Fill & Reversal Long IdeaI am anticipating a strong move through the August Monthly Open, with price sweeping the lows and targeting the 4H gap at 23,303.50. Once that level is tagged, I’ll be watching for signs of a reversal, ideally an inverse head and shoulders formation to shift bias back to the upside.
My target: a clean push toward the NDOG zone at 23,478.00
Nq ShortAfter taking a short position with the target I previously shared, I am now looking for a potential long opportunity — applying a scalping approach on Nasdaq.
⚠️ Disclaimer: This analysis reflects personal market observations and is for educational purposes only. It does not constitute financial advice.
