Another update NQUpdating this trade to replace MNQ trade as well. Same trade but on NQ instead> Updated the other trade
NASDAQ 100 E-mini Futures
No trades
Trade ideas

Sell on MNQThis one is lined up really good for a sell. Each of these ideas I have a 1:3 TP but they all have potential to go much further than that.
Calculate your position in advance so you can make the most of the trades!

MNQ1! Shorts to RTH Range for Monday 10-6-25This is my idea for Monday Oct 6 2025 that MNQ1! can be a bearish day looking for levels 24,980.

NQ Open Gap UpdateStrange day, did not expect the premarket pump, otherwise I would have bought the puts this morning instead of yesterday afternoon. No big deal, I made money today.
I closed my puts at the top of the gap, and noticed that the gap didn't completely fill. (QQQ did, but I looked at other Nas futures, they didn't fill either.)
Does it matter? Just a couple of points? Looks like it does because futures are red. I did not re-enter into puts because sometimes the gap will fill overnight, then they can pump in the morning. However, I think RSI is gonna head to oversold, not going long until then.
ANyways, futures gap almost always fill. I think there was one this spring that did not fill. I was busy moving, so I didn't update that post.
Also, my MFI indicator doesn't seem to be working right now, or there's no money flowing into futures. That's bearish.
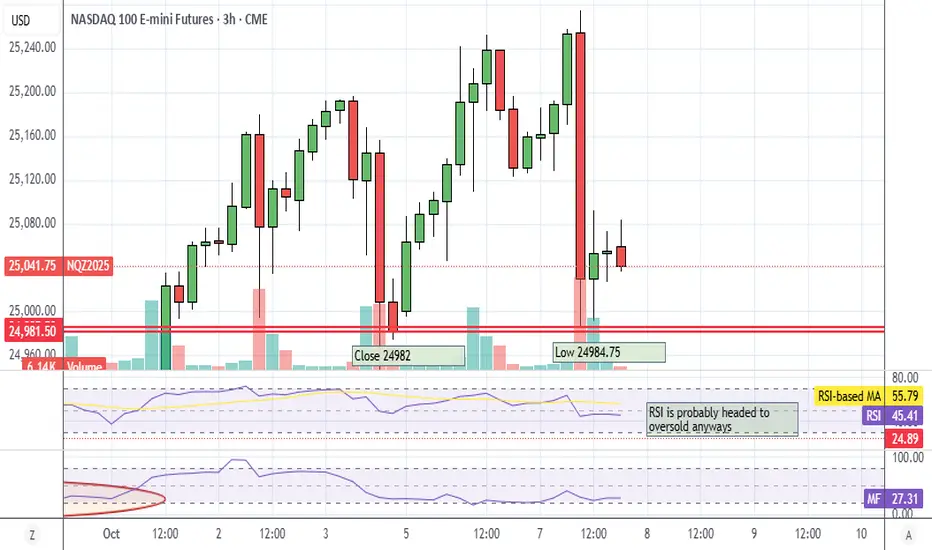
NQ Open GapFutures gapped up on election results in Japan (see Nikkei, wow), expecting gap to fill sooner than later. Guessing it's gonna be a whipsaw next day or two.
MFI almost oversold as well.

NQ: 266th trading session - recapDidn't trade loong today - got some health issues rn and I just CANNOT focus. Not ideal but well what can I do. Won't be here tomorrow, school...

#202540 - priceactiontds - weekly update - nasdaq e-miniGood Day and I hope you are well.
comment: Bullish if we stay above 24900. Every dip is bought and on the 4h chart today is only a minor pullback. We still have daily new ath. Don’t get trapped as a bear. 24900 is around the bull trend line and that’s the latest I expect much more buyers than sellers, if bears even get there. 25000 should be huge support until we get a catalyst.
current market cycle: parabolic buy climax very late in the trend - I think we top out very soon
key levels for next week: 24300 - 25300
bull case: Bulls will likely buy this dip around 25000 and want a continuation of the accelerating trend. If bears give up again, we could very well see a gigantic blow-off top for 25600 or 26000. For now the upper trend line is still resistance but since bears can not even get close to the daily 20ema, another acceleration upwards is more likely than a bigger pullback, as of now at least.
Invalidation is below 24600
bear case: What would bears need to start a bigger pullback for the big bull trend line around 24100? A big catalyst. Bears can not even get two red days in a row, so we can not think too much about bearish scenarios. Bulls who bought every dip made money since April. Daily 20ema has not been touched since early September. Sure it’s overdone but that does not mean it can’t go another 1000 points before turning. Anything below 24900 would be a decent start but for now we can not expect this to just fall.
Invalidation is above 25300
short term: Longs around 25000 have been profitable since last week and only if bears could leave behind a big gap, we could move lower. For now bulls are still in full control.
medium-long term - Update from 2024-08-10: 22000 likely to get hit this year gain.

is Nasdaq preparing for new all time high?price action will follow the same pattern as last week and push it forward to new highs? Let's see if it will happen in the coming days of the week
Is the Nasdaq a Bubble? A Technical Correction Is PossibleCME_MINI:NQ1!
Here’s a breakdown of the current Nasdaq correction scenarios based on the Nasdaq Futures (NQ1!) chart.
Every time I reached the top of the channel, an adjustment came out.
Based on the monthly chart, it has closed positively for six consecutive months since the tariff reduction, and it is judged to have entered the overbought zone by breaking through the upper Bollinger Band.
While a Santa Rally could still occur in Q4, we expect a short-term correction within one to two weeks.
Your follow and boost would mean a lot. 🚀
I am Korean and I used Google Translate.

Target areas - NQ price for Market open.10/7/25 - These are the target areas - NQ price for Market open depending if price moves up or down. Will look for trades into these areas.

7 oct looks short to melooking at the market today.
usa players have shown great strenght to short the markert.
so as seen on the video .
entry in blue 25248
target in 25028
stop in red 25291
have fun
Elektra

NASDAQ Future long: after resitance broken, new support formed Current Analysis: Nasdaq futures are currently facing a critical support at 22100
I see the chance of a Bullish rebound:
Support Strength: This support was a resistance in past weeks, then it was broken on Feb 14th and act as support in last 3 days.
Additionally, from Dec. 17th to February 12th, price formed a triangle that was broken up on Feb.13th.
Expected Movement: If the price successfully breaks above 22100, I expect it to rally towards the $22400 area.
Action Plan:
Entry Point: entered long with limit order at 22100
Target: Set a target in the $22425 (high of December 17th)
Stop Loss: Place a stop loss at 21937.75, below minimum of Feb.20th and with Risk/Reward Ratio of 2.

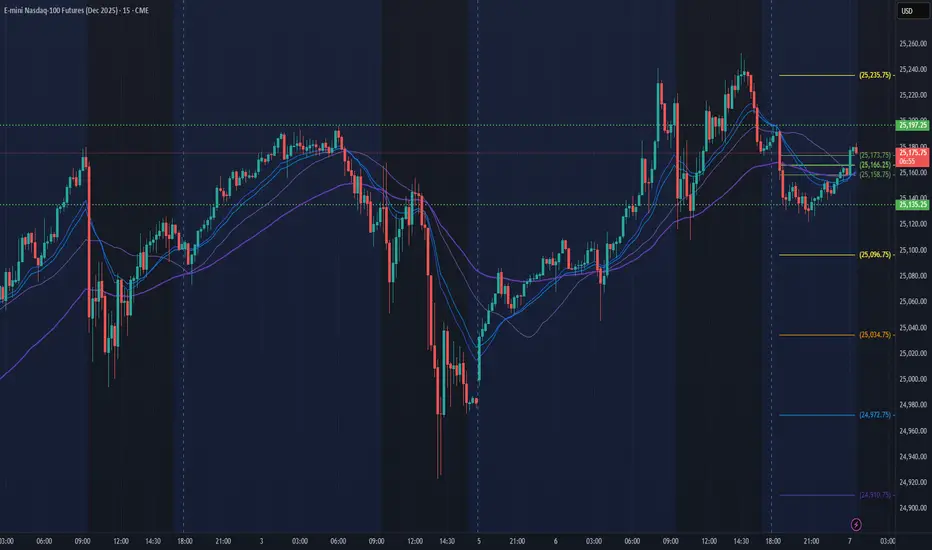
NQ Power Range Report with FIB Ext - 10/7/2025 SessionCME_MINI:NQZ2025
- PR High: 25197.00
- PR Low: 25135.25
- NZ Spread: 138.25
No key scheduled economic events
Session Open Stats (As of 12:25 AM)
- Session Open ATR: 263.48
- Volume: 20K
- Open Int: 288K
- Trend Grade: Long
- From BA ATH: -0.4% (Rounded)
Key Levels (Rounded - Think of these as ranges)
- Long: 25204
- Mid: 23571
- Short: 21939
Keep in mind this is not speculation or a prediction. Only a report of the Power Range with Fib extensions for target hunting. Do your DD! You determine your risk tolerance. You are fully capable of making your own decisions.
BA: Back Adjusted
BuZ/BeZ: Bull Zone / Bear Zone
NZ: Neutral Zone
NQ: 265th trading session - recapGood session today - and long. Almost exactly an hour. I'm just trying out something to expand my system rn, that's why the red arrow.

NQ - Week 41Weekly candle was boxed and dragged the right until next week.
Dropped down 1 timeframe to the Day and marked the BackSide (BS) & FrontSide (FS) of the nearest range - A range for me is 2 or more of the same color candle so Accumulation ranges and Distribution ranges..
I went down 1 timeframe to the 4hr and marked nearest candles to price - a FS candle and 2 ranges all with the same wicked level with label BS / FS
I went down to the 1hr timeframe and did the same but notice the Inv. BS level is a solid color. Inverse levels, when dashed are usually resistance unless solid.
I see a lot of support under price nearest the orange 4 hr accumulation trend and hourly inv. BS at $24,995.

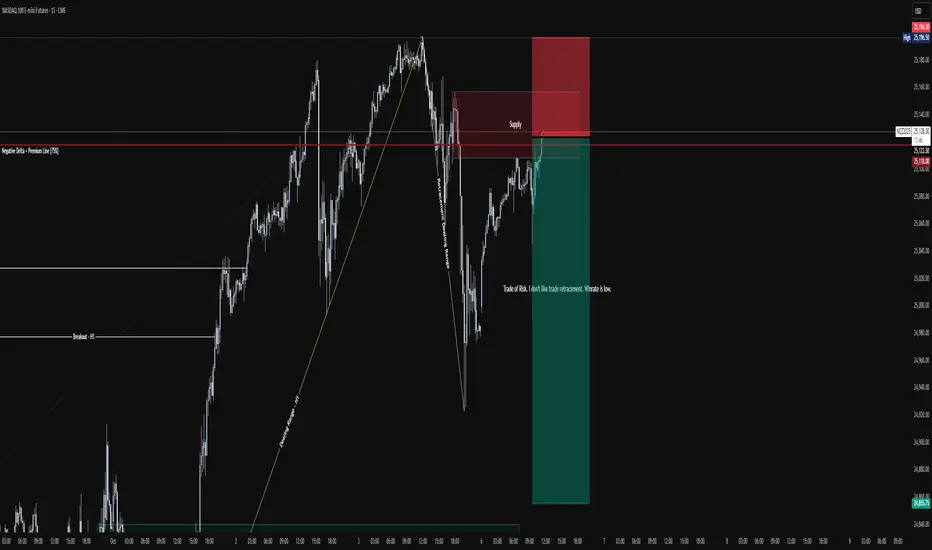
NQ - SHORT SETUP [Trade of Risk – Counter-Trend Setup]Description:
Market retraced into a supply zone aligned with the 75% premium line after a clean breakdown.
This setup represents a counter-trend trade, with limited statistical edge but potential short-term opportunity if rejection confirms at supply.
Risk is defined above the inefficiency gap.
🔹 Bias: Short (counter-trend)
🔹 Zone: 25,095 – 25,125
🔹 Invalidation: Acceptance above 25,210
🔹 Comment: I don’t like retracement trades — winrate is lower, but R:R remains favorable.
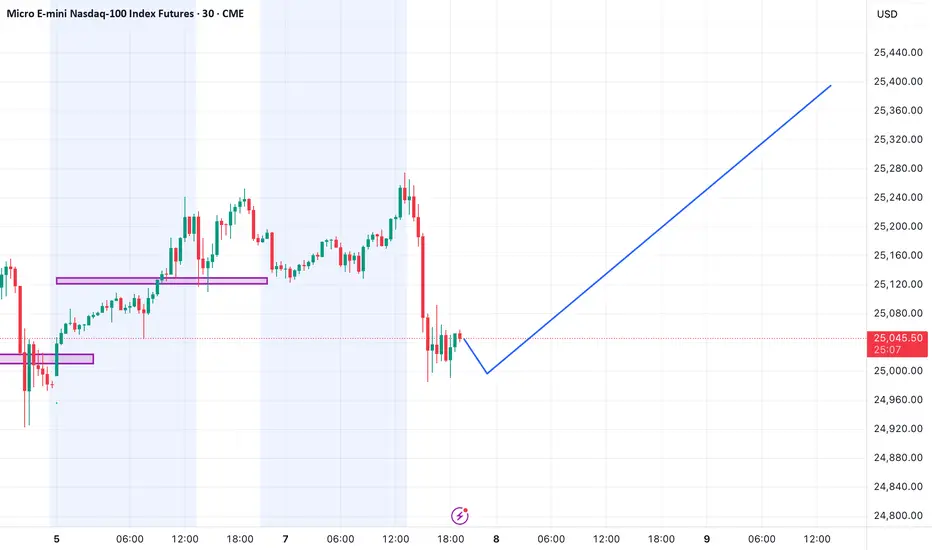
NQ 30-Min: Heavy Volume Zone Support at 24,680At 24,680, there’s a key support where buyers aggressively stepped in after sellers failed to push lower. This heavy volume zone marks the start of a new uptrend, and if price pulls back, I expect buyers to defend this area again with a strong reaction upward.

Week 2 OctoberAnalysis of my levels from End of September into upcoming week 2 of October. These are the areas and levels I am looking into.
NQ Power Range Report with FIB Ext - 10/6/2025 SessionCME_MINI:NQZ2025
- PR High: 25058.50
- PR Low: 24995.00
- NZ Spread: 142.0
Session Open Stats (As of 12:15 AM)
- Session Open ATR: 267.04
- Volume: 21K
- Open Int: 280K
- Trend Grade: Long
- From BA ATH: -0.3% (Rounded)
No key scheduled economic events
Open weekend gap up: +0.07%
Key Levels (Rounded - Think of these as ranges)
- Long: 25204
- Mid: 23571
- Short: 21939
Keep in mind this is not speculation or a prediction. Only a report of the Power Range with Fib extensions for target hunting. Do your DD! You determine your risk tolerance. You are fully capable of making your own decisions.
BA: Back Adjusted
BuZ/BeZ: Bull Zone / Bear Zone
NZ: Neutral Zone
NQ FUTURES IDEA 10/06We are looking to re test the top of 25,196 NQ but first we will drop to 24,975 NQ. I think we trade around this 24,975 range and then start pushing back up to re test 25,196 NQ.

NQ TradesB wave is in. Currently within 1st minutte wave of the intermediate C wave down, of the current 4th wave. Entry of the 382 retracement of the most recent 3rd wave, SL coveres upto 618. Looking for just 161.8% trend based fib of the 1-2 waves. Effectively predicting the terminus of the 3rd wave, we then allow a 4th to occur, then 5 to complete the first wave down of the C wave. Bosch.

NQ: 264th trading session - recapNot a great session for the bears - but it was a great learning experience. I'm starting to get the hang of ranging price action, I will use this to my advantage in future sessions...

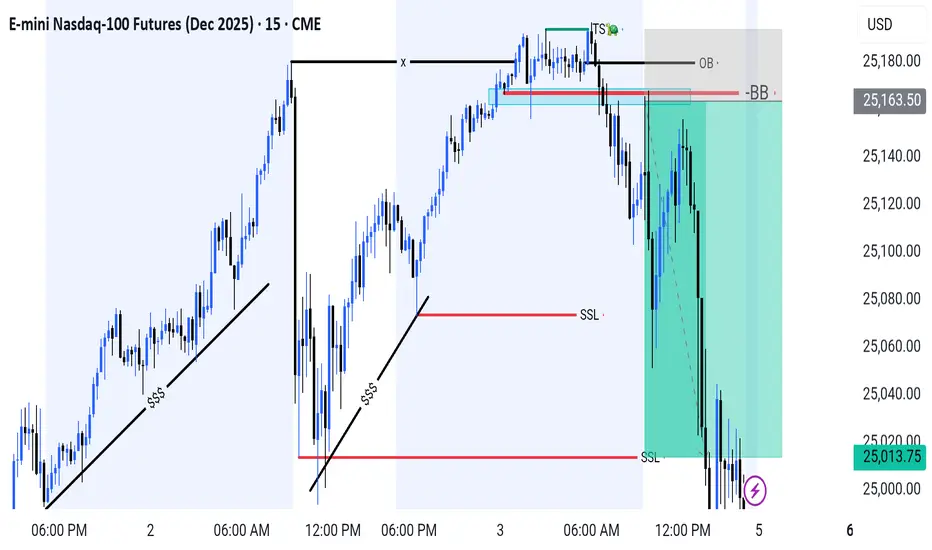
Nasdaq-100 | Textbook OB Rejection SSL Target Hit.Price swept the internal liquidity (TS 🐢) and tapped into a premium Order Block (OB), showing clear signs of rejection. This confirms a potential shift in market structure with bearish momentum building up. Alhumdulillah Target Hit✅️
🔹 Key Points:
Buy-side liquidity (BSL) taken before OB mitigation
Strong rejection from OB + Breaker Block (BB) zone
Market structure shift confirmed on 15m
Targeting sell-side liquidity (SSL) below recent swing lows
As long as price remains below the OB, bearish continuation is expected. Watch for short setups aligned with internal structure breaks.