Trade ideas
NQ Short - DELETE MNQ setupAfter checking the charts, I like these setups on NQ instead of MNQ
Better orderflow and I see many on NQ that win on NQ but lose on MNQ. They are tiny setups so you should be able to manage risk effectively, even on NQ

Another Sell on MNQYou can see the ENTRY< SL AND TP level on the right side of the chart, I pointed with a arrow
With some time, I will figure out the best way to post these
2 trades in this pic

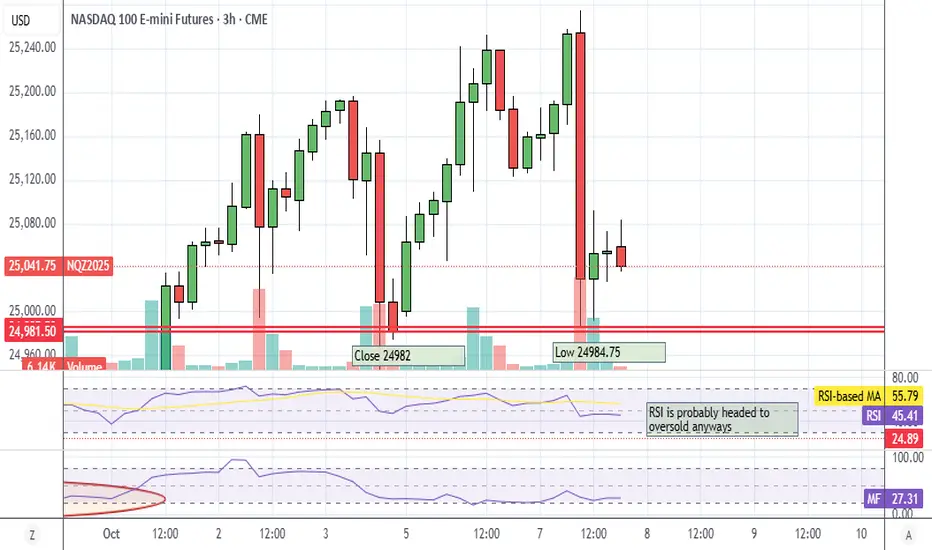
NQ Open Gap UpdateStrange day, did not expect the premarket pump, otherwise I would have bought the puts this morning instead of yesterday afternoon. No big deal, I made money today.
I closed my puts at the top of the gap, and noticed that the gap didn't completely fill. (QQQ did, but I looked at other Nas futures, they didn't fill either.)
Does it matter? Just a couple of points? Looks like it does because futures are red. I did not re-enter into puts because sometimes the gap will fill overnight, then they can pump in the morning. However, I think RSI is gonna head to oversold, not going long until then.
ANyways, futures gap almost always fill. I think there was one this spring that did not fill. I was busy moving, so I didn't update that post.
Also, my MFI indicator doesn't seem to be working right now, or there's no money flowing into futures. That's bearish.
Is the Nasdaq a Bubble? A Technical Correction Is PossibleCME_MINI:NQ1!
Here’s a breakdown of the current Nasdaq correction scenarios based on the Nasdaq Futures (NQ1!) chart.
Every time I reached the top of the channel, an adjustment came out.
Based on the monthly chart, it has closed positively for six consecutive months since the tariff reduction, and it is judged to have entered the overbought zone by breaking through the upper Bollinger Band.
While a Santa Rally could still occur in Q4, we expect a short-term correction within one to two weeks.
Your follow and boost would mean a lot. 🚀
I am Korean and I used Google Translate.

Key levels for reversals back to the upsideI’ve marked key levels where I believe the market could potentially reverse to the upside, allowing the bull run to resume. Of course, fundamentals and news can quickly change the market’s direction, but this represents my current technical analysis that I’ll be monitoring closely.
Final sell off ahead of FOMC | Head n ShouldersI believe price will stage one final sell-off before resuming its push toward higher highs. On the 4H chart, a potential Head & Shoulders pattern is forming, suggesting price may fill the hourly gap at 24,856 before or during the FOMC release.
The 15-minute chart offers a more precise entry compared to the 1H and 4H timeframes.
I plan to enter within the 25,149–25,150 price range, provided my bias remains valid heading into the New York open.
Lets get it!⚡

#202540 - priceactiontds - weekly update - nasdaq e-miniGood Day and I hope you are well.
comment: Bullish if we stay above 24900. Every dip is bought and on the 4h chart today is only a minor pullback. We still have daily new ath. Don’t get trapped as a bear. 24900 is around the bull trend line and that’s the latest I expect much more buyers than sellers, if bears even get there. 25000 should be huge support until we get a catalyst.
current market cycle: parabolic buy climax very late in the trend - I think we top out very soon
key levels for next week: 24300 - 25300
bull case: Bulls will likely buy this dip around 25000 and want a continuation of the accelerating trend. If bears give up again, we could very well see a gigantic blow-off top for 25600 or 26000. For now the upper trend line is still resistance but since bears can not even get close to the daily 20ema, another acceleration upwards is more likely than a bigger pullback, as of now at least.
Invalidation is below 24600
bear case: What would bears need to start a bigger pullback for the big bull trend line around 24100? A big catalyst. Bears can not even get two red days in a row, so we can not think too much about bearish scenarios. Bulls who bought every dip made money since April. Daily 20ema has not been touched since early September. Sure it’s overdone but that does not mean it can’t go another 1000 points before turning. Anything below 24900 would be a decent start but for now we can not expect this to just fall.
Invalidation is above 25300
short term: Longs around 25000 have been profitable since last week and only if bears could leave behind a big gap, we could move lower. For now bulls are still in full control.
medium-long term - Update from 2024-08-10: 22000 likely to get hit this year gain.

Weekly engulfing candle A Trump tariff announcement produced a huge engulfing candle, lets see what happens this week?
Trump's form is he always undo's his threats pretty quickly so be careful, but this market was over stretched and crying for a correction.
Is this enough?
will the buy the dip buyers return?
Earnings season is here and
we have interest rate cuts looming ...
So volatility is here for a while
be careful out there

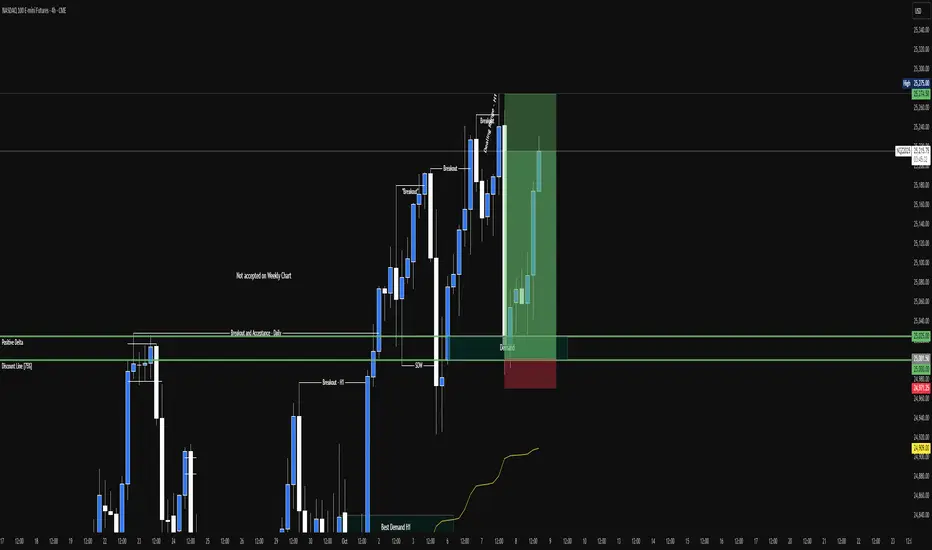
Bullish MONDAY Price dipped into the long term weekly FVG
And respected it now. My thoughts are Monday could be a bullish day where price start to rally back up because we are in a very deep discount right now and have lots of range to cover so I think we could see some upside objectives.
also if we open and Gap down then there’s a big change we continue lower but I hope that is not the case because it would become a full on market crash. this is a minor correction nothing major

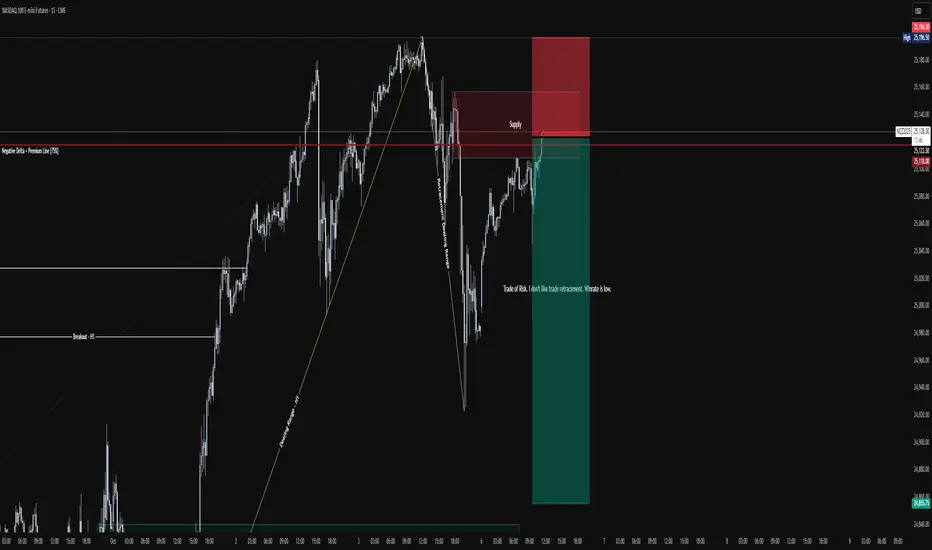
NQ - SHORT SETUP [Trade of Risk – Counter-Trend Setup]Description:
Market retraced into a supply zone aligned with the 75% premium line after a clean breakdown.
This setup represents a counter-trend trade, with limited statistical edge but potential short-term opportunity if rejection confirms at supply.
Risk is defined above the inefficiency gap.
🔹 Bias: Short (counter-trend)
🔹 Zone: 25,095 – 25,125
🔹 Invalidation: Acceptance above 25,210
🔹 Comment: I don’t like retracement trades — winrate is lower, but R:R remains favorable.
NQ UpdateFutures dropped afterhours when Trump announced 100% tariffs on China, so expect a gap down Monday.
Funny thing is, I wasn't very bullish because of that open gap, I added to my KSS puts this morning before the market got Trumped. Was wondering if that was a mistake for about 5 minutes, lol. Lucky or not, timing is everything. Wish it was announced yesterday morning when I had even more puts. Oh well.
In any case, RSI and MFI both went oversold, I was expecting MFI to go oversold which is why I did not go long on stocks this morning. Can't use 3hr indicators during a tank, the market will whipsaw it's way down just like April. Daily indicators might be of some help if this spring repeats.
I also suspected something fishy going on, retail was weak all week, which is why I was shorting KSS, along with the H&S pattern I posted. HD has been tanking for an entire month, there are always people that have inside info, probably Trumps brokers, lol. I'm sure he's feeding info to his family and friends, it's the biggest inside trader scam EVER.

MASSIVE CORRECTION IN PLAY This is my analysis for next week the Top on NQ is finally placed and once we close below the previous weeks low today. Shorts is the play next week aiming for all daily lows and old SIBI
Not financial advice just my opinion :)

Liquidity Sweep on 4H TF know to mark out all the session highs and lows, the one-hour highs and lows, and the four-hour highs and lows, and then wait for a liquidity sweep, then wait for a break of structure, inverse fair value gap, or a 79% extension closure? And then following that, look for a fair value gap getting filled, order block, breaker block, equilibrium getting filled, and then scale down to the one-minute time frame, look for a break of structure, inverse fair value gap, or 79% extension closure, looking for the trend to continue in the right direction, and then take profits at the previous draws on liquidity that haven't been hit yet

NQ 30-Min: Heavy Volume Zone Support at 24,680At 24,680, there’s a key support where buyers aggressively stepped in after sellers failed to push lower. This heavy volume zone marks the start of a new uptrend, and if price pulls back, I expect buyers to defend this area again with a strong reaction upward.

Sell on MNQThis one is lined up really good for a sell. Each of these ideas I have a 1:3 TP but they all have potential to go much further than that.
Calculate your position in advance so you can make the most of the trades!

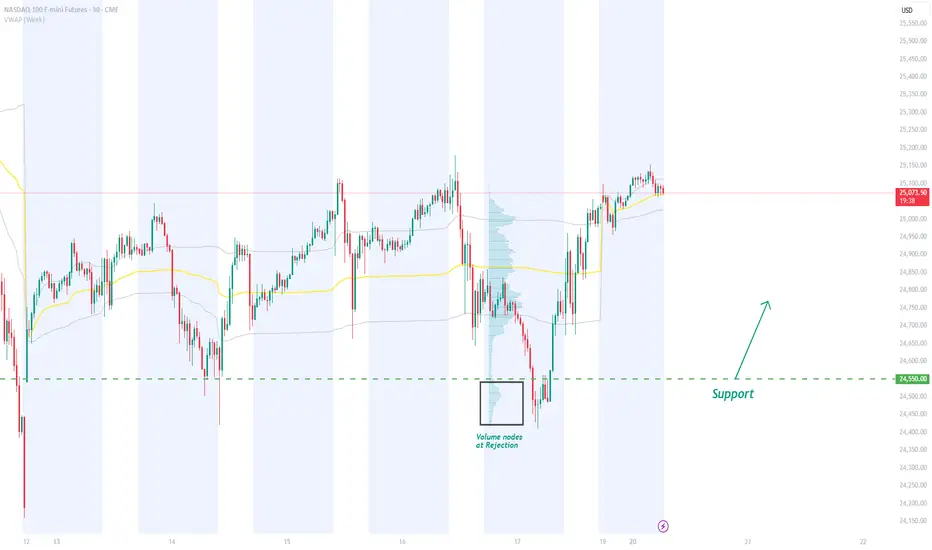
NQ Rejection Setup @ 24,550 | Strong Support Formed on D-ProfileThe NQ formed a D-shaped Volume Profile on Friday, signaling temporary balance between buyers and sellers. A strong rejection of lower prices created a significant volume cluster and a Fair Value Gap at 24,550. I’m watching for a pullback to this level for a potential long entry.
Nasdaq on a Tightrope — Breakdown WatchCME_MINI:NQ1!
Weekly: price keeps hugging the rising trendline; historically it doesn’t get far above it before rolling. Maybe a little upside into the retail box, but I’m be patient for a breakdown weekly close below the trendline = short bias toward 24.0k #NQ #Nasdaq100 #Futures
NQ Power Range Report with FIB Ext - 10/20/2025 SessionCME_MINI:NQZ2025
- PR High: 25099.25
- PR Low: 25039.75
- NZ Spread: 133.0
No key scheduled economic events
Session Open Stats (As of 12:45 AM)
- Session Open ATR: 391.21
- Volume: 43K
- Open Int: 283K
- Trend Grade: Long
- From BA ATH: -1.1% (Rounded)
Key Levels (Rounded - Think of these as ranges)
- Long: 26020
- Mid: 23571
- Short: 21939
Keep in mind this is not speculation or a prediction. Only a report of the Power Range with Fib extensions for target hunting. Do your DD! You determine your risk tolerance. You are fully capable of making your own decisions.
BA: Back Adjusted
BuZ/BeZ: Bull Zone / Bear Zone
NZ: Neutral Zone
this my opinion for what happening this weeknq chart I think we will see something like this be safe

#202542 - priceactiontds - weekly update - nasdaqGood Evening and I hope you are well.
comment: Big tails above and below the daily bars last week. Strong reversal on Friday but the move from 25388 down to 24157 is still the dominant feature of the chart. Bulls need to get strong follow-through on Monday to continue with higher highs inside the channel but I do think the odds are good that we print a lower high below 25179 and move lower again. Given that bulls closed the week at the high, I can not go bearish into next week. I need to see big selling pressure first.
current market cycle: bull trend still valid until we break below 24000
key levels for next week: 24000 - 25400
bull case: Bulls want another bullish daily close on Monday and print another ath. Given their amazing close last week, they are favored going in to next week but their problem is that last week had prominent tails above every daily bar since Tuesday. So how confident are the bulls to buy above 25k when the market shows mostly rejections above?
Invalidation is below 24800.
bear case: If bears somehow manage to print a lower high here around 25k and stay below 25179, they have a shot at trading down to <24600 again and we most likely will contract for longer. If they fail, there is no reason we can not print another ath. After Friday’s close, bears do not have many arguments on their side. It’s still overbought and all that but market is refusing to go lower. Every dip is bought with force. For bears to achieve something, we need a big bear gap.
Invalidation is above 24200.
short term: Neutral again. Bearish below 24800 and nothing will make me bullish.
medium-long term - Update from 2024-08-19: 23000 likely to get hit this year gain. (updated from 22000 to 23000 since we are not moving lower and time is not on my side with this)

NQ: 272nd trading session - recapJust another session just for the books, absolutely NOTHING happen that was worth mentioning
