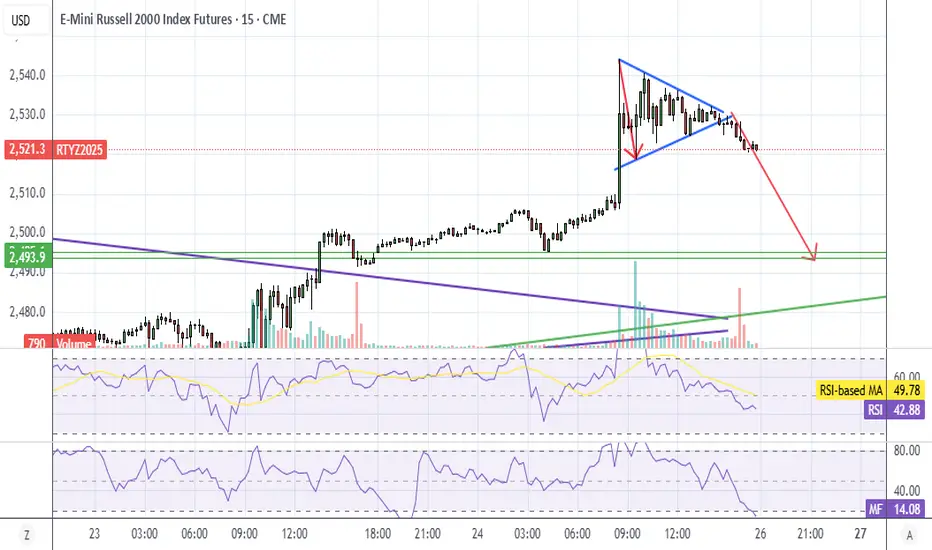
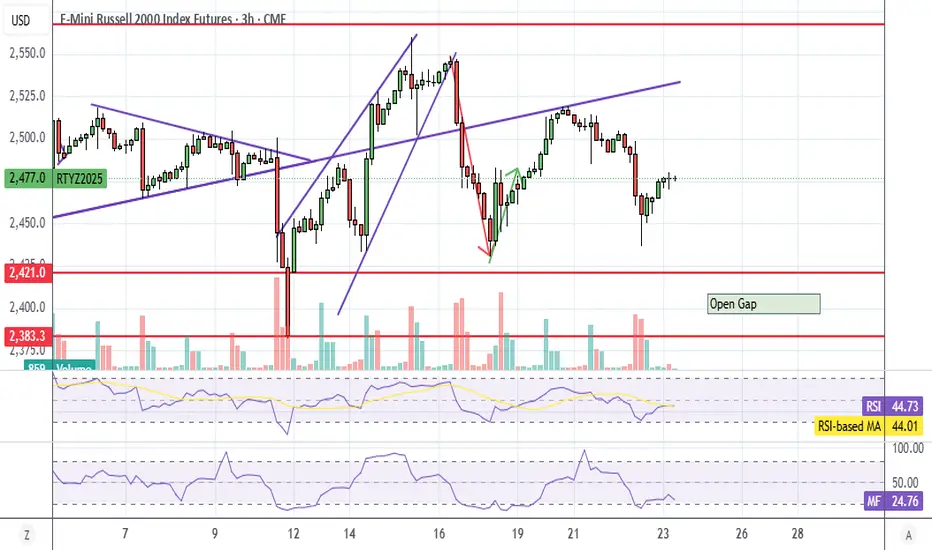
RTY Small Open GapRTY has a small open gap from the Thurs 1 hr break that does not exist on NQ and ES. Pennant breakdown also looks bearish.
ES did not go oversold on RSI last drop like RTY did, so maybe ES melts up and RTY doesn't? Small caps can diverge from NDX and SPX. Also, RTY didn't break out to a new ATH
Related futures
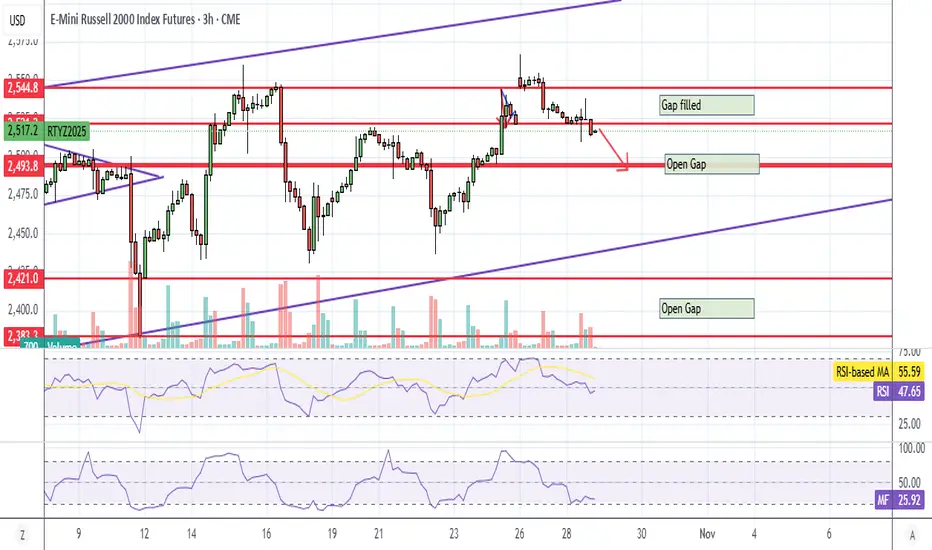
RTY UpdateDoesn't look like the algos are interested in pumping small caps. Appears to be all about NQ right now.
Looking like that small gap below is gonna fill, but watch out for the Fed meeting tomorrow.
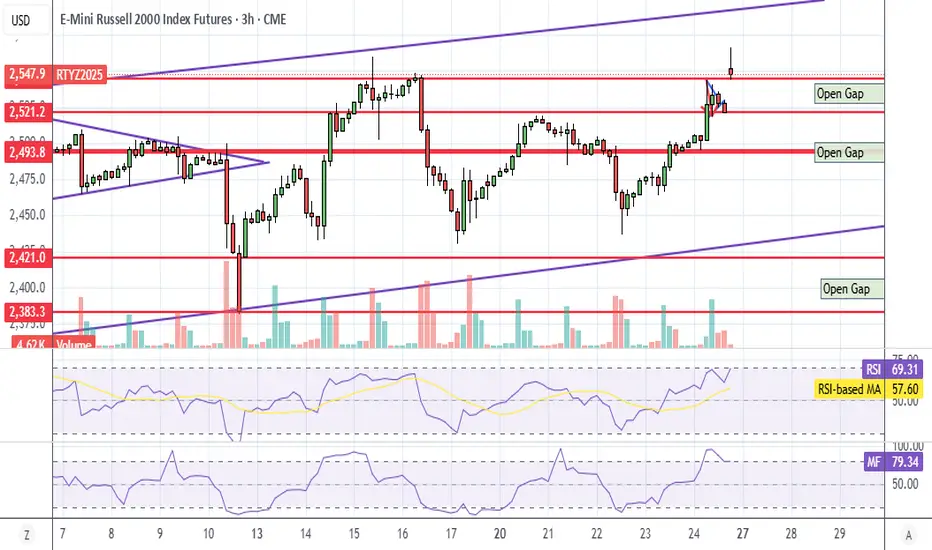
RTY UpdateOverbought with MFI divergence and 3 gaps below but I don't think I will be shorting IWM this week. Too much trade news hype.
RTY UpdateWell, my arrow was right, but I didn't anticipate the algo pump before the Fed. The algos seem confused now because their pump and dump didn't work thanks to Powell.
Not sure if they complete the dump tomorrow or if they try to pump it back up for trade news Thu night. Or Maybe both, lol. Dump i

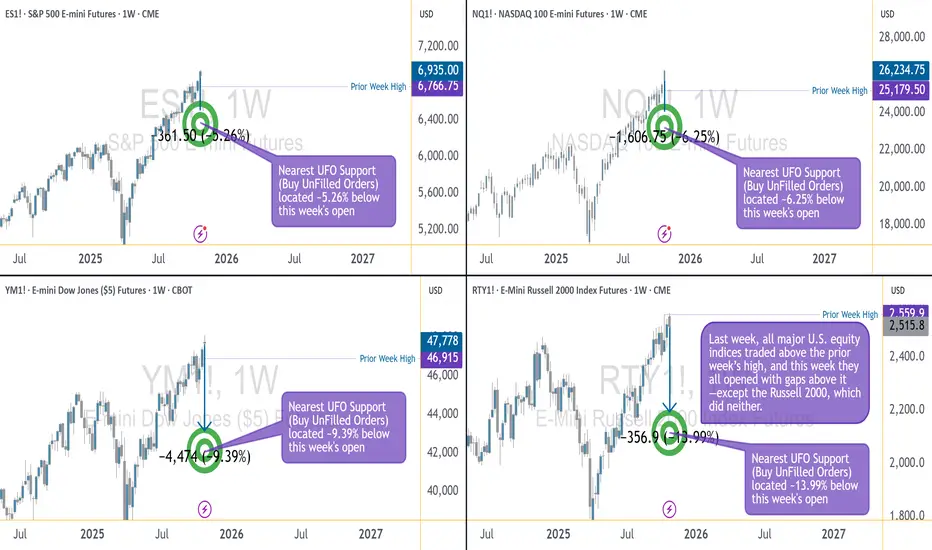
When Generals Run and Soldiers Nap — The Market’s Odd ParadeEver seen an army march where the generals sprint ahead, but the soldiers just yawn and stay behind?
That’s exactly what’s happening in the U.S. futures battlefield right now.
The ES, NQ, and YM — our large-cap “generals” — opened the week above their prior highs, looking ready for victory speeches
RTY PennantRTY formed a morning pennant and broke down in the afternoon. Target shown.
Small caps have a tendency to fill gaps.

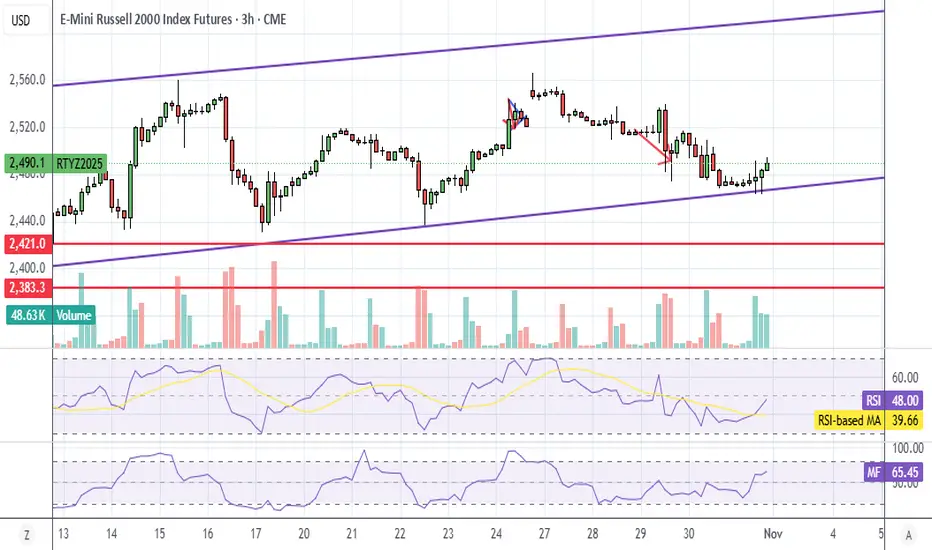
RTY Daily ChannelThis is why I said there might be a melt up next week. RTY has been in the same upward channel since the tariff tank. You figure as bullish as this market is, it needs to hit the top of the channel in a breakout like this.
Will not be shorting IWM next week. Long on shitcoin for the week based o

RTY Small cap pennantLooks like small caps made yet another pennant. CPI numbers tomorrow, no position yet. Regardless of which way it breaks, I expect MFI to get overbought tomorrow, possibly premarket.
The open gap below still has me bearish so I'm inclined to believe down. We'll see.

RTY UpdateRSI and MFI hit oversold yesterday, missed the dump because I was hungover and cashed out early, lol.
I assume they do a pump on CPI tomorrow.
RTY Update I expected the algos to pump small caps today because it's at the bottom of the channel that it's been in since April. Went long on ALB after open but bailed on it when the market rolled over before lunch. Made money though, but chart looked to much like yesterday and teh day before to stay in it.
See all ideas
Summarizing what the indicators are suggesting.
Neutral
SellBuy
Strong sellStrong buy
Strong sellSellNeutralBuyStrong buy
Neutral
SellBuy
Strong sellStrong buy
Strong sellSellNeutralBuyStrong buy
Neutral
SellBuy
Strong sellStrong buy
Strong sellSellNeutralBuyStrong buy
A representation of what an asset is worth today and what the market thinks it will be worth in the future.
Displays a symbol's price movements over previous years to identify recurring trends.
Frequently Asked Questions
The current price of E-Mini Russell 2000 Index Futures is 2,489.9 USD — it has risen 0.58% in the past 24 hours. Watch E-Mini Russell 2000 Index Futures price in more detail on the chart.
The volume of E-Mini Russell 2000 Index Futures is 199.94 K. Track more important stats on the E-Mini Russell 2000 Index Futures chart.
Open interest is the number of contracts held by traders in active positions — they're not closed or expired. For E-Mini Russell 2000 Index Futures this number is 391.04 K. You can use it to track a prevailing market trend and adjust your own strategy: declining open interest for E-Mini Russell 2000 Index Futures shows that traders are closing their positions, which means a weakening trend.
Buying or selling futures contracts depends on many factors: season, underlying commodity, your own trading strategy. So mostly it's up to you, but if you look for some certain calculations to take into account, you can study technical analysis for E-Mini Russell 2000 Index Futures. Today its technical rating is buy, but remember that market conditions change all the time, so it's always crucial to do your own research. See more of E-Mini Russell 2000 Index Futures technicals for a more comprehensive analysis.