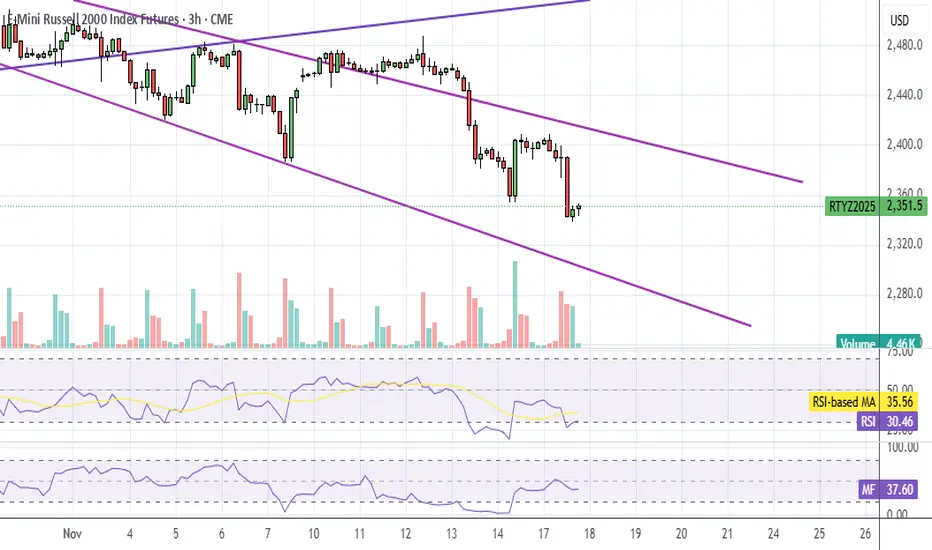
RTY UpdateWell, the inflation pump was fun, but it looks like RTY still wants to go oversold on RSI. That's when we get our next bounce.
E-Mini Russell 2000 Index Futures
No trades
Market insights


Russell 80% gain in 2026We are headed North. Channel is clear and has no been confirmed. Next stop is north. Do not short. Buy the dip territory all year. Enjoy. Should be a lot of fun.

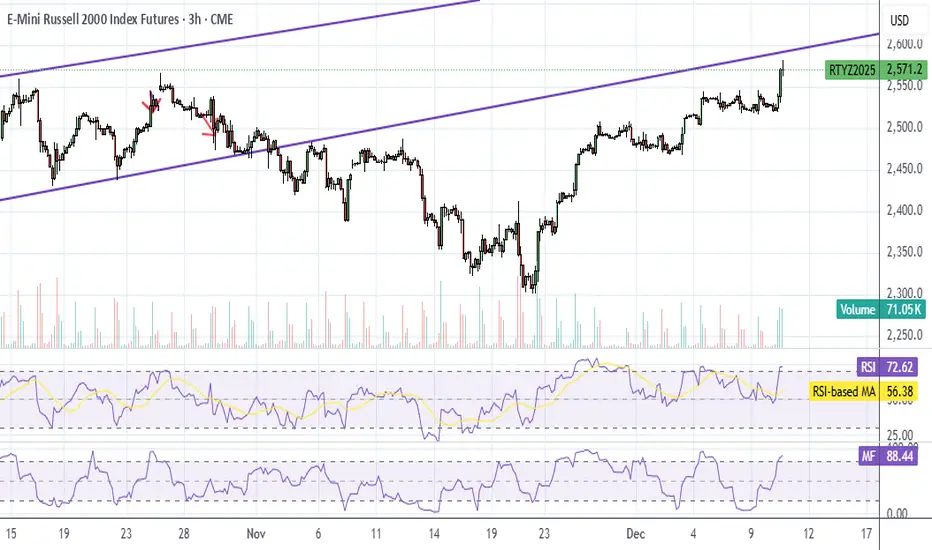
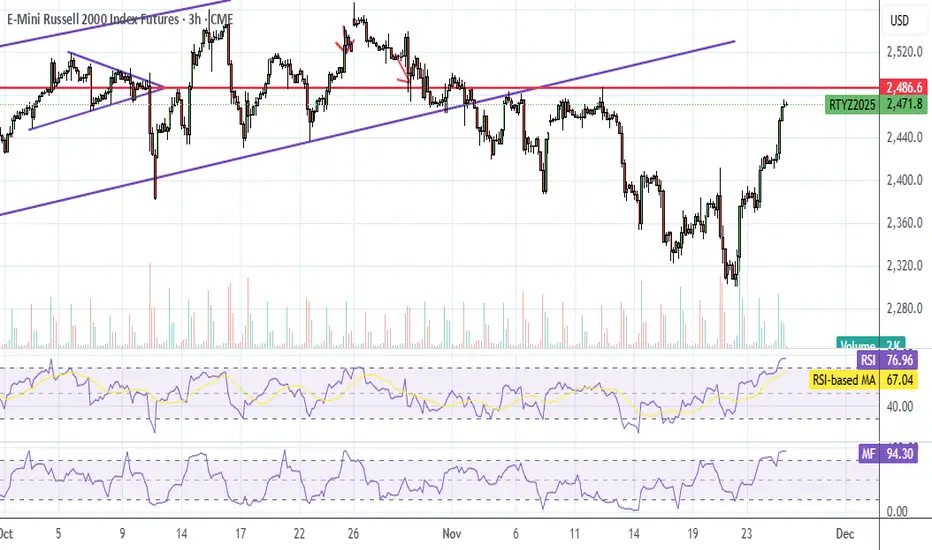
RTY UpdateRTY is overbought on both RSI and MFI but I think it backtests that purple line before dropping.
Expecting a pump tomorrow morning then back to teh whipsaw. See my ES plot./
RTY UpdateRTY and YM (Dow) are overbought on RSI and MFI, so probably more whipsaw tomorrow, lol.
I looked at it because I was thinking about going long on a retail stock. Looks like I'm too late on that one.
FDAX also hit overbought...

Russell 2000 ~ Breakout Confirmed 3,000 Target On TrackRussell 2000 Technical Update
The Russell 2000 breakout from its multi year consolidation remains intact and is now confirmed by multiple monthly closes above former resistance. The anticipated pullback has played out as expected, providing validation of the breakout structure and keeping the measured move toward the 3,000 area firmly in play.
This update reviews what has developed since the original breakout signal and why the next leg higher remains the dominant path.
What Has Developed Since the Breakout
In October, the Russell 2000 recorded a monthly close above the November 2021 highs near the 2,450 area. This marked a confirmed breakout from a five year consolidation range.
At the time, a pullback to retest former resistance as support was expected. That scenario unfolded precisely.
Price retraced into the 2,280 to 2,350 zone, aligning with the 0.5 to 0.618 Fibonacci retracement levels. Buyers stepped in at support, and November closed back above the breakout level. December has continued to hold above this zone, reinforcing the validity of the move.
Two consecutive monthly closes above a five year resistance level typically signal institutional participation rather than a short term false breakout.
Current Technical Structure
Breakout Confirmation
Monthly closes remain above former resistance near 2,350. This area now acts as structural support.
Fibonacci Alignment
The pullback tested the 0.236 retracement near 2,280 and held. Price is currently trading above the 0.236 retracement, reinforcing bullish structure.
Trend Conditions
Long term moving averages are rising beneath price. Higher lows continue to form on the monthly timeframe. Volume has expanded on advances, supporting the breakout.
The initial breakout phase is complete. Price is now transitioning into the continuation phase.
Why the 3,000 Target Remains Valid
Measured Move Projection
The five year range spans roughly 1,640 to 2,481. Projecting this range from the breakout level produces an upside target above 3,300.
Conservative Targeting
Using approximately 80 percent of the measured move yields a zone near 3,150. Rounding to 3,000 provides a conservative target that accounts for volatility and market noise.
Fibonacci Extensions
Higher timeframe Fibonacci extensions cluster between 3,200 and 3,300, reinforcing the broader target zone.
From current levels near 2,400, the move to 3,000 represents approximately 25 percent upside.
Review of the November Pullback Entry
The outlined plan called for a pullback into the 2,280 to 2,350 area with invalidation below 2,150.
Price reached 2,282 in November, directly into the projected support zone. Buyers defended the level, price rebounded, and structure remained intact.
Risk to reward at entry was approximately 5 to 7 percent risk for 25 to 30 percent potential upside, producing a favorable asymmetric profile.
Why This Move Is Still Early
Cycle Timing
The breakout occurred recently on a monthly timeframe. Large structural breakouts often take 12 to 18 months to reach measured targets.
Institutional Rotation
Small caps underperformed for several years. Capital rotation into this segment typically unfolds gradually, not in a single move.
Participation Profile
Retail participation remains focused on large cap technology. Breakouts that are not yet widely discussed often offer the best continuation potential.
The breakout is confirmed, but it is not yet fully recognized.
Macro Environment
Interest Rate Outlook
Falling or stabilizing rates tend to favor small caps due to their higher sensitivity to financing costs.
Economic Backdrop
The absence of recession supports domestically focused companies that dominate the Russell 2000.
Valuation Context
Small caps continue to trade at a valuation discount relative to large caps, creating room for multiple expansion.
Technical structure and macro conditions are currently aligned.
Risk On Correlation With Crypto
Historically, sustained Russell 2000 breakouts coincide with improving liquidity conditions. These environments often support digital asset strength.
Bitcoin has already advanced meaningfully since the Russell held its breakout. Continued small cap strength would support a broader risk on regime.
This relationship is contextual rather than predictive and should be monitored rather than assumed.
Positioning Framework
Exposure Options
IWM ETF, RTY futures, or structured options depending on experience and risk tolerance.
Risk Management
A monthly close below 2,280 would weaken the breakout thesis. The 3,000 area remains the primary target, with 3,200 as an extended objective.
Time Horizon
This structure favors a medium to long term outlook rather than short term trading.
Monthly closes carry more weight than daily volatility.
Invalidation Risks
• Monthly close below 2,280
• Macro driven risk off events
• Unexpected policy tightening
• Broad market trend deterioration
If invalidated, losses remain defined and manageable relative to upside potential.
Psychology of Structural Breakouts
Early stages feel uncertain. Confirmation feels uncomfortable. Obvious trends tend to appear near the latter stages of a move.
This breakout is confirmed, but not yet crowded.
Summary
• Five year breakout confirmed with multiple monthly closes
• Support held at the anticipated retracement zone
• Measured move targets 3,000 to 3,200
• Upside approximately 25 to 30 percent from current levels
• Risk remains defined below structural support
The most difficult part of the trade was the breakout itself. The market is now in the follow through phase.
Important Disclaimer
This analysis is for educational purposes only and does not constitute financial advice. All markets involve risk, and technical patterns can fail. Always apply appropriate risk management, conduct independent research, and trade in alignment with your risk tolerance.

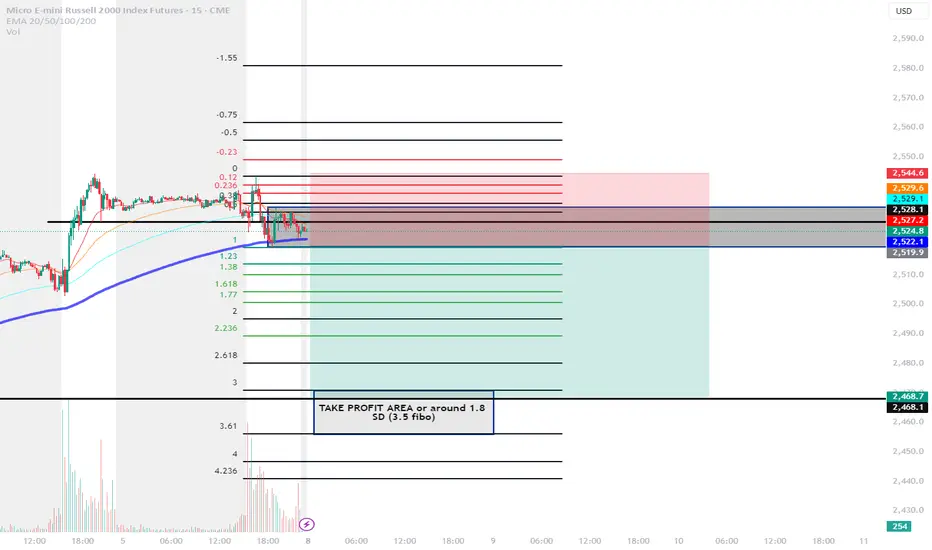
Short RTY, M2K IdeaI believe if we broke the box to the downside. A huge selloff will happen to 1.5 Standard deviation or 3 Fibonacci level drawn from Friday range
RTY Premarket UpdatePosting premarket update because I showed it went oversold yesterday. MFI hit overbought already, don't chase it.

RTY UpdateI said I'd wait until indicators show something before trading, RTY MFI hit oversold before market opened, so I went long today....
but I realized what I should have done is buy IWM call options on open, lol. Next time. RSI is almost overbought, I expect it to go above teh line just like last time.

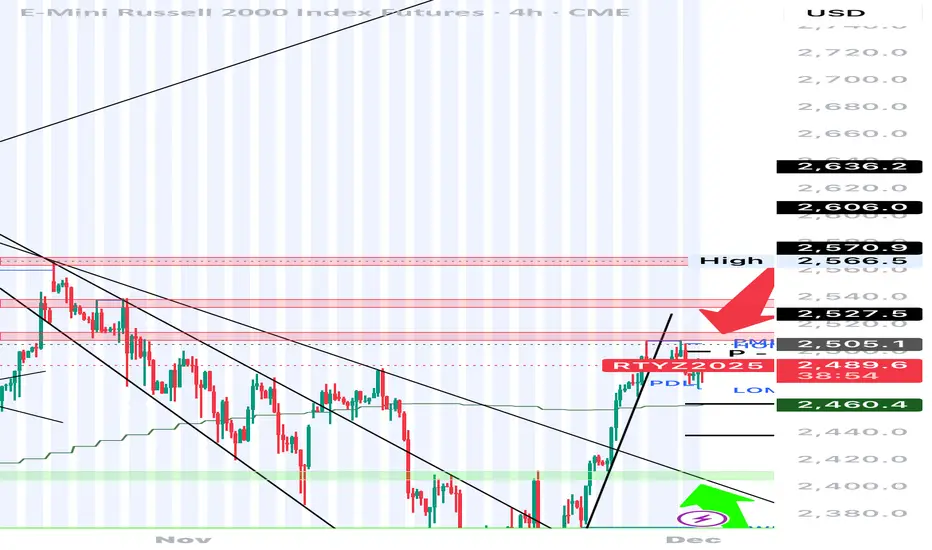
RTY BUY and SELL ZonesSetups i am watching this week
Buy zone - Green arrow (2411-2400) - (swing) confluence for this Green zone
Clean Sweep of 25 - Nov low
Strong support zone in hourly (4h)
TL support
Sell zone - (2520-2510 ) confluence
Clean sweep of PMH,PWH, PDH & 29 Oct High
Resistance Zone
Always enter the Trade after confirmation which is 2B in 30 mts or hourly

RTY - Bull and sell zonesSetups i am watching this week
Buy zone - Green arrow (2411-2400) - (swing) confluence for this Green zone
Clean Sweep of 25 - Nov low
Strong support zone in hourly (4h)
TL support
Sell zone - (2520-2510 ) confluence
Clean sweep of PMH,PWH, PDH & 29 Oct High
Resistance Zone
Always enter the Trade after confirmation which is 2B in 30 mts or hourly

RTY UpdateRSI and MFI actually hit oversold on the daily, so it got the biggest pump of all. Good retail earnings certainly helped today.
In any case, RSI and MFI are both overbought on the 3 hr, expecting a dip here tomorrow. Not gonna short it though.
The way to play it is to wait until MFI goes oversold and buy calls. I'm expecting a melt up.
RTY Open GapRTY left an open gap after the 1 hour break.
That's gonna fill, it's coming back down.
Note: 15 min chart, ignore indicators

RTY UpdateMFI hit overbought already, but they're pumping it anyways on NVDA earnings which really has nothing to do with small caps. Jobs report tomorrow though.
This remains the index to short, but I'll probably wait until Monday.
Analysis for What’s Coming - AI Bubble Sentiment The US markets have been described as “on a rally” for quite some time. I would not agree if it is meant to describe the overall US market, but would agree if it refers specifically to AI or tech stocks. Why?
Among the four major US indices, the Russell—representing a much broader base of US-listed companies—continues to struggle to break above its high from last year, even though the others have far surpassed it. In fact, it has since corrected by 9.5% since its all-time high just last month.
After that, the other indices are also following suit only in the past few days, breaking below this uptrend that started in April.
Micro E-mini Russell 2000 Index
Ticker: M2K
Minimum fluctuation:
0.10 index points = $0.50
Disclaimer:
• What presented here is not a recommendation, please consult your licensed broker.
• Our mission is to create lateral thinking skills for every investor and trader, knowing when to take a calculated risk with market uncertainty and a bolder risk when opportunity arises.
CME Real-time Market Data help identify trading set-ups in real-time and express my market views. If you have futures in your trading portfolio, you can check out on CME Group data plans available that suit your trading needs www.tradingview.com

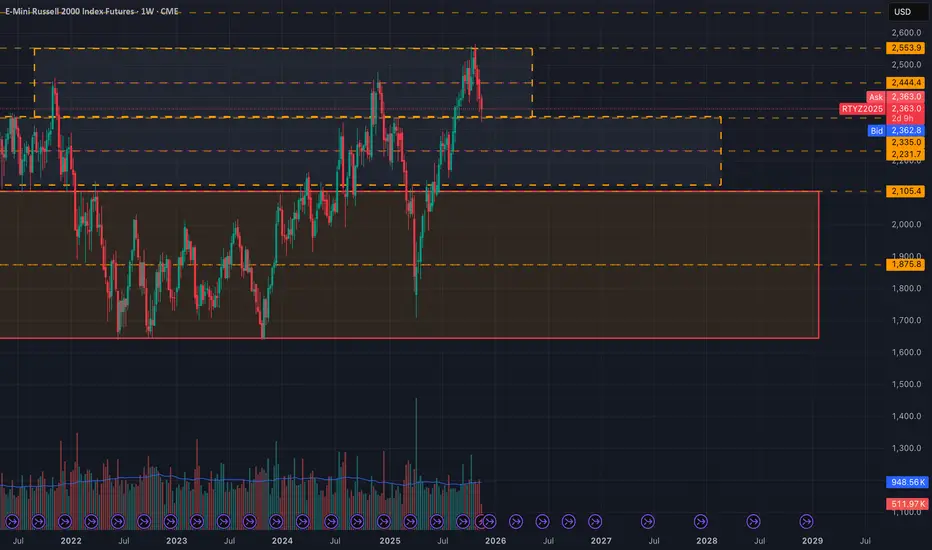
RTY Box LevelsI've taken some time to chart the Russell 200, and I have to say the box is looking quite excellent.
Nice and clean levels, makes a fella wanna put a bid in.
I am not used to trading this name(literally traded it the first time on Monday), but it seems like a good time so far.
I'll be on the look out for LBAFs and LAAFs, no directional bias just trading what is seen atm.
If a look below and fail occurs and is sustained at the upper box, then it is objectively a long (especially if we trade lower first w/a failure to go lower), otherwise if we trade through the level w/ continuation or trade higher first and fail, then a LAAF would take us within the middle box's range.
Trading higher first and failing is more bearish than trading lower first.
Trading lower first and failing to go lower is more bullish than trading higher first.
I like to keep these concepts in mind as I wait for the opening and initial balance ranges to form intraday, and from there, I can form an opinion and initiate a trade.
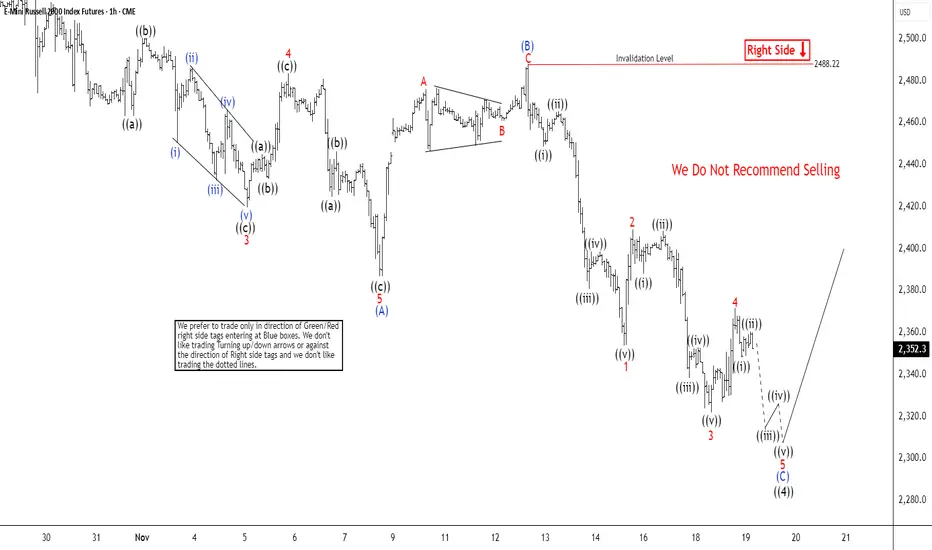
Zigzag Structure in Russell (RTY) Nears Resolution Around 2300The short-term Elliott Wave outlook for the Russell 2000 Index (RTY) indicates that the decline from the October 25, 2025 peak is unfolding as a zigzag corrective structure. From that high, wave 1 concluded at 2473.9, followed by a corrective rally in wave 2 that terminated at 2517.2. The Index then extended lower in wave 3, reaching 2419.6. A brief recovery in wave 4 ended at 2483.4, while the final leg, wave 5, completed at 2386.6. This sequence marked the completion of wave (A) at a higher degree.
Subsequently, the Index corrected higher in wave (B), which concluded at 2486.67, as illustrated in the accompanying one-hour chart. From that point, the Index has resumed its descent in wave (C), which is unfolding internally as a five-wave diagonal. Within this structure, wave 1 ended at 2353.8, and the corrective rally in wave 2 peaked at 2409.1. Wave 3 then declined to 2321.9, followed by a modest rebound in wave 4 to 2371.6.
The Index is expected to extend lower in wave 5, thereby completing wave (C) of ((4)). The projected downside target lies within the 100%–161.8% Fibonacci extension range from the October 27 peak, spanning 2316.3 to 2307.4. In the near term, as long as the pivot high at 2486.6 remains intact, any rally is anticipated to fail in three, seven, or eleven swings, paving the way for further downside pressure.
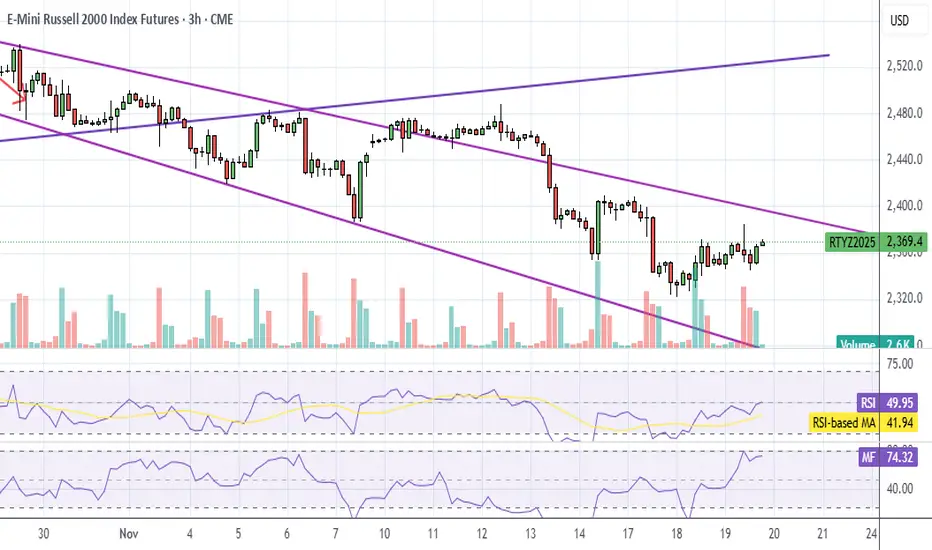
RTY UpdateSeems like the market has given up on small caps, lol. They're not even bothering to pump futures unless MFI and RSI get way oversold. Will most likely hit the purple line below.
Also, small caps aren't done tanking until garbage like FCEL go back down to where they belong. I'll plot it.
RTY UpdateDaily MFI is almost oversold, but I'm not sure that matters.
I'm still bearish on small caps because there's still a bunch of total garbage companies that haven't fallen to proper levels, such as FCEL.
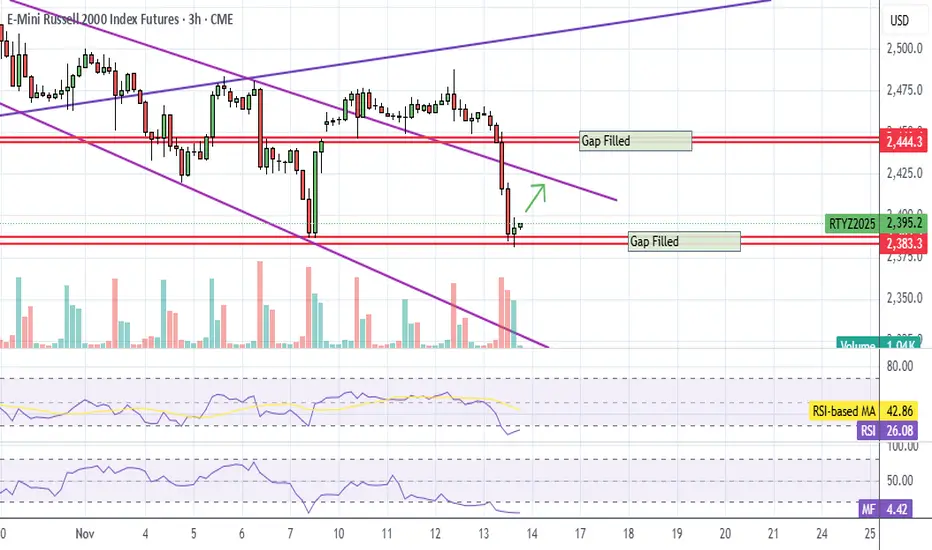
RTY UpdateRTY not only filled the Sunday gap but also the TACO gap.
Not sure where the market is headed long term, but I expect a bounce either tomorrow or Monday.
The bearish part is that it's back in the down channel. It has to break back through the purple line to rally. Not sure if it does or not. We'll find out next week.
Upside momentum is slowing downBe cautious on the long side in the S&P 500 daily chart. Momentum still favors the upside. However, the structure indicates that momentum is slowing down so be cautious on the long side of this market.

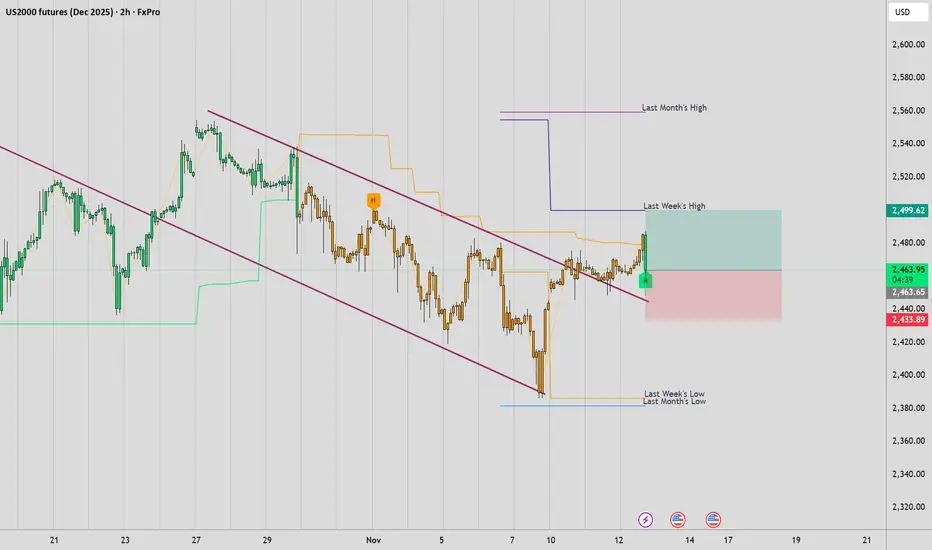
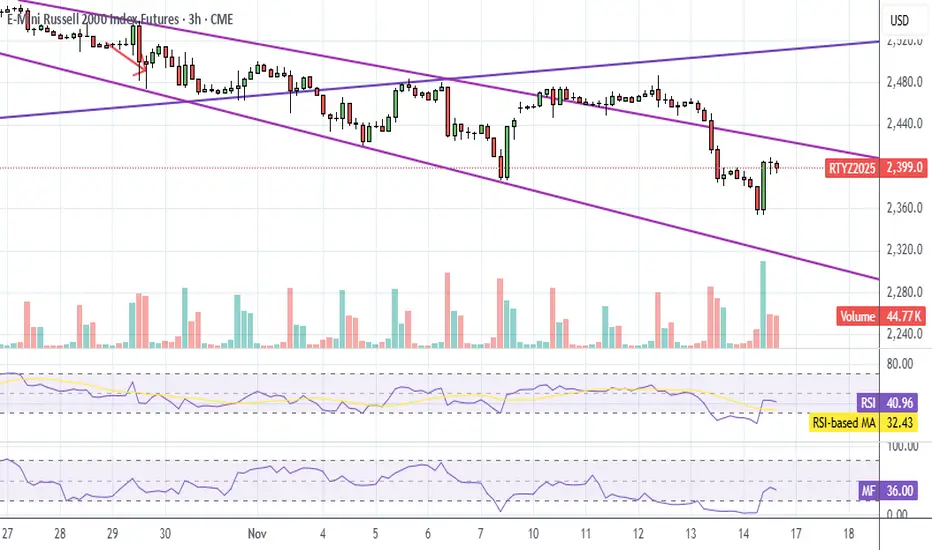
us2000A trendline got broken, and the price has pulled back to it—keep an eye on it for a possible move up .
Dear friends,
I warmly invite you to like this post, leave a comment with your thoughts, and share it with your friends. Your support truly means the world to me!
Your likes, comments, and shares are incredibly inspiring and encourage me to create and share more analysis with you all.
Thank you so much for your kindness and encouragement!
Warm regards,
Max