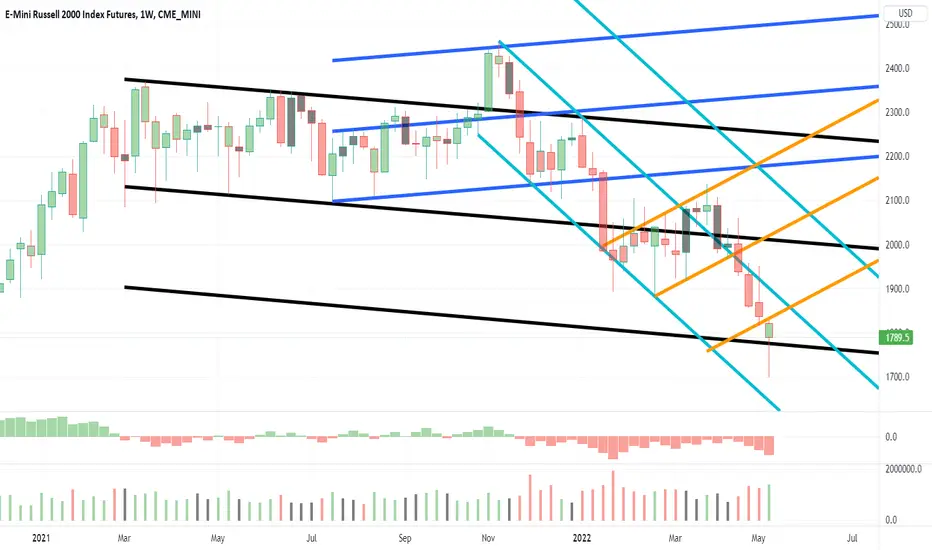
Russell2000 Pivotal Equality TestIn this update we review the recent price action in the Russell200 futures contract and identify the next high probability trading opportunities and price objectives to target
RTY1! trade ideas

RTY1! - Weekly Market Update, 6/13/22Russell exhibiting weakness, looking for near term support @ 1765.

E-MINI Russel 2000 index (pressure concepts/tutorial) To optimise your "edge" practice identifying previous demand and supply zones. These zones have multiple titles. Some analysts call them "order blocks".. I do like order blocks because it does assume a square pattern. Accumulation patterns tend to outline as a square whereas RE accumulation will take on more of a triangular pattern.
Imagine if you will an accumulation pattern. This pattern can vary as far as time. But in general these should b considered "HIGH PRESSURE" zones. Price can and will exit this "block" without utilising all of the stored pressure... however, this pressure is still in this zone. When and if price does return here, it will encounter this pressures and there will be a reaction.
There are 3 ways in which price will react:
1- Price will find pressure and "bounce" off of this previous box and continue to "mark-up"
2- Price will find this pressure and begin another "trading range" until demand exceeds supply
3- Price will get to this area and find minimum to no pressure and will continue on its trajectory
These concepts are not difficult to see with practice. The most difficult part of any trading strategy is waiting for what you want to see.
When you hear traders talk about looking left on the chart, this is what is going on. It could sometimes take months to years for price to return to these price areas, indeed. It can also tale a few hours. It depends on wether or not you are trying to day trade or invest longterm.
Regardless of strategy, in order to minimise risk, it is paramount that you become aware of these previous "HIGH PRESSURE" zones. You never want to short into a previous demand zone, nor do you ever want to go long into a previous supply zone. Volume helps to facilitate you and I spotting this "residual" volume iin these high pressure zones.
These concepts are difficult to type/explain. I am contemplating some sort of video series, text so that I can share these concepts. These concepts however, ARE NOT MINE. They are the charts... they are for all of us to exploit. But in order for anyone to exploit these weaknesses, you need to practice. Trading view is absolutely the best platform to do this and I am certain that if traders began trading accurately using volume, trading view would start charging to use what is currently the free volume indicator. It is THE most powerful TA indicator.
Again these are difficult concepts to explain and I do appreciate if you made it through this tutorial
Sources of education:
Richard Wyckoff
Tom Williams Volume spread analysis VSA/ Master the Markets
Pete Faders VSA*
Sam Seiden (supply and demand)
Read the ticker dot com
Wyckoff analytics
PsychFX
MentFX
Element 15 trades (bitchute/odessy)
Avoid buying into weakness/supply/resistance
Avoid selling into strength/demand/support
Avoid entry when price is in middle of a range (phase B)

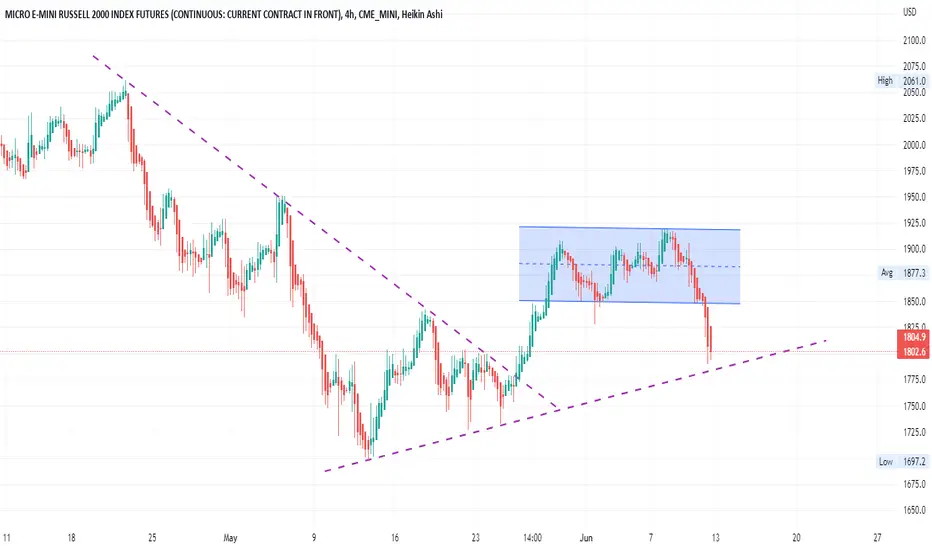
MICRO E-MINI RUSSELL 2000 INDEX FUTURES (CONTINUOUS: CURRENT CONBreaking the very strong support area and having very strong sales opportunities and now we are likely to get purchasing opportunities to bounce back from the second support areas or the demand area
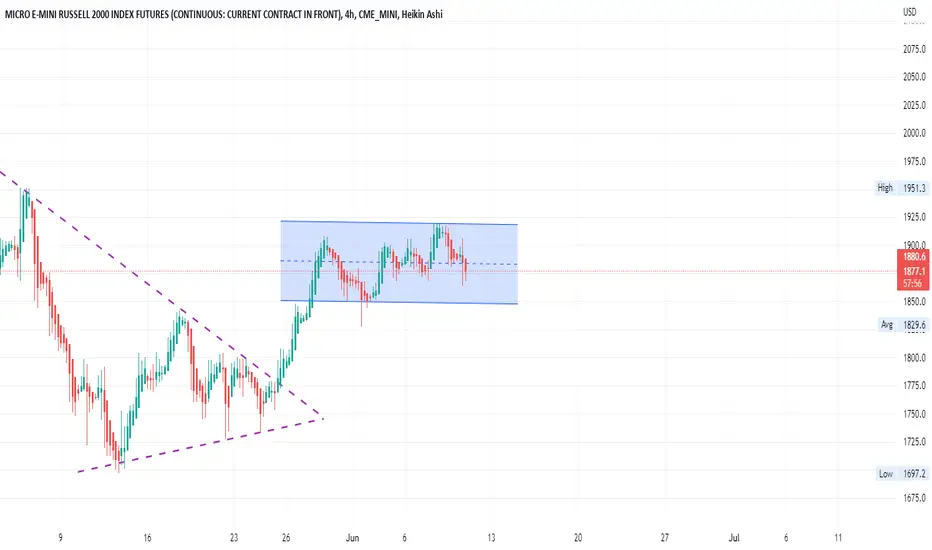
MICRO E-MINI RUSSELL 2000 INDEX FUTURES (CONTINUOUS: CURRENT CONTeddy bear is very sharp and powerful and will often face the tilt of strong bounces and we cannot enter until it comes out of this strong area
RTY MFI OversoldRTY MFI is oversold, the other indices are not even close.
Market did rally off RTY last week, so I flipped all my puts. Gonna sit back and watch now, since I'm not sure what the market is gonna do.

RTY - Resistance (0.5) Turned Support0.5 is acting as a support now as price has moved way above it, prior to this it was a resistance point as price tested it
This bullish assumption is supported by the RSI, showing an Inverted H&S pattern, just completing the Right Shoulder
This 0.5 fib line should act as a support now

RTY UpdateChart pattern and indicator directions looks bearish.
NQ MFI is oversold though, which is why I didn't comment earlier, was expecting a sector rotation day. Now NQ looks weak despite being oversold.
Looks to me like strictly an Euro futures pump, if futures sell off then garbage stocks are toast. They didn;t rally with the market at all.

RTY UpdateRTY and NQ MFI are overbought and it's starting to look a lot like my overlay.
We'll see what the algos do premarket, but looks pretty bearish, Euros did not pump as I expected.

Channel and Monthly PivotsBy the time we recognize a pattern, it's normally too late to take action on it. Despite that, here's what has been developing.

Russell Targeting A Trendline TestIn this update we review the recent price action in the Russell futures contract and identify the next high probability trading opportunity and price objective to target

Key Technical Areas In The E-mini S&P, Nasdaq & Russell 2000We're in a phase of the markets where the E-mini S&P 500, E-mini Nasdaq 100 & E-mini Russell 2000 Futures are all moving together without divergences. This is a good look for Index traders because when the Indexes are working together we get cleaner moves. In this video I go over the key technical areas I am seeing in these Indexes and how I now have a line in the sand for the bulls to hold. In the video I use Bollinger Bands, Anchored VWAP, 10 day simple moving average and my Beacon Indicator (it's free and open source here on TradingView).
I mentioned in the video I am using Micro Futures to execute some of these trades. To learn more about these products go to CME Group's website. I am also executing my futures on TradeStation which you can connect to TradingView to trade spot, futures and crypto. To learn more you can go to TradeStation dot com/anthony.
Derivatives trading is not suitable for everyone. Past performance is not indicative of future results.

RTY Update (MFI very oversold)Small caps got rejected by resistance (the old support), I think it drifts sideways and then eventually collapses again.
After I saw this plot I flipped all my puts, will re-enter when RTY challenges the resistance again.

ES Russell5.29.22 ES and Fussell going higher, and then look for sellers, and possible new lows. Started to talk about the Medallion Fund.

RTY1! - Weekly Market Update, 5/31/22Russell 2000 triggers a buy signal, however like the Nasdaq and S&P - the risk outweighs the reward. For the shorter-term trader, employing a smaller time frame strategy - perhaps this market could offer some continued relief rally upside. I've adjusted support and resistance structures accordingly for your reference.

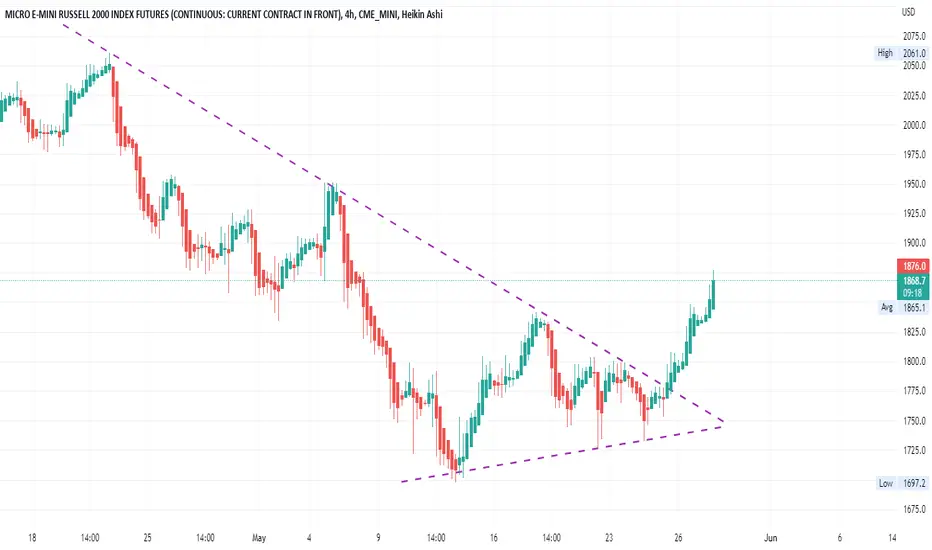
MICRO E-MINI RUSSELL 2000 INDEX FUTURES (CONTINUOUS: CURRENT CONPenetrating the strongest areas of strong resistance and reversing the trend to become a powerful ascendant There is a very strong chance of ascending while continuing to accelerate upwards
RTY Daily Support Shows it is holdingThe RTY Daily time frame is in a down channel. The
market hit the bottom of the channel and found
support. The market is now pushing bullish towards
the top of the channel price point 1936.2 about
+803 ticks above the market. It will be a good
idea to turn to the one hour time frame and to
look for long ideas in the buy zone.

RTY1! - Weekly Market Update, 5/23/22Russell 2000 has settled practically right on the key BLACK support structure I mentioned last week.
I do not see a setup to execute at this time based on current support and resistance structures.
If anything should change, I'll gladly issue a midweek update...
Wishing you a blessed and profitable week ahead!

Recession? Then Why is the RTY Outperforming?Usually a slowing in the economy hurts the growth oriented RTY the most. Instead, it is outperforming.

Russell Testing Pivotal ResistanceIn this update we review the recent price action in the Russell2000 futures contract and identify the next high probability trading opportunities and price objectives to target

A long-overdue small-cap reboundThe small-cap Russell 2000 Index has been the underdog among the four major US indices since last year. Its post-pandemic rally halted in early 2021, and subsequently, it went sideways for more than a year without making new highs. Meanwhile, the tech darlings continued to go north all the way until the beginning of this year.
The first half of 2022 has been marked by widespread risk-off sentiment and a precipitous drop in the US equity market. After being down almost 30% from the high, we now find the Russell 2000 Index at significant technical support levels that we believe a meaningful rebound will likely ensue.
The Index has bounced right at the 50% Fibonacci retracement level near 1700. We also observed bullish RSI Divergence where price made lower lows, but RSI showed higher lows, suggesting the bearish momentum is waning and at the cusp of a reversal.
Entry at 1806, stop above 1680. Targets are 1880 and 2100.
Disclaimer:
The contents in this idea are intended for information purposes only and do not constitute investment recommendations or advice. Nor are they used to promote any specific products or services. They serve as an integral part of a case study to demonstrate fundamental concepts in risk management under given market scenarios.

RTY - JunkCo IndexIndependent Producers remain in implosion mode.
Bankrupt Companies feigning existence worthy of a Bid.
Chasers will be wrecked again 1610 fails and it's going
to lose 90%+ into 2023 October.
______________________________________________
For now - the Flamingo is having a bit of difficulty getting
gamblers back to the tables.
A complete horror show... this JUNK.

RTY1! - Weekly Market Update, 5/16/22Nasdaq futures like the other major indexes have tested their BLACK channel monthly support structure and have at least based on this past Friday's action bounced slightly. Even if this downtrend continues, there's likely to be some relief at this point. If this past Friday was all of the relief or not, that's yet to be seen. I do not see any actionable ideas offered at this point in time on this particular index. Stay calm, disciplined and consistent - those who do will prevail. Wishing you a blessed and profitable week!