Tuesday, Oct 21st Weekly Forecast UPDATES!Welcome to the Weekly Forecast Updates!
In this video, we will analyze the following markets: DXY, EURUSD, GBPUSD, NASDAQ, S&P500
Enjoy!
May profits be upon you.
Leave any questions or comments in the comment section.
I appreciate any feedback from my viewers!
Like and/or subscribe if you want
About S&P 500 E-mini Futures
S&P 500 — short for Standard and Poor's 500, is a United States stock market index based on the market capitalizations of the top 500 companies that have common stock listed on the New York Stock Exchange or NASDAQ. With its headquarters in New York City and dating back to 1860, Standard and Poor's has offices in 23 countries and maintains the SP 500 index. Over $1.25 trillion USD is indexed to Standard and Poor's portfolio of indices, which includes the S&P 500. The S&P 500 index seeks to reflect the status of the whole stock market by tracking the return and volatility of the 500 most commonly held large cap company stocks on the NYSE, capturing approximately 80% of total market capitalization. The 500 companies comprising the SP500 span all major industries and are selected based on their market capitalization, liquidity, ability to be traded, as well as other factors. Additionally, the importance of the SP500 is highlighted by its use as an economic indicator of the health of the United States economy.
Related futures

Day 55 — Trading Only S&P Futures | +$452 | Rested and FocusRecap & Trades
Day 55 — I finally caught up on sleep last night and it made a huge difference.
Woke up focused, saw the bullish structure signal early, and just stayed on the long side all session.
Didn’t fight the trend, didn’t short — just stayed in BTD mode and let the system do the heavy lifting

ES - October 24th - Daily Trade PlanOctober 24th - 6:35am
*Before reading this trade plan, IF, you did not read yesterdays, or the Weekly Trade Plan take the time to read it first! (You can see both posts in the related publication section) *
If my posts provide quality information that has helped you with your trading journey. Feel

ES UpdateAlgos going for the pump and dump again.
If CPI numbers are good, we're gonna see a mega pump tomorrow to hit the tip of the wedge formation. I've seen that happen a lot. If they're bad, then we gonna finally fill that gap below next week.
No idea which way it will go. 8:30am tomorrow. Delaye

SANTA RALLY OR BLACK FRIDAY ...... THOUGHTS?This is this weekend's whiteboard projections for the next 6months.
This shows a slight reclaim this week but a continuation of lower highs and lower lows.
Then a drop to the bottom of the narrower channel when China tariffs & rare earth restrictions are reflected in earnings guidance as Mag7 repo

ES (SPX, SPY) Analysis, Key Levels, Setups for Fri (Oct 24)ES Two-Way Plan (A++) — Level-KZ 15/5/1
Calendar (ET) — Fri Oct 24:
08:30 CPI (Sept).
09:45 S&P Global flash Manufacturing/Services PMIs.
10:00 Univ. of Michigan Consumer Sentiment (final).
14:00 Federal Reserve Board open meeting.
Expect compression into 08:30 → expansion on release; execute

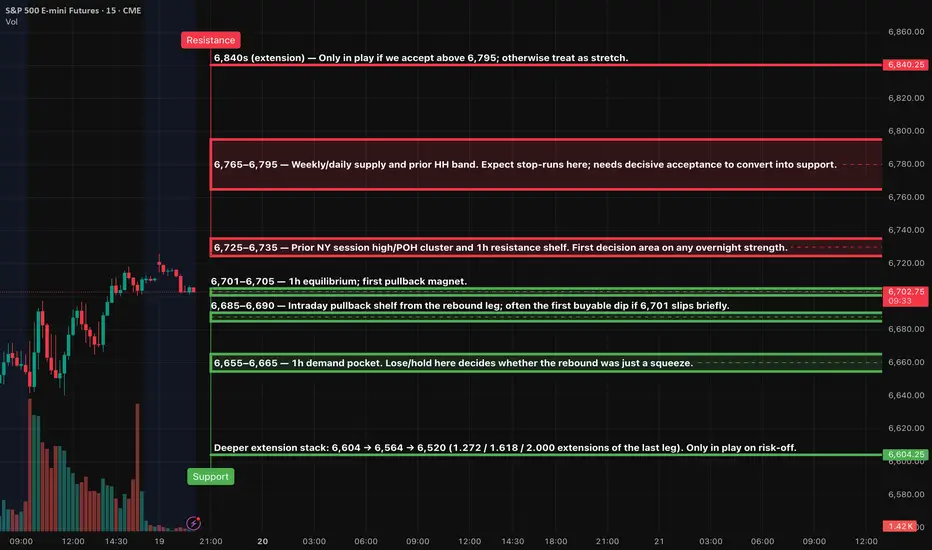
ES (SPX, SPY) Analysis Week-Ahead (Oct 20th - 24th)Market Structure Overview
Price has shown a robust rebound from last week's discount levels, now trading back near the 6,720 area following a swift flush and subsequent V-shaped recovery.
Currently, we remain capped under the supply zone between 6,765 and 6,795, which represents the previous swi
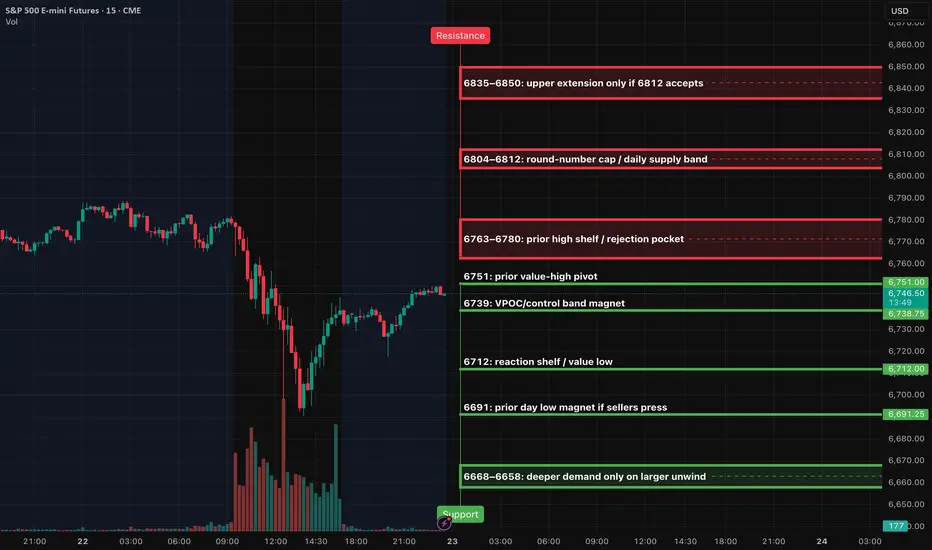
ES (SPX, SPY) Analysis, Key Levels, Setups for Thur (Oct 23)Bias: The market shows a neutral to slightly bullish outlook as long as prices remain above the 6739–6751 control band. A decisive break and sustained trading above 6780 would indicate a shift in momentum to the upside, targeting the levels of 6804 to 6812. Conversely, if we lose support at 6739, w
S&P 500 E Mini Futures (ES) Advance in Wave 5 RallyThe short-term Elliott Wave analysis for the S&P 500 E-Mini Futures (ES) indicates the Index is currently in the final leg of wave (5), originating from the April 2025 low, before a larger three-wave correction unfolds. The decline to 6540.5 marked the completion of wave (4), followed by an upward t

Buyers are shakyBuyers failed to follow through in the daily chart of the S&P 500. This implies buyers are shaky and settling that we've seen so far implies profit-taking. If your home alongside be cautious in this market.

See all ideas
Summarizing what the indicators are suggesting.
Neutral
SellBuy
Strong sellStrong buy
Strong sellSellNeutralBuyStrong buy
Neutral
SellBuy
Strong sellStrong buy
Strong sellSellNeutralBuyStrong buy
Neutral
SellBuy
Strong sellStrong buy
Strong sellSellNeutralBuyStrong buy
A representation of what an asset is worth today and what the market thinks it will be worth in the future.
Displays a symbol's price movements over previous years to identify recurring trends.
Frequently Asked Questions
The current price of S&P 500 E-mini Futures is 6,827.00 USD — it has risen 0.77% in the past 24 hours. Watch S&P 500 E-mini Futures price in more detail on the chart.
The volume of S&P 500 E-mini Futures is 1.20 M. Track more important stats on the S&P 500 E-mini Futures chart.
Open interest is the number of contracts held by traders in active positions — they're not closed or expired. For S&P 500 E-mini Futures this number is 1.87 M. You can use it to track a prevailing market trend and adjust your own strategy: declining open interest for S&P 500 E-mini Futures shows that traders are closing their positions, which means a weakening trend.
Buying or selling futures contracts depends on many factors: season, underlying commodity, your own trading strategy. So mostly it's up to you, but if you look for some certain calculations to take into account, you can study technical analysis for S&P 500 E-mini Futures. Today its technical rating is strong buy, but remember that market conditions change all the time, so it's always crucial to do your own research. See more of S&P 500 E-mini Futures technicals for a more comprehensive analysis.