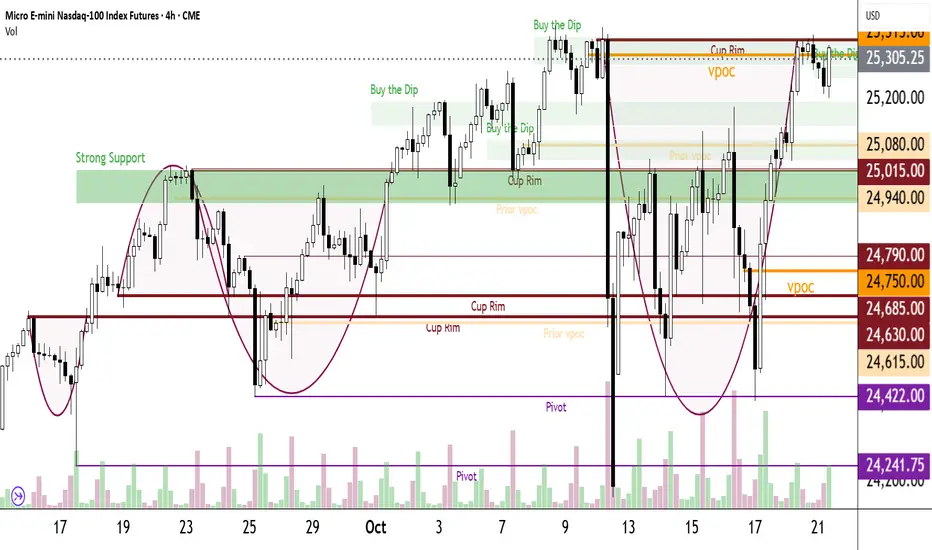
NQ Range (10-20-25, Week 4)NAZ is traveling within the Churn Zone, looking for a Breakout. Favoring a lower move prior to an upside Breakout. Scalping Shorts to KL's until "all hell breaks loose". Lower CZ currently is providing U Turns with the BTD/FOMO's redirecting the NAZ. The O/N, Dead Zone Lifting while the Open Drive c
About NASDAQ 100 E-mini Futures
An index composed of the 100 largest, most actively traded US companies listed on the Nasdaq stock exchange. This index includes companies from a broad range of industries with the exception of those that operate in the financial industry, such as banks and investment companies.
Related futures

NQZ2025 Return to Wick 50% then liquidity purgeOn the 4h chart, I see price close above the 50% of a 4h Order Block and above a 1h gap. I think the market has a high probability of treating the gap as an inversion, that, with the confluence of DXY purging shorts and the weekly wick 50%.
Therefore, the next likely target is the liquidity resting

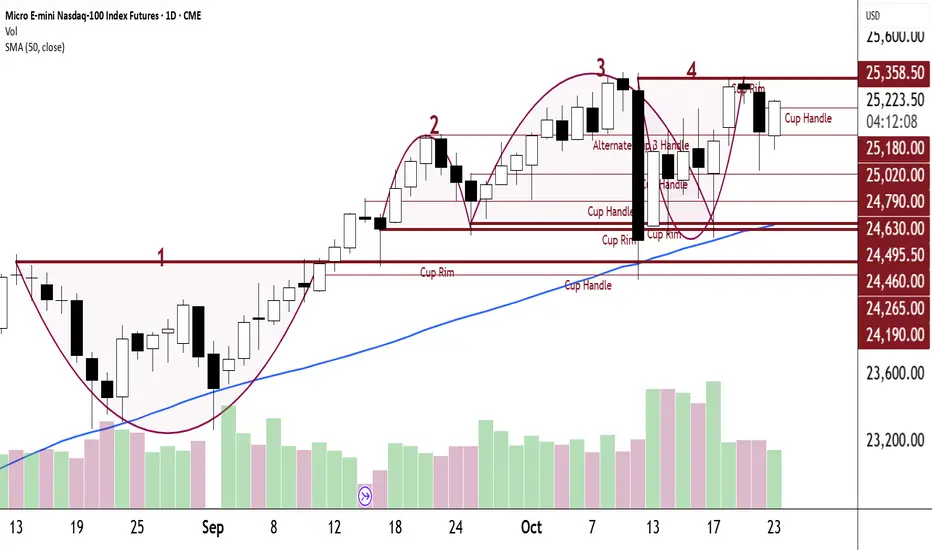
"Second verse, same as the first!"A throwback to 1965's Herman's Hermits "I'm Henery the Eighth, I am".
This is the same chart as yesterday's only using a Daily Chart. I want to emphasize the power of the market forces at work right now. I want you to see and feel the history being made. It is unfolding day upon day, week upon week
NASDAQ 100 (NQ1!): Wait For Valid Buys! #nasdaq Welcome back to the Weekly Forex Forecast for the week of Oct. 20-24th.
In this video, we will analyze the following FX market: NASDAQ (NQ1!) NAS100
The NASDAQ had ranged last week, but had a bullish end on Friday. I suspect we may see some continuation to the upside this week.
Wait for confirma

Breaking Down my Strategy for YM Trade46,700 to 45,700 is my prediction this week. I'm breaking down my thought process for journaling purposes.

Bullish on NQ @ Asian open.NQ pushing slightly higher at Asian open. Will most likely test lower to VWAP, before rebounding and making higher highs by the New York close.

''...a barrow by the wide Hellespont.''"And some one shall one day say even of men that are yet to be,
as he saileth in his many-benched ship over the wine-dark sea:
'This is a barrow of a man that died in olden days, whom on a time
in the midst of his prowess the glorious Hector slew.' So shall some man say, and my glory shall never die
NQ 4HR POSSIBLE MOVE AND TARGETSUsing the last swing up and pull back the market is already inside the 50/60.2/70.5 area to push higher pass the BOS

Impulse Channelbrief Impulse Channel visual. showcased on the 15 minute timeframe via SEED_ALEXDRAYM_SHORTINTEREST2:NQ
Bullish continuation for NASDAQ?
📊 CME_MINI:NQZ2025 Analysis – Oct 18, 2025
🧠 Market Context:
Price recovered back into Premium of range (the upper part of the current weekly range) after the drop to 24,158. Creating an inside week that managed to provide a Bullish close.
Inside Week consolidated in an 1H frame.
P

See all ideas
Summarizing what the indicators are suggesting.
Neutral
SellBuy
Strong sellStrong buy
Strong sellSellNeutralBuyStrong buy
Neutral
SellBuy
Strong sellStrong buy
Strong sellSellNeutralBuyStrong buy
Neutral
SellBuy
Strong sellStrong buy
Strong sellSellNeutralBuyStrong buy
A representation of what an asset is worth today and what the market thinks it will be worth in the future.
Displays a symbol's price movements over previous years to identify recurring trends.
Frequently Asked Questions
The current price of NASDAQ 100 E-mini Futures is 25,509.25 USD — it has risen 1.01% in the past 24 hours. Watch NASDAQ 100 E-mini Futures price in more detail on the chart.
The volume of NASDAQ 100 E-mini Futures is 460.04 K. Track more important stats on the NASDAQ 100 E-mini Futures chart.
Open interest is the number of contracts held by traders in active positions — they're not closed or expired. For NASDAQ 100 E-mini Futures this number is 284.80 K. You can use it to track a prevailing market trend and adjust your own strategy: declining open interest for NASDAQ 100 E-mini Futures shows that traders are closing their positions, which means a weakening trend.
Buying or selling futures contracts depends on many factors: season, underlying commodity, your own trading strategy. So mostly it's up to you, but if you look for some certain calculations to take into account, you can study technical analysis for NASDAQ 100 E-mini Futures. Today its technical rating is strong buy, but remember that market conditions change all the time, so it's always crucial to do your own research. See more of NASDAQ 100 E-mini Futures technicals for a more comprehensive analysis.