Looks like we might finally get some pressure released on GoldIve been looking for price to break down. it has been on a bull run for well over a week now. and all this week it has pushed up with no pullbacks at all. Looks like we might have hit the high for the week and we could be getting a pullback from here. Waiting to see if we can break the previous Daily low for more bearish pressure.
GCF2021 trade ideas

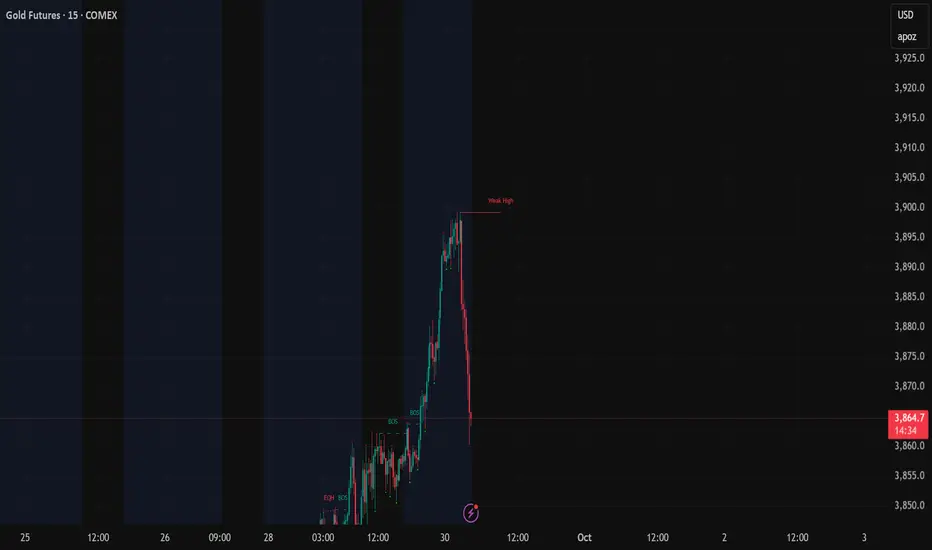
Gold Futures (MGCZ5) – H4 Gap in PlayPrice pushed aggressively bullish all day yesterday with little to no pullbacks. That momentum left behind a fresh H4 Fair Value Gap (FVG) sitting just above the Weekly High (WH) level.
If we see a pullback into this area, it could offer a solid setup for continuation higher.
⚠️ Key considerations:
If buyers stay strong, price may run liquidity above 3863.7 (D-H) before any meaningful retracement.
If sentiment shifts, a deeper draw into the Daily FVG below 3764 remains on the table.
With global uncertainty (military meetings, de-dollarization, possible U.S. shutdown), volatility risk is elevated.
🎯 Game Plan:
Watch the H4 FVG near WH for rejection / entry signals.
Bias remains bullish while above 3785 (D-L).
Break below D-L opens the door toward the Daily FVG.

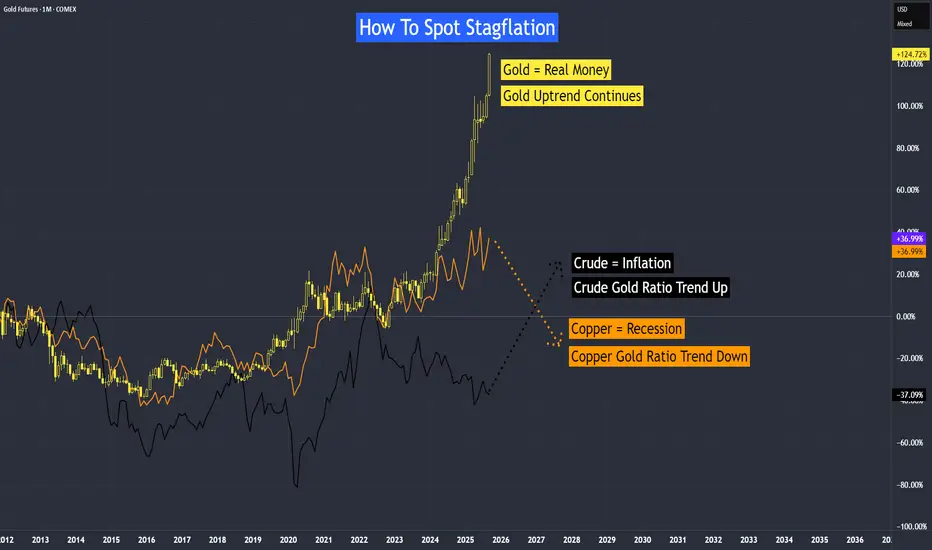
Tracking Stagflation with this Ratio - Crude, Copper, Gold RatioHow to Spot Stagflation?
One way is by looking at the copper-to-gold ratio and the crude oil-to-gold ratio.
• Gold reflects real money and investor confidence.
• Copper tracks recession.
• Crude oil represents inflation pressures.
When real money is under threat, the economy slows, and inflation rises at the same time, we have stagflation. This is the worst-case scenario for any economy. Fortunately, we are not experiencing it yet, though the risk remains.
What could trigger it?
Copper Oil Futures & Options
Ticker: HG
Minimum fluctuation:
0.0005 per pound = $12.50
Disclaimer:
• What presented here is not a recommendation, please consult your licensed broker.
• Our mission is to create lateral thinking skills for every investor and trader, knowing when to take a calculated risk with market uncertainty and a bolder risk when opportunity arises.
CME Real-time Market Data help identify trading set-ups in real-time and express my market views. If you have futures in your trading portfolio, you can check out on CME Group data plans available that suit your trading needs www.tradingview.com

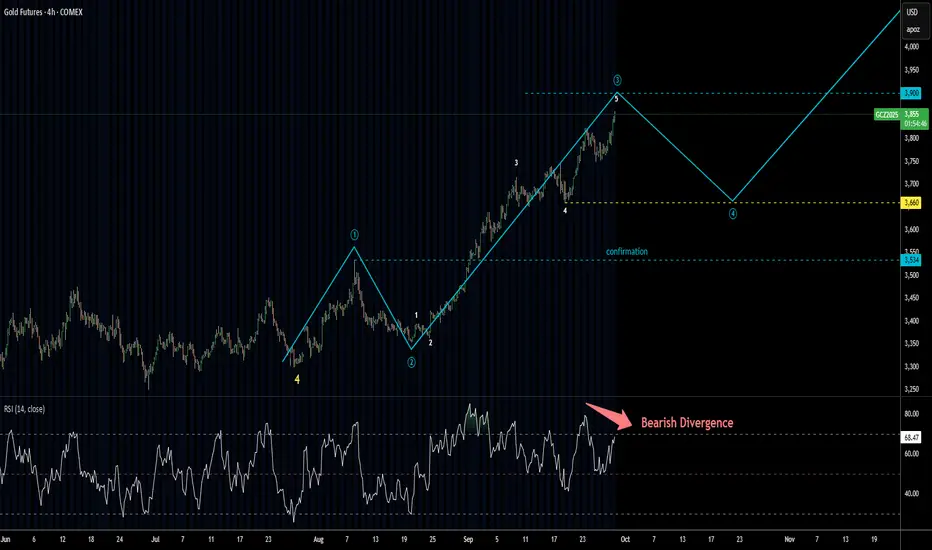
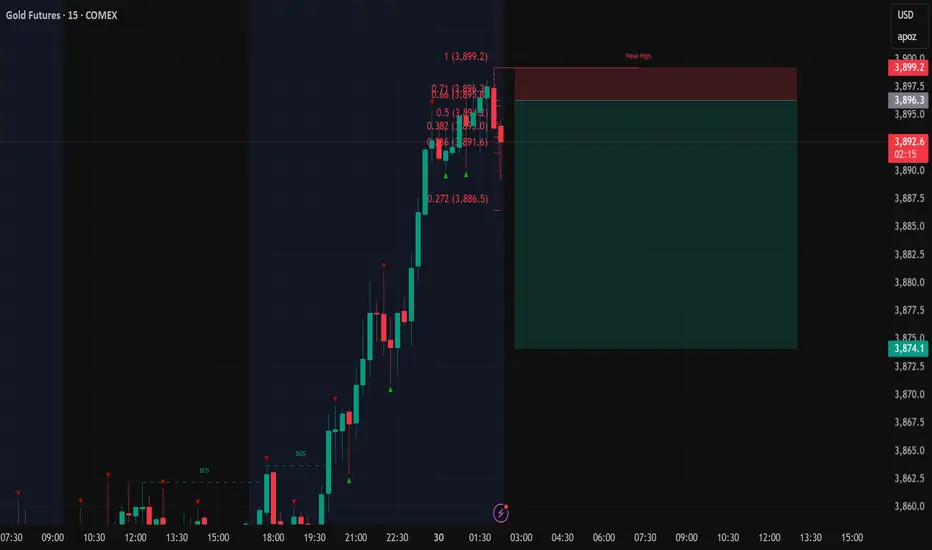
Gold Update 29SEP2025: Top Is Soon, Then PullbackGold Futures are following the projected path closely
The first target at $3,900 is now just "miles" away
This level could mark the top of wave (3) of ((5))
After that, we might see a pullback to around $3,660 in wave (4) of ((5)),
which typically revisits the low of the smaller wave 4
On the 4-hour chart, RSI shows bearish divergence,
as it fails to confirm the new high at $3,859 with a lower peak
Despite this signal, the market could still reach the $3,900 level
Once wave (4) of ((5)) completes,
we can reassess and project wave (5) of ((5)) —
which might form as a triangle or another complex correction.
How To Spot Stagflation?One way is by looking at the copper-to-gold ratio and the crude oil-to-gold ratio.
• Gold reflects real money and investor confidence.
• Copper tracks recession.
• Crude oil represents inflation pressures.
When real money is under threat, the economy slows, and inflation rises at the same time, we have stagflation. This is the worst-case scenario for any economy. Fortunately, we are not experiencing it yet, though the risk remains.
What could trigger it?
Copper Gold Ratio - A downward trend signals slower growth and potential recession. This does not mean copper prices are falling; rather, if both copper and gold are rising but copper is climbing at a slower rate than gold, the ratio will continue to trend lower.
Crude Gold Ratio - As of now, the trend is still down, indicating that inflation remains under control. However, if crude oil starts moving higher, and its percentage change exceeds that of gold, the ratio will turn upward. Currently, inflation already seems to be pointing upward, and if the copper-gold ratio also rises, inflation is likely to trend higher than its current level.
Video version:
Therefore, stagflation = slow growth (copper-gold ratio) + high inflation (crude-gold ratio). Keep a close watch on the direction of copper and crude oil.
Copper Oil Futures & Options
Ticker: HG
Minimum fluctuation:
0.0005 per pound = $12.50
Disclaimer:
• What presented here is not a recommendation, please consult your licensed broker.
• Our mission is to create lateral thinking skills for every investor and trader, knowing when to take a calculated risk with market uncertainty and a bolder risk when opportunity arises.
CME Real-time Market Data help identify trading set-ups in real-time and express my market views. If you have futures in your trading portfolio, you can check out on CME Group data plans available that suit your trading needs www.tradingview.com
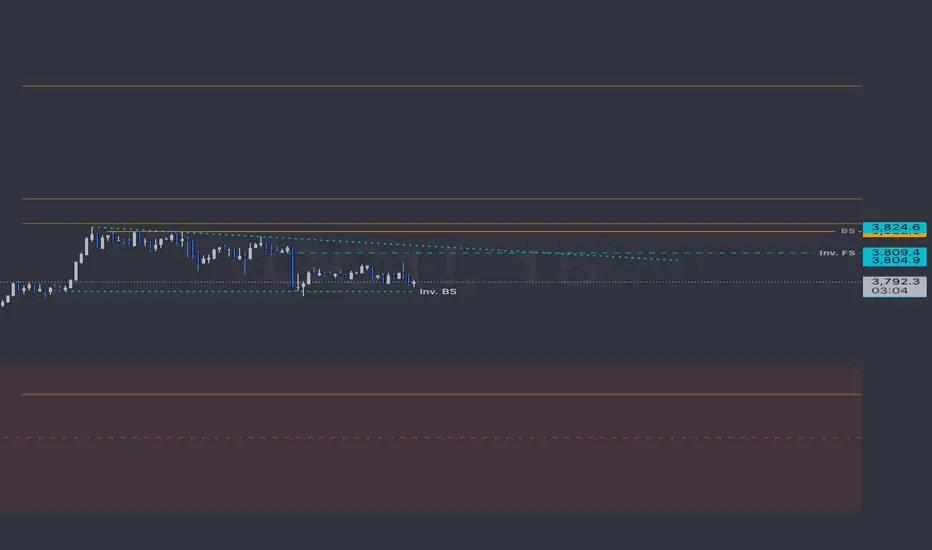
Gold Futures Weekly Outlook (MGCZ5)📍 Key Levels on Watch
Friday’s High (D-H): 3814.5
Friday’s Low (D-L): 3764.2 → New support
Weekly High (WFH): 3824.6
Weekly Low (W-L): 3717.7
Daily FVG Below: 3746.3–3735.2
🧭 Technical Outlook
Price is currently sitting right at the 50% midpoint of Friday’s move.
Friday’s Low (3764.2) is the key inflection point:
If defended → bullish continuation toward 3814.5 and possibly 3824.6.
If broken → expect a quick flush into the Daily FVG (3746–3735) before buyers step back in.
Volume profile shows a low-volume pocket below 3770, which could accelerate moves down into that Daily FVG if support fails.
🌍 Macro Context
De-Dollarization trends continue to support Gold in the longer term.
Geopolitical tensions (military leadership meetings this Tuesday + ongoing global conflicts) = potential safe haven demand.
US Political Risk: Government shutdown threats and loss of traction for the Trump administration add uncertainty → historically supportive for Gold.
Safe Haven Flows: When global stability is questioned, Gold is a direct beneficiary.
🎯 Scenarios to Watch
Bullish Case:
Friday’s low holds → retest of 3814.5 and possibly new weekly highs above 3824.6.
Bearish Case:
Break of 3764.2 → fast move into Daily FVG (3746–3735).
Watch for liquidity sweep & reversal setup inside that FVG.
📌 My Plan
Bias leans bullish this week given the macro backdrop.
BUT — I’ll wait for price to show its hand around Friday’s low before committing to either continuation or discount entries.
Staying flexible: both scenarios mapped, execution will be clean.

Gold Futures – Pullback Into H4 Supply Before Drop to Demand?Price sold off strongly from 3812 resistance and is now correcting higher. On the H4, I see a bearish supply zone between 3791.4–3769.9, which aligns with prior POC acceptance around 3790. If price pulls back into this area and fails, I expect continuation lower into the H4 demand zone at 3746.3–3735.2, which also lines up with Daily Low (DL) and Weekly High (WH) liquidity markers.
Levels to Watch:
Bearish H4 Supply: 3791.4–3769.9
Bullish H4 Demand: 3746.3–3735.2
Invalidation: Break & hold above 3795 could target 3812 liquidity.
Targets: First 3746.3, extended 3735.2.
Bias: Bearish pullback scenario into supply → downside continuation.

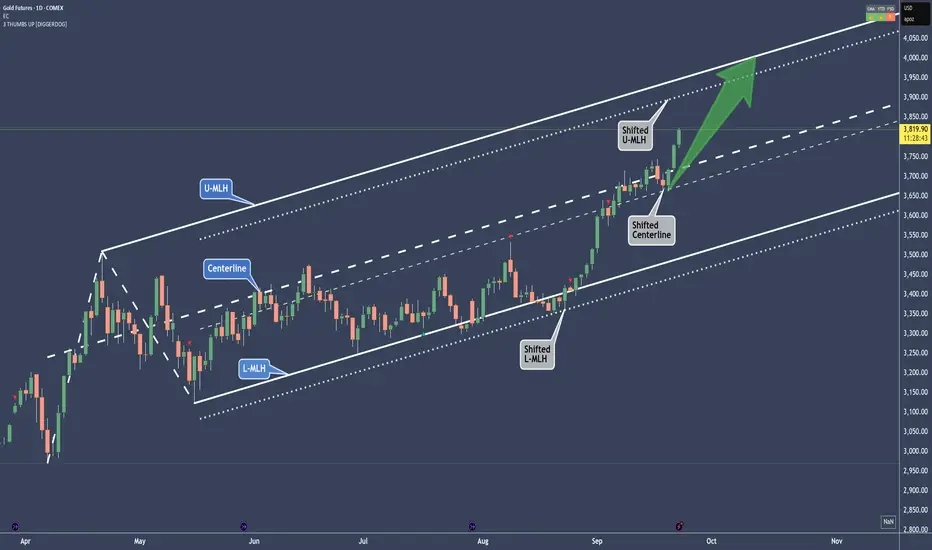
Gold - A shifted move in play and up to 4K🔱 Here’s a shifted move in play 🔱
What exactly is a shifted move?
You see the parallel lines next to the white fork?
Those are the shifted lines.
Now, if you observe how price behaved at the white fork, you’ll notice it was a bit sloppy at the L-MLH, and again at the Centerline after reaching it.
But when we add the dotted parallel lines to the chart and measure the distance from the overshoot at the L-MLH, we find a beautiful support at the Shifted Centerline.
The usual target would be the U-MLH.
So, could the target also be shifted?
And what does that tell us?
Well, if you’re long on Gold, you might want to take some profit at the Shifted U-MLH and let the rest ride up toward 4K—if there’s enough gas in the goose.
For me, a re-entry long would be a pullback to the Centerline—either the original or the shifted one—with a small stop just below some structure.
Let me know what you think ho far Gold will go in the comments.
😊 Thanks for boosting, thanks for following 🙏
GC 9/2615min TimeFrame.
I didn't post yesterday but I updated the levels as if I did and made them dotted as "tested"
dashed lines = "untested"
dotted 2x = origin levels where trends originate / bridge&Flip scenarios.
Yesterday we saw how pandora's box operates by laddering into a wedge. We'll watch as it breaks tomorrow.
at a quick glance it looks like a 15min timeframe is where $ is at. I didn't follow the breadcrumbs into the 5min timeframe but sure there are levels down there influencing price and break out scenario better than the 15min timeframe but we'll still see it breakout.
Global news might have us Stalling on Gold! Chart Context (MGC Futures, H1/H4)
Price stalled out after rejecting the H4 bearish zone (3791.4–3769.9).
Yesterday’s downside move lost steam before fully reaching the deeper H4 bullish demand (3746.3–3735.2).
We’re now compressing between Daily High (3792.1) and Daily Low (3752.0).
Fundamentals:
U.S. geopolitical/military headlines (Defense Secretary Pete Hegseth ordering hundreds of generals/admirals to an urgent meeting at Quantico, Sep 30) are creating uncertainty, which could trigger safe-haven flows in gold.
Bias Going Into Friday:
Watching for liquidity sweep of yesterday’s lows (~3752/DL). If swept and reclaimed, could trigger bullish continuation.
Alternatively, a clean break & hold above yesterday’s high (~3792/DH) sets up momentum longs targeting 3812+ (previous imbalance).
No trade in the middle of the chop — patience until liquidity is taken on one side.

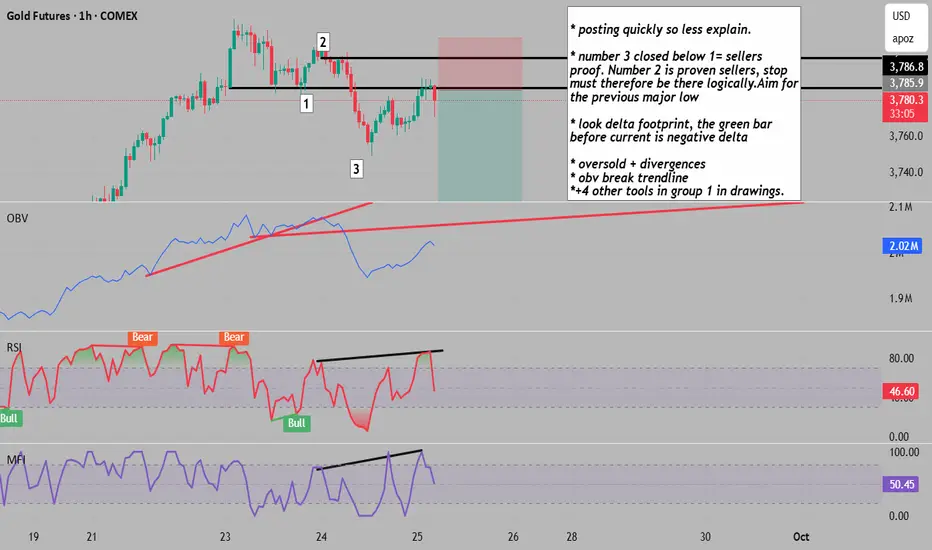
quick selloff entry opportunity
* posting quickly so less explain.
* number 3 closed below 1= sellers
proof. Number 2 is proven sellers, stop
must therefore be there logically.Aim for
the previous major low
* look delta footprint, the green bar
before current is negative delta
* oversold + divergences
* obv break trendline
*+4 other tools in group 1 in drawings.
Long trade Trade Journal Entry
Pair: MGC1! (Micro Gold Futures)
Trade Type: Buy-side trade
Date: Sun 29th June 2025
Session: 6.00 PM
TF: 1H
Trade Details:
Entry: 3,904.5
Profit Level: 4,134.5 (+18.47%)
Stop Level: 3,793.0 (–1.18%)
RR: 127.17
Wyckoff Narrative & Structure:
Phase A (Preliminary Support / Selling Climax): Market sold off into spring lows, where high volume absorption signalled potential accumulation.
Phase B (Building the Cause): An extended consolidation range is formed, marked by tests of support and resistance. Smart money accumulated positions while shaking out weak hands.
Phase C (Spring & Test): Price wicked below support to collect liquidity (spring event) before reclaiming the range. The test confirmed demand returning.
Phase D (Markup Initiation): Breakout above resistance with strong volume, creating a Sign of Strength (SOS) and retest zones acting as Last Points of Support (LPS).
Phase E (Trend Continuation): The current price action indicates a bullish continuation, in line with the long-term markup phase, which targets higher extensions (Fib 1.618 and above).
Feeling really good about this trade tbh.

Gold | 9/30Gold is acting golden. 4hr fib levels on chart to guess at price movements but the data on the screen that is relevant is a daily candle from yesterday that is holding price in a daily range so far as of writing this.
15min trends marked to track price through a reversal possibly to lower ranges and yesterday median to gain some supportive structure and levels for later this week.

GC pullbackMy setup here I will consider shorts
The best trades come to the patient, not the impulsive. Heaven rewards the same!
We Trade for Christ not profits. Profit is temporary, you cant take it with you.
and in doing so, trading becomes very easy.
GC pink colors are monthly levels
grey are weekly levels
red are daily levels
orange are 4hr levels
blue 15min levels
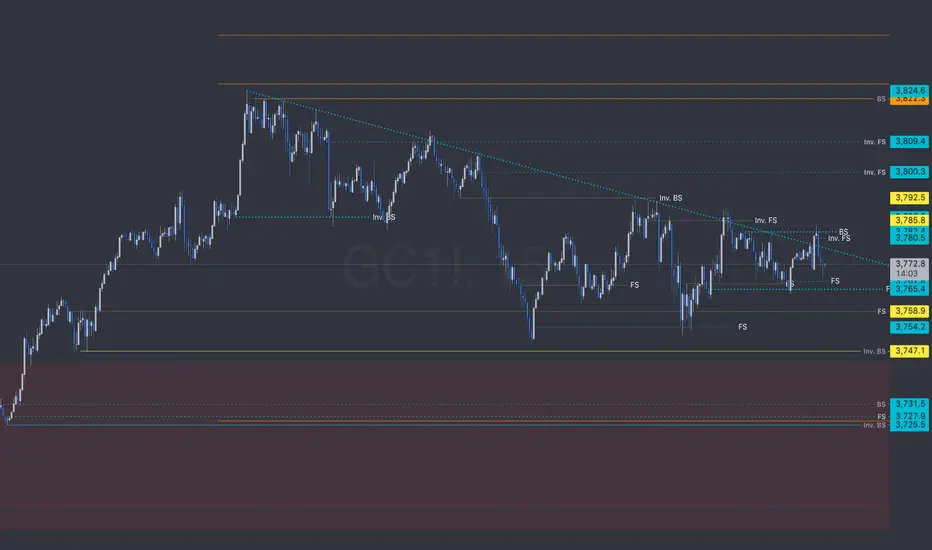
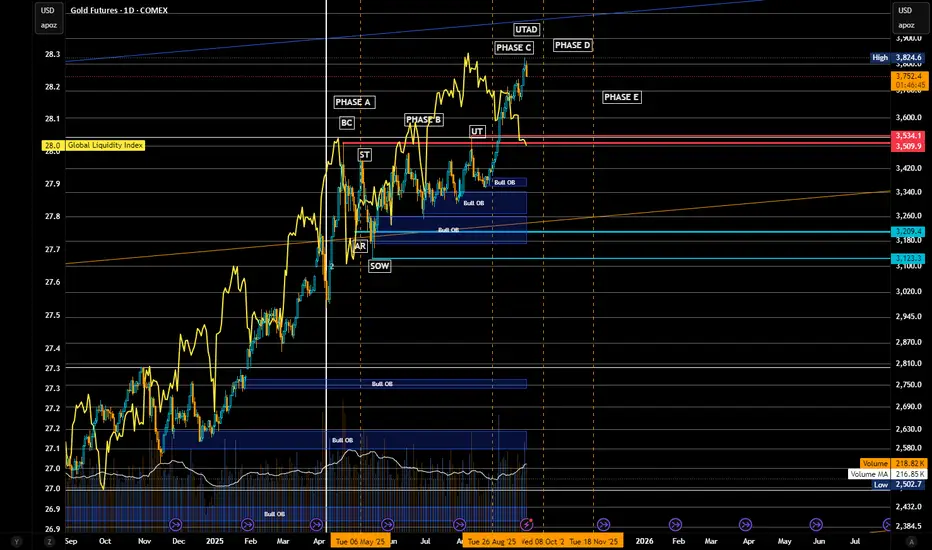
Gold Futures (GC) – “Top Is In” Schematic ReviewExecutive Snapshot 🧭
Primary stance: Bearish swing/top-in thesis (Wyckoff Distribution complete via UTAD).
Bias strength: High, while price remains below 3,825–3,860 and fails to accept above.
Game plan: Fade strength into supply; look for Phase D → E breakdown confirmation → target 3,534/3,509 → 3,209 → 3,123 then extended 2,970–2,795 if momentum accelerates.
Multi-Framework Confluence:
A) Wyckoff (your schematic) ♟️
Phases:
A/B: BC/ST established range highs; AR/SOW tagged mid/low of range.
C: UT → UTAD (new high on diminishing relative spread & mixed volume).
D (now): Throwback rallies holding beneath UTAD; look for LPSY near 3,760–3,825; failure → Phase E markdown.
Validation: Lower highs after the UTAD and repeated rejections of the supply shelf 3,760–3,825.
Confirmation trigger: Break and accept below ICE/Creek = 3,534–3,509 (your pink band) → distribution confirmed.
Macro Frame 🌐
Gold’s cyclical up-leg is extended; near-term macro supports a pause/reversion:
Real yields/beta & USD shocks can catalyze a value-seeking dip.
COMEX time-and-price run suggests heat above without equivalent build in value → mean-revert first, trend later.
Invalidation & Risk:
Hard invalidation (swing): Weekly close > 3,860 and acceptance above for 2–3 sessions (no swift rejection).
Soft invalidation (tactical): Daily close back inside 3,760–3,825 after a breakdown → step aside, wait for next LPSY.
Position/Risk Template:
Initial risk: above 3,825 (or 3,860 for wider swing).
Size: start ½–⅔ unit at first tag/reject; complete size on breakdown retest of 3,534–3,509.
Trailing: swing stop > last LPSY high once 3,534 is lost.
Momentum & Internals (Quick Read) ⚙️
RSI/ultimate RSI (your panels): persistent bearish divergence into UTAD zone.
MACD: high, curling; ripe for signal cross on daily if price slips under 3,600s → 3,534.
Squeeze/Momentum: elevated; release down would align with the distribution thesis.
Execution Checklist ✅
Pre-break:
Fade 3,760–3,825 on rejection candles/footprint absorption.
Track delta & volume—no expansion = stronger distribution read.
Break event:
Daily close < 3,534 → reduce discretion, execute plan; seek retest → LPSY to add.
Manage:
Cover +30–50 handles into 3,209–3,180; roll runner.
Data to watch: USD DXY spikes, GLD OI/put skew, dealer GEX flips around GLD 300.
One-Page Risk Map 🗺️
Bearish while: < 3,825–3,860.
Confirmation: < 3,534–3,509 (close/accept).
Targets: 3,209 → 3,123 → 2,970 → 2,795 → 2,541.
Stop/Invalid: > 3,860 w/ acceptance.
Marked UTAD and supply stack 3,760–3,825 present a clean risk-defined top. Until the market accepts above 3,860, the probabilistic path favors Phase E markdown back toward 3,2xx value and possibly the 2,9xx–2,795 extension if momentum breaks loose.
Gold Buy ModelAs we all know, gold has been trending up for quite some time now. With Fed Chair Roman Powell speaking about rate cuts in the future, this means that Gold is going to want to continue trending up.
Lower interest rates can also weaken the U.S. dollar, making gold cheaper for foreign buyers and increasing demand.
I do think gold will continue to trend higher, but I'd love to see a sweep of Asia session lows, potentially testing PDL before this happens. My area of interest is right around $3780 to $3775.

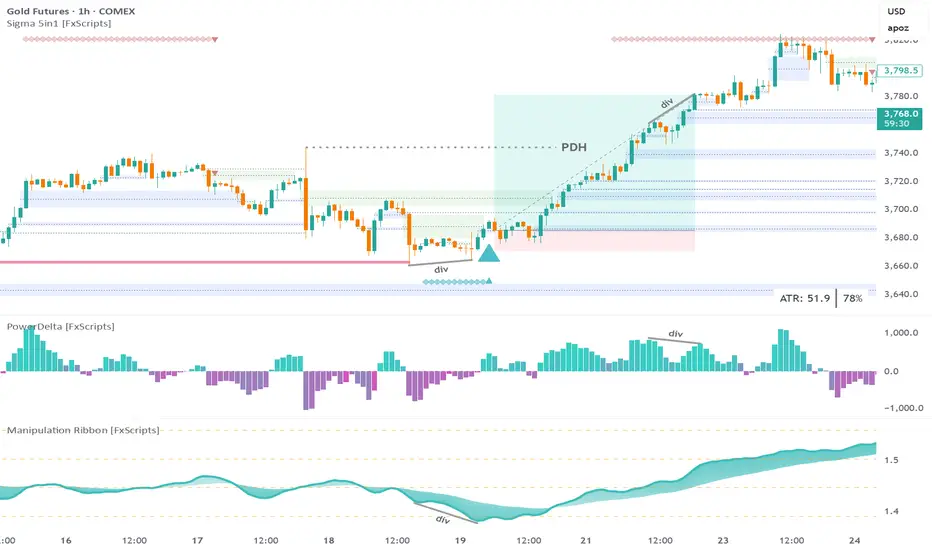
GC Futures 15m: 6.6:1 trade executed using Sigma Trading SystemStep 1: wait for a sweep of daily liquidity
Note: the sweep must be confirmed for any of the other confluences to be valid
Step 2: wait for a bullish marker to be drawn by the Reversal Print indicator
Tip: set an alert if you don’t want to spend all day staring at the chart
Step 3: look for a divergence with either the PowerDelta Oscillator or, in this case, the Manipulation Ribbon
Info: the Manipulation Ribbon detects areas of price manipulation by Market Makers vs areas where it is trading in a natural, price-driven state
Step 4: the entry is a tap of the most recent confirmed FVG
FYI: all the drawings on the main chart are created by the Sigma 5-in-1 indicator
SL: low of first candle that forms the entry FVG
Tip: for a more conservative approach the recent swing low could also be used
TP: bearish divergence with the PowerDelta Oscillator
Note: gold was at an all-time high so anything beyond the Previous Day High (PDH) posed a risk however for a more conservative approach you could exit half your position at the PDH
Gold Futures Bullish Setup – Entry at Demand Zone1. Channel Formation
The price is moving inside a rising parallel channel (blue lines).
Recently, the price broke below the midline (dashed blue) of the channel, indicating short-term weakness.
2. Trade Setup: Long (Buy) Position
The chart indicates a bullish outlook, expecting a price reversal from the demand zone.
🔹 Entry Zone
Entry Price: ₹116,251 – ₹116,277
This is marked with a grey zone, which aligns with a support area and previous consolidation.
🔻 Stop Loss (SL)
Stop Loss Price: ₹115,705 – ₹115,729
Placed just below the lower boundary of the support zone to protect against a false breakout.
🎯 Target (TP)
Target Price: ₹119,331 – ₹119,338 (LABA target point)
This lies above recent highs and near the upper boundary of the channel, suggesting continuation of the bullish trend.
3. Risk-Reward Ratio
The blue shaded box indicates a reward zone.
The trade has a favorable Risk-Reward Ratio (RRR) > 2:1, which is considered a strong setup.
🧠 Interpretation & Strategy
The red curved arrow indicates expected price action: a short-term pullback into the demand zone, followed by a bullish bounce toward the target.
The structure suggests a buy-the-dip opportunity within an ongoing uptrend.
⚠️ Key Takeaways
Component Value (INR)
Entry Zone 116,251 – 116,277
Stop Loss 115,705 – 115,729
Target 119,331 – 119,338
Trend Bullish inside channel
Risk/Reward Favorable (>2:1)
✅ Conclusion
This setup represents a bullish continuation pattern. If price revisits the highlighted demand/support zone, and forms bullish reversal candles (e.g., hammer, bullish engulfing), it could offer a high-probability long entry toward the upper end of the channel near ₹119,338.

Bottom Buying in GoldIn my recent analysis of Gold Futures, I spotted a classic bottom-buying opportunity on the hourly chart.
Gold was consolidating and testing support around the 50 EMA. Despite a flagpole pattern failure, I trusted the support level and managed my risk carefully. With a tight stop loss, I entered the trade right near the bottom retracement zone.
The result was impressive. Within just 2–3 hours, the trade delivered a strong profit, validating my setup and conviction.
At present, I am trailing my position with proper stop losses, ensuring that I capture as much of the ongoing trend as possible while protecting my gains. I’ll continue to maintain the trail as long as momentum stays active.
This setup reaffirms the value of sticking to disciplined technical analysis and executing with conviction, even when patterns appear to fail.

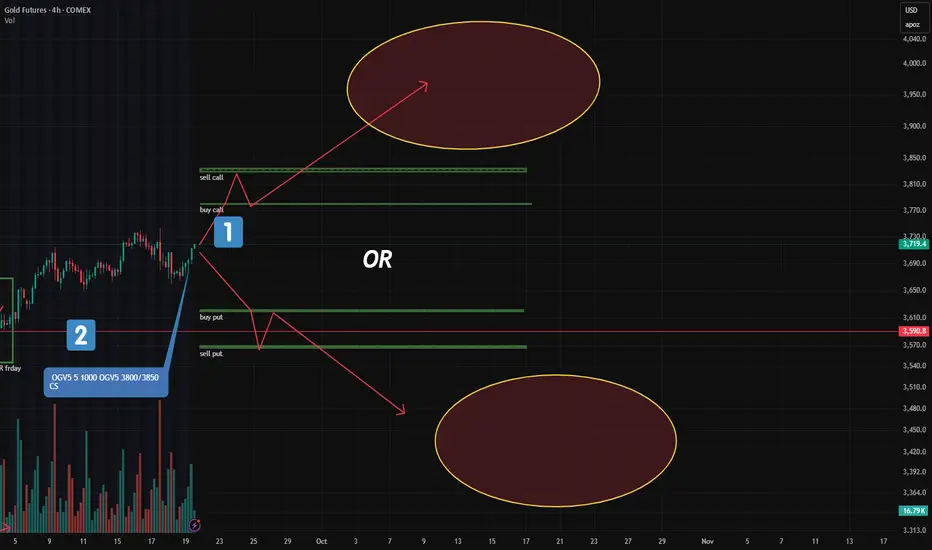
Gold: Major New Option Portfolios Signal Strong Moves AheadFriday’s CME report showed a surge in large option blocks in gold — two of them stand out.
🔹 1. "Long Condor" on December Futures (GCZ24)
This is the most significant structure added:
Targets a move below $3,620 or above $3,780
In other words: a breakout is expected, not consolidation
📌 Key point:
A "Long Condor" profits from volatility, not direction.
It wins if price moves sharply — up OR down — but loses if it stays flat.
💡 My note:
When I first encountered delta-neutral strategies like this as a Forex trader — my brain exploded.
No directional bias… yet clearly positioned for action?
That was the moment I realized: options are a different game.
🔹 2. Bull Call Spread (Oct Series): $3800–$3850
Another key play:
A classic bullish call spread at 3800/3850
Target: upside beyond current levels
But here’s the difference:
Unlike the "Long Condor", this one needs a clear upward move — and soon. Within a few days.
This isn’t about volatility.
It’s a directional bet that gold will rise.
🧠 Bottom Line:
One portfolio says: "Breakout coming — no matter which way."
Another says: "Gold goes up — and soon."
Are they aligned?
Contradictory?
Or could both win?
Trade smarter, not harder! Looking to boost your profits with valuable market insights and data-driven entry points? Join us or keep moving!
elliot wave counting GC Hit my fibo extension and now gold doing ending diagonal for wave 3 major of 5, so this week can short gold for wave 4 major
