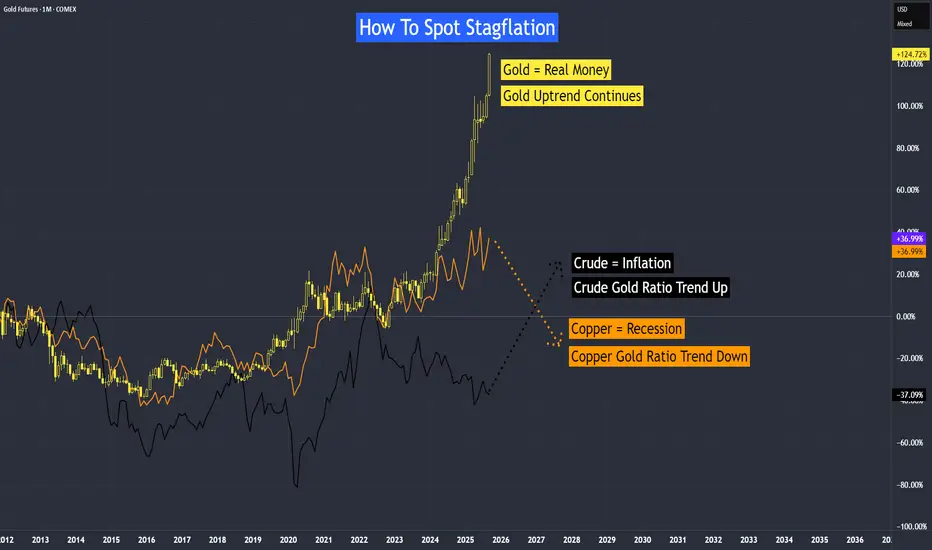
How To Spot Stagflation?One way is by looking at the copper-to-gold ratio and the crude oil-to-gold ratio.
• Gold reflects real money and investor confidence.
• Copper tracks recession.
• Crude oil represents inflation pressures.
When real money is under threat, the economy slows, and inflation rises at the same time, we have stagflation. This is the worst-case scenario for any economy. Fortunately, we are not experiencing it yet, though the risk remains.
What could trigger it?
Copper Gold Ratio - A downward trend signals slower growth and potential recession. This does not mean copper prices are falling; rather, if both copper and gold are rising but copper is climbing at a slower rate than gold, the ratio will continue to trend lower.
Crude Gold Ratio - As of now, the trend is still down, indicating that inflation remains under control. However, if crude oil starts moving higher, and its percentage change exceeds that of gold, the ratio will turn upward. Currently, inflation already seems to be pointing upward, and if the copper-gold ratio also rises, inflation is likely to trend higher than its current level.
Video version:
Therefore, stagflation = slow growth (copper-gold ratio) + high inflation (crude-gold ratio). Keep a close watch on the direction of copper and crude oil.
Copper Oil Futures & Options
Ticker: HG
Minimum fluctuation:
0.0005 per pound = $12.50
Disclaimer:
• What presented here is not a recommendation, please consult your licensed broker.
• Our mission is to create lateral thinking skills for every investor and trader, knowing when to take a calculated risk with market uncertainty and a bolder risk when opportunity arises.
CME Real-time Market Data help identify trading set-ups in real-time and express my market views. If you have futures in your trading portfolio, you can check out on CME Group data plans available that suit your trading needs www.tradingview.com
QOT1! trade ideas
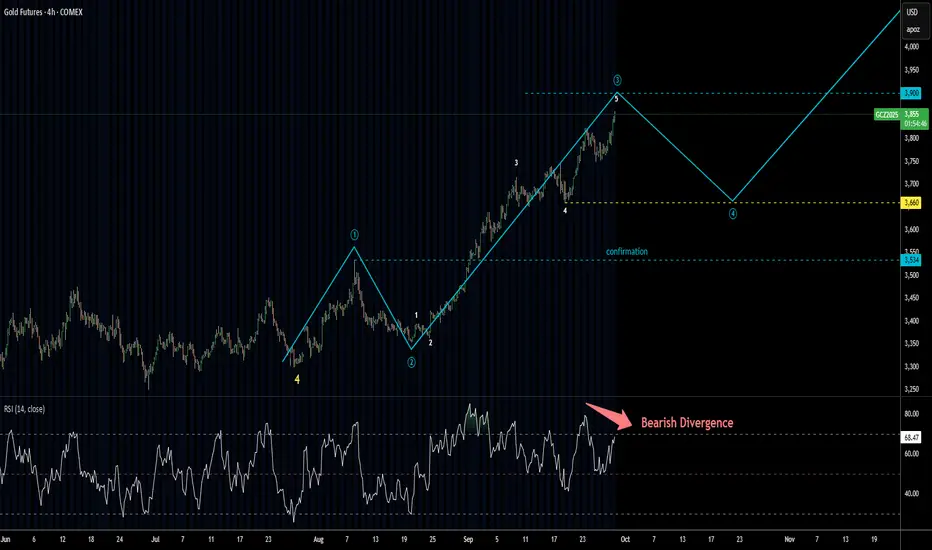
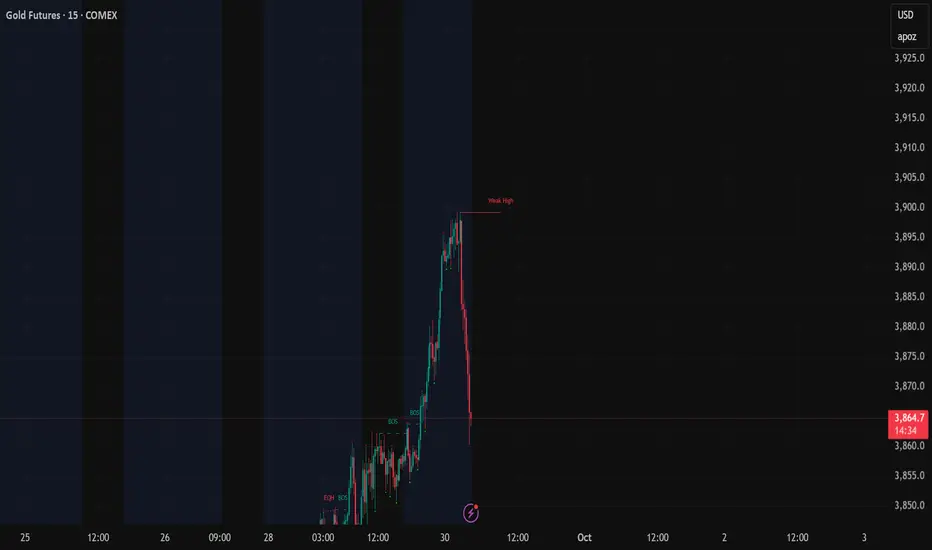
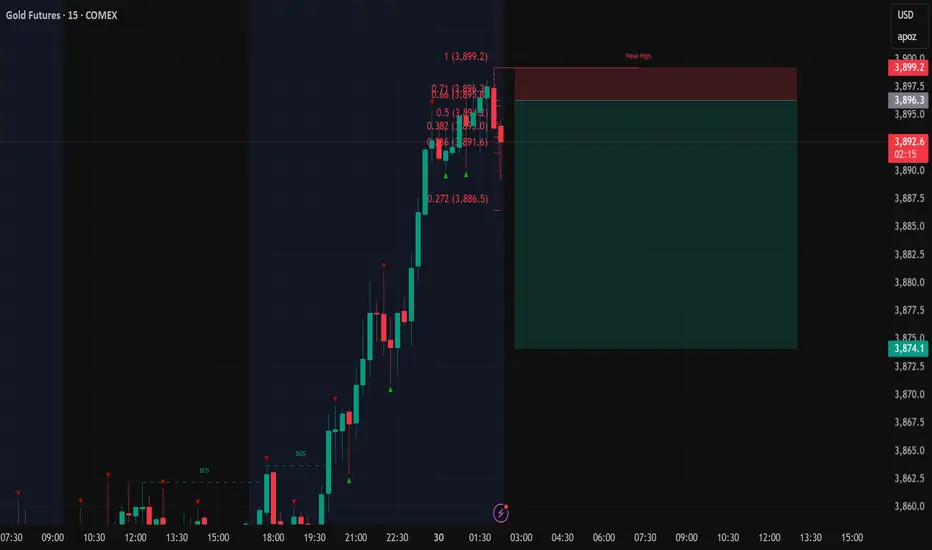
Gold Update 29SEP2025: Top Is Soon, Then PullbackGold Futures are following the projected path closely
The first target at $3,900 is now just "miles" away
This level could mark the top of wave (3) of ((5))
After that, we might see a pullback to around $3,660 in wave (4) of ((5)),
which typically revisits the low of the smaller wave 4
On the 4-hour chart, RSI shows bearish divergence,
as it fails to confirm the new high at $3,859 with a lower peak
Despite this signal, the market could still reach the $3,900 level
Once wave (4) of ((5)) completes,
we can reassess and project wave (5) of ((5)) —
which might form as a triangle or another complex correction.
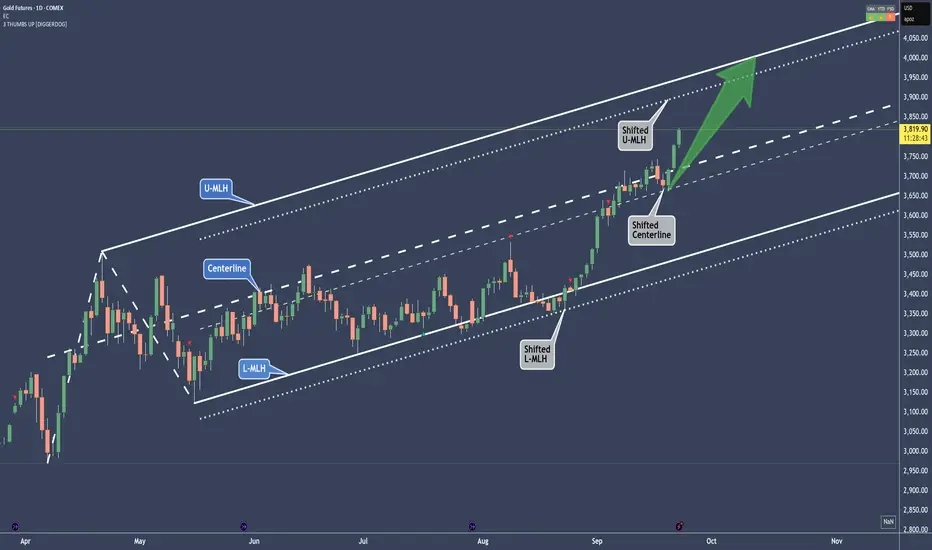
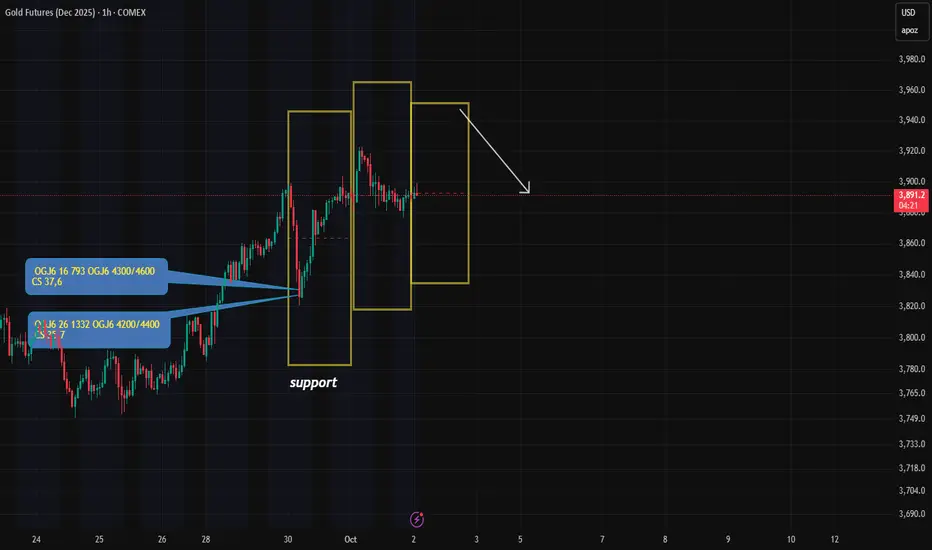
Gold - A shifted move in play and up to 4K🔱 Here’s a shifted move in play 🔱
What exactly is a shifted move?
You see the parallel lines next to the white fork?
Those are the shifted lines.
Now, if you observe how price behaved at the white fork, you’ll notice it was a bit sloppy at the L-MLH, and again at the Centerline after reaching it.
But when we add the dotted parallel lines to the chart and measure the distance from the overshoot at the L-MLH, we find a beautiful support at the Shifted Centerline.
The usual target would be the U-MLH.
So, could the target also be shifted?
And what does that tell us?
Well, if you’re long on Gold, you might want to take some profit at the Shifted U-MLH and let the rest ride up toward 4K—if there’s enough gas in the goose.
For me, a re-entry long would be a pullback to the Centerline—either the original or the shifted one—with a small stop just below some structure.
Let me know what you think ho far Gold will go in the comments.
😊 Thanks for boosting, thanks for following 🙏

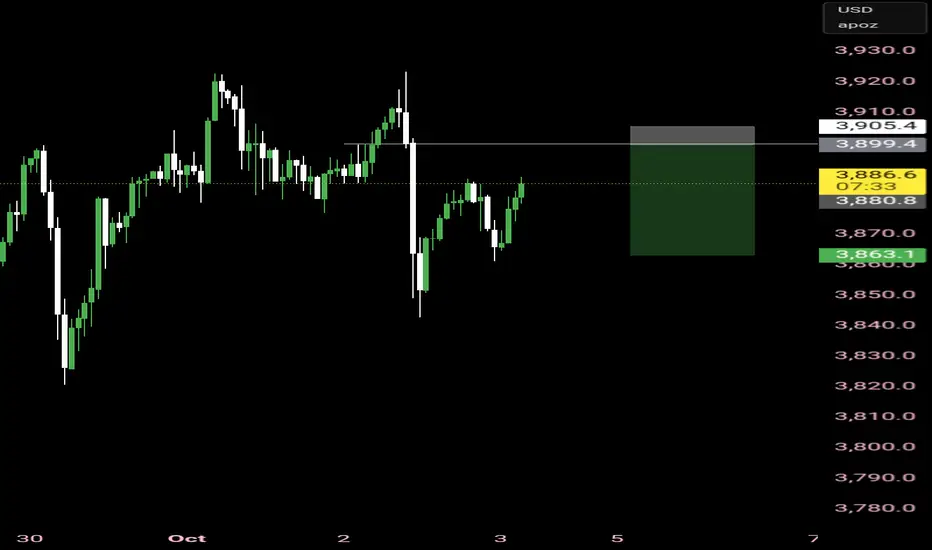
Gold | 9/30Gold is acting golden. 4hr fib levels on chart to guess at price movements but the data on the screen that is relevant is a daily candle from yesterday that is holding price in a daily range so far as of writing this.
15min trends marked to track price through a reversal possibly to lower ranges and yesterday median to gain some supportive structure and levels for later this week.

Gold Options Check-In: Are the Big Players Cashing Out?A quick look at the latest CME options data for Gold shows some interesting signals. It looks like the bulls might be getting tired.
The Big Signal: We're seeing big trading volume, but the number of actual open positions (Open Interest) has barely changed.
Calls: 27,274 contracts traded, but only +2,933 new positions were opened.
What this means: This isn't new money flooding in. It's big players shuffling their decks and taking chips off the table.
What's happening with Calls? 🔼
Traders are closing out their winning bets on strikes like $3850, $3800, and
4000
The Takeaway 🎯
The market sentiment is shifting from bullish to neutral & defensive. Big players are:
Cashing out their profits on call options.
This kind of activity is a sign that an uptrend could be running out of steam.
However, another leg up for gold is still possible. The argument for this scenario is the presence of a futures hedge within many of PUT spread portfolios. The logic works like this: if the asset's price continues to rise, profits are taken on the futures leg, and the position is closed. This profit can then make the put spread a breakeven trade, essentially providing downside protection for free, even if the price keeps rallying.
As for me, main bias: short at upper ER (if you're unfamiliar with the ER concept, check out my profile for a detailed post on Expected Range).)
Entry on touch. Risk kept small.
GC TRADE IDEAGold has been uptrend, but gold today run into daily FVG and on 4hr rejection with 1hr breakout, I am looking to buy if we trace back to that zone I marked belowGold has been uptrend, but gold today run into daily FVG and on 4hr rejection with 1hr breakout, I am looking to buy if we trace back to that zone I marked below
Gold Futures Bullish Setup – Entry at Demand Zone1. Channel Formation
The price is moving inside a rising parallel channel (blue lines).
Recently, the price broke below the midline (dashed blue) of the channel, indicating short-term weakness.
2. Trade Setup: Long (Buy) Position
The chart indicates a bullish outlook, expecting a price reversal from the demand zone.
🔹 Entry Zone
Entry Price: ₹116,251 – ₹116,277
This is marked with a grey zone, which aligns with a support area and previous consolidation.
🔻 Stop Loss (SL)
Stop Loss Price: ₹115,705 – ₹115,729
Placed just below the lower boundary of the support zone to protect against a false breakout.
🎯 Target (TP)
Target Price: ₹119,331 – ₹119,338 (LABA target point)
This lies above recent highs and near the upper boundary of the channel, suggesting continuation of the bullish trend.
3. Risk-Reward Ratio
The blue shaded box indicates a reward zone.
The trade has a favorable Risk-Reward Ratio (RRR) > 2:1, which is considered a strong setup.
🧠 Interpretation & Strategy
The red curved arrow indicates expected price action: a short-term pullback into the demand zone, followed by a bullish bounce toward the target.
The structure suggests a buy-the-dip opportunity within an ongoing uptrend.
⚠️ Key Takeaways
Component Value (INR)
Entry Zone 116,251 – 116,277
Stop Loss 115,705 – 115,729
Target 119,331 – 119,338
Trend Bullish inside channel
Risk/Reward Favorable (>2:1)
✅ Conclusion
This setup represents a bullish continuation pattern. If price revisits the highlighted demand/support zone, and forms bullish reversal candles (e.g., hammer, bullish engulfing), it could offer a high-probability long entry toward the upper end of the channel near ₹119,338.

Gold Futures (MGCZ5) – H4 Gap in PlayPrice pushed aggressively bullish all day yesterday with little to no pullbacks. That momentum left behind a fresh H4 Fair Value Gap (FVG) sitting just above the Weekly High (WH) level.
If we see a pullback into this area, it could offer a solid setup for continuation higher.
⚠️ Key considerations:
If buyers stay strong, price may run liquidity above 3863.7 (D-H) before any meaningful retracement.
If sentiment shifts, a deeper draw into the Daily FVG below 3764 remains on the table.
With global uncertainty (military meetings, de-dollarization, possible U.S. shutdown), volatility risk is elevated.
🎯 Game Plan:
Watch the H4 FVG near WH for rejection / entry signals.
Bias remains bullish while above 3785 (D-L).
Break below D-L opens the door toward the Daily FVG.

Long trade Trade Journal Entry
Pair: MGC1! (Micro Gold Futures)
Trade Type: Buy-side trade
Date: Sun 29th June 2025
Session: 6.00 PM
TF: 1H
Trade Details:
Entry: 3,904.5
Profit Level: 4,134.5 (+18.47%)
Stop Level: 3,793.0 (–1.18%)
RR: 127.17
Wyckoff Narrative & Structure:
Phase A (Preliminary Support / Selling Climax): Market sold off into spring lows, where high volume absorption signalled potential accumulation.
Phase B (Building the Cause): An extended consolidation range is formed, marked by tests of support and resistance. Smart money accumulated positions while shaking out weak hands.
Phase C (Spring & Test): Price wicked below support to collect liquidity (spring event) before reclaiming the range. The test confirmed demand returning.
Phase D (Markup Initiation): Breakout above resistance with strong volume, creating a Sign of Strength (SOS) and retest zones acting as Last Points of Support (LPS).
Phase E (Trend Continuation): The current price action indicates a bullish continuation, in line with the long-term markup phase, which targets higher extensions (Fib 1.618 and above).
Feeling really good about this trade tbh.

GC pullbackMy setup here I will consider shorts
The best trades come to the patient, not the impulsive. Heaven rewards the same!
We Trade for Christ not profits. Profit is temporary, you cant take it with you.
and in doing so, trading becomes very easy.
Gold Futures Weekly Outlook (MGCZ5)📍 Key Levels on Watch
Friday’s High (D-H): 3814.5
Friday’s Low (D-L): 3764.2 → New support
Weekly High (WFH): 3824.6
Weekly Low (W-L): 3717.7
Daily FVG Below: 3746.3–3735.2
🧭 Technical Outlook
Price is currently sitting right at the 50% midpoint of Friday’s move.
Friday’s Low (3764.2) is the key inflection point:
If defended → bullish continuation toward 3814.5 and possibly 3824.6.
If broken → expect a quick flush into the Daily FVG (3746–3735) before buyers step back in.
Volume profile shows a low-volume pocket below 3770, which could accelerate moves down into that Daily FVG if support fails.
🌍 Macro Context
De-Dollarization trends continue to support Gold in the longer term.
Geopolitical tensions (military leadership meetings this Tuesday + ongoing global conflicts) = potential safe haven demand.
US Political Risk: Government shutdown threats and loss of traction for the Trump administration add uncertainty → historically supportive for Gold.
Safe Haven Flows: When global stability is questioned, Gold is a direct beneficiary.
🎯 Scenarios to Watch
Bullish Case:
Friday’s low holds → retest of 3814.5 and possibly new weekly highs above 3824.6.
Bearish Case:
Break of 3764.2 → fast move into Daily FVG (3746–3735).
Watch for liquidity sweep & reversal setup inside that FVG.
📌 My Plan
Bias leans bullish this week given the macro backdrop.
BUT — I’ll wait for price to show its hand around Friday’s low before committing to either continuation or discount entries.
Staying flexible: both scenarios mapped, execution will be clean.

Gold Rallies as Geopolitical Tensions EscalatedCOMEX: 1-Ounce Gold Futures ( COMEX:1OZ1! )
Without warning, the music at the Wall Street merry-go-round suddenly stops.
On Thursday, October 9th, China’s Commerce Ministry issues a directive, requiring foreign suppliers to obtain approval to export products with rare-earth materials originating from China if they account for 0.1% or more of the good’s total value. Goods produced with certain technologies from China are also subject to the export controls. Both restrictions apply to products manufactured outside of China.
The next day, US President Donald Trump immediately retaliates with a 100% additional tariff for goods imported from China, starting Nov. 1st. He indicated in a social-media post that the duties will come on top of 30% imposed this year on China, as well as tariffs in place on many Chinese goods before the year started.
Prior to Trump’s comments, US stocks were rising sizably on Friday, with the Nasdaq Composite hitting a new all-time intraday high. The TruthSocial post, sent an hour before market close, immediately set off a broad market selloff. At the end of the day, the Dow Jones Industrial Average closes down 878.82 points, or 1.9%, at 45,479.60. The S&P 500 lost 2.71% to settle at 6,552.51, while the Nasdaq Composite fell 3.56% to 22,204.43. The broad-based index’s decline was the largest since April 10th.
While the market is under stress, we have witnessed a classic case of flight-to-safety. At the same time when stocks and cryptos slide, gold pops back up above $4,000 again and settles at $4,035.5 an ounce, up $62.9 or +1.58% for the day. Gold futures contracts also rally with large trade volume.
• The lead contract GCZ5 for benchmark COMEX Gold (100 oz) closes at 4,035.5 with a daily volume of 352,500. In notional terms, the transaction value is $142.2 billion, equivalent to 1,096.4 tons of gold.
• The lead contract GOZ5 for E-Mini Gold (50 oz) closes at 4,036 with a volume of 9,555. Notional value is $1.9 billion, equivalent to 14.9 tons of gold.
• The lead contract MGCZ5 for Micro Gold (10 oz) closes at 4,036.2 with a volume of 640,430. Notional value is $25.8 billion, equivalent to 199.2 tons of gold.
• The lead contract 1OZZ5 for 1-ounce Gold closes at 4,036.75 with a volume of 61,886.
Notional value is $250 million, equivalent to 1.9 tons of gold.
Here are the key reasons supporting the record high prices:
• Economic Uncertainty: Widespread concern about a potential U.S. recession and a shifting global economic order fueled demand for gold as a safe-haven asset.
• Lower Interest Rates: Investors expect the Federal Reserve to cut interest rates, making non-yielding assets like gold more attractive compared to bonds and other investments.
• Geopolitical Instability: A combination of global events, including a prolonged U.S. government shutdown and heightened trade tensions, contributed to a general sense of unease, driving investors to gold.
• Central Bank Purchases: Record buying by central banks has also supported the price of gold.
• Weak Dollar: The Dollar Index is at 99.336, down 8.8% year-to-date. Weak dollar is bullish for all commodities. Global investors pay less to buy gold when they convert local currency into dollar.
What is so significant about the current gold rally?
• The 2025 surge in gold prices has outpaced major past rallies, including those during the 2007-09 recession and the pandemic.
• The move above $4,000 an ounce marks a historic moment, signifying a significant rush into alternative assets amid economic fears.
On April 28th, I published “The Gold-Silver Ratio Explained” on TradingView. At the time, the Ratio was 100 with gold at $3,330 and silver at $33.0.
On October 10th, spot gold is quoted at $4,035.5 while silver is quoted at $47.52. This gives the Gold-Silver Ratio at 84.9. Judging from this important benchmark, gold prices are less extreme than six months ago, even though the price is $700 higher.
Trade Setup with 1-Ounce Gold Futures
Futures market shows bullish sentiment on gold. CFTC’s Commitments of Traders report shows that, as of September 23rd, COMEX gold futures ( CSE:GC ) have total open interest (OI) of 528,789 contracts.
• “Managed Money” holds 198,826 Long contracts, 38,277 Short contracts, and 32,516 contracts at spread positions.
• The long/short ratio of 5.2-to-1 shows that “Smart Money” is very bullish on gold.
Traders who share the bullish view could explore the new 1-ounce gold futures ($1OZ). This pocket-size product is a new way to trade in the gold market, representing just 1/10 the size of a Micro Gold (MGC) futures contract and 1/100 of a Gold (GC) futures contract, making it accessible to all gold traders.
With an initial margin of just $180, traders could gain full exposure to 1 ounce of gold. As of October 11th, the February 2026 contract (1OZG6) is quoted at 4066.75.
Hypothetically, if gold prices move up by 5%, a long futures position would more than double in value (= (4066.75*0.05) / 180 = 113%). This futures contract has a built-in leverage of 22.6:1.
For comparison, owning physical gold has a return of just 5% if gold prices go up by 5%.
The risk of buying gold futures is falling gold prices. Traders could set up a stoploss on their buy order. For illustration, a stoploss at 3,900 would set the maximum loss at $166.75 (= 4066.75–3900). This is below the $180 initial margin.
Happy Trading.
Disclaimers
*Trade ideas cited above are for illustration only, as an integral part of a case study to demonstrate the fundamental concepts in risk management under the market scenarios being discussed. They shall not be construed as investment recommendations or advice. Nor are they used to promote any specific products, or services.
CME Real-time Market Data help identify trading set-ups and express my market views. If you have futures in your trading portfolio, you can check out on CME Group data plans available that suit your trading needs www.tradingview.com

Gold Investors May Be in It for the Long Haul If one wishes to be the ultimate bull on gold and identify a path higher for it, then one bullish outcome could be a rise to a range of $4,400 to $4,680. Since October 2023, gold has advanced in a stair-step-like manner, with periods of strong gains followed by phases of consolidation. On each of those occasions, gold has reached the 1.272% or 1.618% Fibonacci extension of the previous trend before consolidating.
It may not turn out to be the case this time, but we should soon find out as gold approaches the 100% extension at $4,160. If gold were to surpass that Fibonacci extension level, it could then rise towards those higher prices previously mentioned.
Gold, however, is overbought and has been since reaching $3,800, which means it is long overdue for a period of consolidation. While there may still be a path higher for gold, it does not come without significant risk. The metal is currently trading above its upper Bollinger Band and has a relative strength index (RSI) of 86.7.
The last time gold’s RSI was this high on the daily chart was in July 2020, which was followed by a long and drawn-out consolidation phase lasting until March 2024, during which the price fell from around $2,000 to $1,600 at its lowest point.
For gold investors, the message at this stage may be that while gold still has the potential to move higher, one may need to be prepared to hold on to the precious metal for some time to come, as the risk now appears to be greater than the potential reward.
Written by Michael J. Kramer, founder of Mott Capital Management.
Disclaimer: CMC Markets is an execution-only service provider. The material (whether or not it states any opinions) is for general information purposes only and does not take into account your personal circumstances or objectives. Nothing in this material is (or should be considered to be) financial, investment or other advice on which reliance should be placed.
No opinion given in the material constitutes a recommendation by CMC Markets or the author that any particular investment, security, transaction, or investment strategy is suitable for any specific person. The material has not been prepared in accordance with legal requirements designed to promote the independence of investment research. Although we are not specifically prevented from dealing before providing this material, we do not seek to take advantage of the material prior to its dissemination.

GC 10/10The T.A paints the picture.
INV. levels. are resistance unless solid lines.
FS / BS levels are support unless solid lines
1x dotted are tested
2x dotted. are Origin levels where Trends originate from; a vertices in the fractals of time.
Each level is color coded to the timeframe the candle was found on.
Strength favors the higher timeframes
Pink = month
grey = week
red = day
orange - 4hr
yellow - 1 hr
15min - blue
5min - green

Book profit in Gold 4000 point, Tgt done 85000My Gold 2nd Tgt is 85000, and gold made 84894 high yesterday, if any one create position in gold please book profit, and wait for next update or breakout, chartpattern etc,
follow me for more update, share my idea to your friends and family.

Gold Over $4K: Blow-Off Top or Launchpad Higher?Gold (GC1!) has been one of the most beautifully trending markets over the past two years — a textbook example of structure, momentum, and clean technical behaviour. We’ve been following it closely since February 2024, and every markup and re-accumulation phase has respected the 5 / 10 / 20 / 50 MA stack perfectly.
Now, price has reached the key $4 000 zone after yet another powerful rally leg. The big question: are we seeing a blow-off top forming, or is this simply another launch pad before the next expansion higher?
Personally, I think we might need a flush toward the 50 MA (orange) to reset momentum and shake out late buyers before any real continuation. That said, I won’t even think about shorts unless the Daily closes below the 20 MA — the trend is still firmly bullish until proven otherwise.
Let’s be honest though… this is where everyone suddenly becomes a top-caller, trying to outsmart a two-year uptrend 🤦♂️. We just keep it simple — follow the chart, trust the EMAs, and stay bullish until the structure actually breaks down.
Key points:
• Daily trend remains bullish with EMAs cleanly stacked.
• A healthy pullback toward the 50 MA could reset momentum.
• Short bias only valid after a Daily close below the 20 MA.
• Holding above 20 ma keeps continuation structure intact.
• Bias remains bullish until proven otherwise.
Questions for you:
1. Do you think this is the final blow-off or just another launch pad before 5K?
2. How far do you see this pullback going — 20 EMA bounce or full flush to the 50 EMA?
3. Are you still riding the trend, or are you one of the many trying to call the top too early?

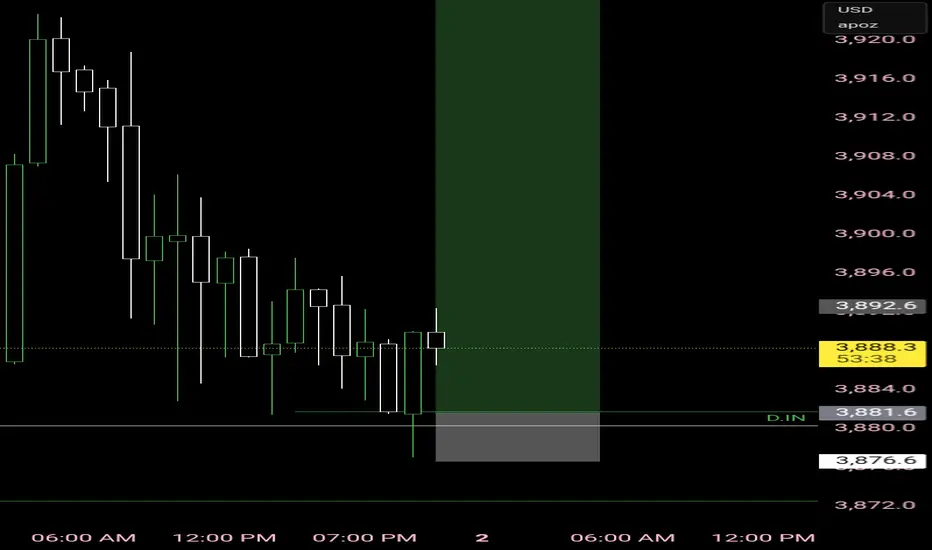
Gold long at 1hr Wick CE lvlBased on the 1hr 9pm wick CE lvl, entering at 50% consequent encroachment

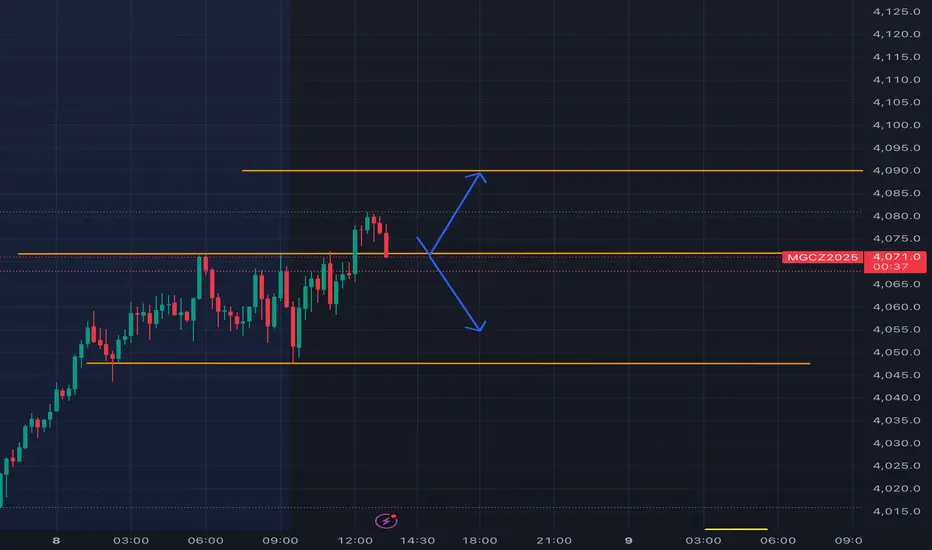
Friendly analysis Can Gold reach 4090 level or more if it bounces off the 4070 level a good chance and the Government lockout continues or will it go on a selling frenzy??? Be careful 😎😎😎 keep your stop loss tight…… for entertainment purposes only not financial advice.
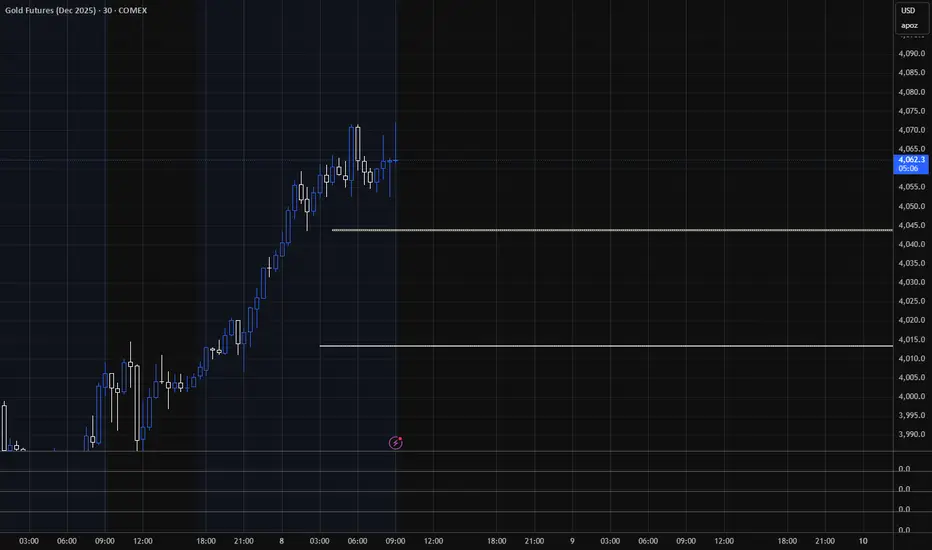
Target areas - GC price for Market open.10/8/25 - These are the target areas - GC price for Market open depending if price moves up or down. Will look for trades into these areas.
Gold!! Support and ResiistanceGold breaks above $4k an oz. It’s just simple support and resistance now
