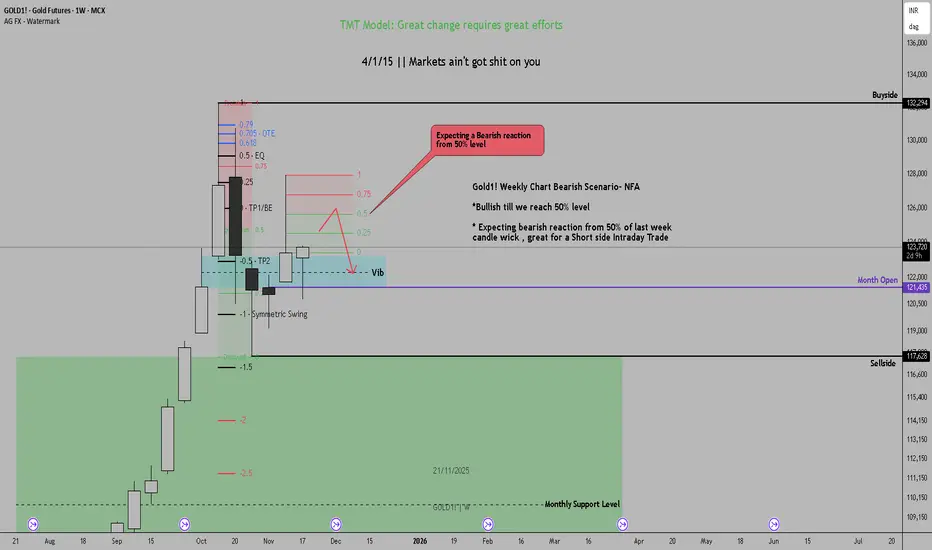
Gold1! Weekly Chart Bearish Scenario- NFAGold1! Weekly Chart Bearish Scenario- NFA
*Bullish till we reach 50% level
* Expecting bearish reaction from 50% of last week candle wick , great for a Short side Intraday Trade
Trade ideas
Gold Holds $4000Gold has retraced lower from last week’s high, though it is holding above 4000 for now. Two bullish pinbars have also formed on the daily chart, hinting at a potential swing low. A break above yesterday’s high could see bulls target the 4200 handle, with a move through the 4250 high bringing the 4300 handle and monthly S1 into view.
However, keep in mind the weekly chart may be forming a Wave B within a broader ABC correction. I’ll also be watching for signs of a swing high on the daily chart and a potential resumption of the move lower from the record high. A 100% projection of Wave A from B implies a downside target near 3800.
Matt Simpson, Market Analyst at City Index.

The Calm Before the Expansion — Gold Pre-Setup MapGold rejecting the Asian Range low and showing early signs of reversal. Missed the London setup after oversleeping, but tonight I’m watching for a retrace back into the H1 FVG + lower HVN. That pocket sits just under 50% of yesterday’s Asian range and lines up with weekly volume sitting just outside of value. If price pulls back into that zone and shows displacement, I’m looking for continuation to the upside and potential expansion toward the H4 FVG above. Premature breakouts tonight may be traps.


Looking for the Sweep leading into a bigger Play! Price bled lower through the entire Asian session after yesterday’s late breakdown, continuing the move away from the prior value area. We’re now trading inside a cluster of intraday inefficiencies with clean liquidity sitting below at 4013 and the psychological 4000 level.
My focus going into London and NY is patience.
Asia’s slow descent is typically a continuation phase, not the actual entry. I want to see:
A sweep of 4013 or 4000
A clear displacement reaction
A retrace back into a fresh M5–M15 FVG
Then structure confirming continuation or reversal
Until that happens, this remains a bearish environment with untested Weekly imbalance still below. If buyers don’t defend 4013 with force, the algo will likely reach for the 4000 liquidity pocket next.
Staying reactive, not predictive.
London will reveal whether this breakdown continues or sets the trap for a reversal.

GOLD is retracing only to drop againTarget is 4000. We need to wait for confirmation when it gets to the marked zone.
Gold hold this trendline and we see a move upwards.If gold can hold this trendline at $4000 we could see a move up, wait for the daily open.

Gold BullishWe are definitely bullish, with the market after hours slowly building back profit. I believe that gold will follow, it slowly building back momentum will be a green light for the Asia session today 11/17 as well as future days.
The reason that I am very adamant about this is because the market has been very low lately but with NVDA earnings coming out I believe that the market will go up this week including Gold, Nasdaq and S&P 500.

Where To Next?I am currently focused on the consolidation zone (see the green rectangle) that formed a few days ago. Following a breakout to the upside, price promptly retested and closed yesterday just above the top boundary of that consolidation. However, today’s action saw a failure to sustain outside the zone and a return back into the prior consolidation range. While I hope this view proves incorrect, my expectation is for further weakness in gold over the coming days.
Technical considerations driving this outlook:
• The breakout lacked follow-through and the retest did not hold beyond the breakout level.
• Re-entry into the consolidation zone signals a potential loss of upward momentum and increased risk of a reversal or deeper pull-back.
• As traders, given the current structure we should err on the side of caution—if the market cannot sustain above the breakout level, then the likelihood of downside increases.
Let’s keep the risk-reward clearly defined—if gold (XAU/USD) fails to reclaim the breakout zone convincingly, I will lean toward short or neutral positioning rather than placing bullish bets under current structure.
⸻
Supporting quote from the latest news:
“MCX Gold futures are currently navigating a critical juncture… marked by a retreat from significant trendline resistance and the establishment of a sideways market structure. … The immediate outlook suggests short-term bearish pressure.”
I’m sitting out until I can see clear structure and direction.

Gold "World"
(this is my plan): If end-of-year 2025 gold around 3800-4000, it might be low 3500 in first quarter of 2026.. then i buy asap physical gold and trade online. You know why ?? here is my buy physical gold/trade online journey (short long my story):
- year 2006: first time gold reached $600, i bought asap.. and i know gold never come back.
- year 2015: beginning of year gold went down from ~$1900, it was ~$1000, i bought physical gold asap until gold reached almost $4000 for now.
- present: waiting for going down $3500-$3000 in future, will buy 3rd time in my life.
Life is a game.. i just wanna secure my life in next 10 yrs :))
Disclaimer: Whatever i said is my planned.. might not your plans.

Elliott Wave - Final leg down.Not completely certain that W4 is complete. Could be given how the last high is formed.
Not exactly where W5 will end, anywhere from 0.5 - 1.272 ext. is my guess if W4 is complete.

GC! Level watchGold's resistance remains above current levels $4,150+ with a slightly bearish short‐term tone, so given the slightly weakened momentum and the presence of headwinds (stronger USD, hawkish Fed commentary), the most likely scenario for today is range-bound to mildly downward action, unless a strong catalyst emerges. So, if price holds above the ~$4,000–$4,050 support band, a rebound attempt toward ~$4,120–$4,150 is plausible. Conversely, if support breaks, we could see a move toward ~$3,900 or even ~$3,800 in an aggressive sell-off.
The Leap Update - November CompetitionHere is some analysis on the pairs I am in in this Leap round. Quite a bit away from the top 10 place, but anything is possible. Remember, luck plays a part, but it flattens itself out more over a period of time. There is a month to trade, so just stay in your own lane and you will do better than worrying too much about how someone else is doing. Nobody has consistently even made it in the top 10 consecutively.
Hope you enjoyed the analysis.
R2F Trading

Gold Week Opens Inside Daily FVG — Will We Drop Into the Weekly New week, and Gold opened inside last week’s Daily FVG, which was fully rebalanced.
No confirmation yet that this zone will act as support. The larger unmitigated Weekly FVG below may still be the draw on liquidity before any bullish move develops.
Plan for tonight:
Let Asia define the range
Watch for a sweep during London
Bearish continuation is favored if we break today’s open level (4174.9)
Bullish only if Asia low → sweep → displacement → retrace
Levels marked.
Patience. Let the algo show its hand.
#Futures #GC #Gold #FVG #ICT #SmartMoney #DayTrading #NOFOMO

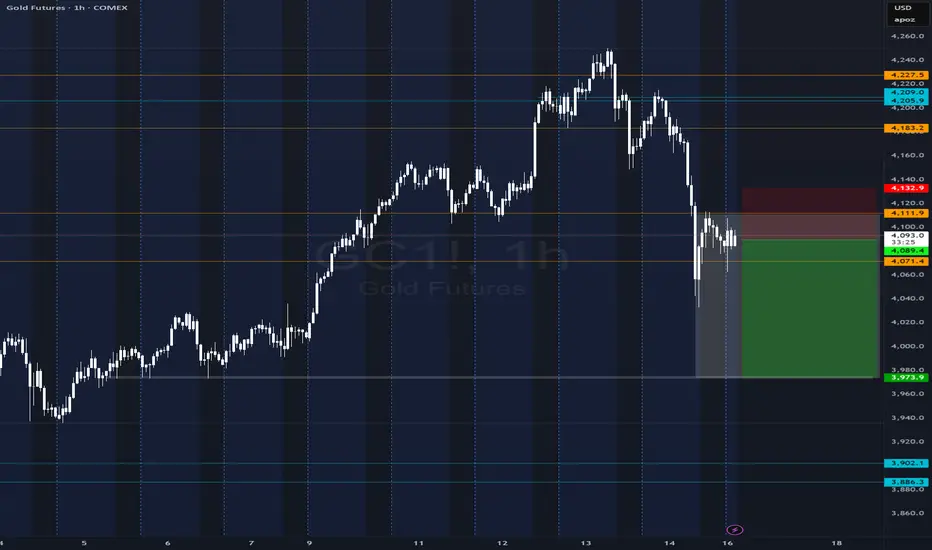
Gold Futures (GC1!) – Key Breakdown Holding, Equal Lows in Sight
Gold is currently trading below a major intraday level (4,110–4,115) after a clean breakdown and rejection on the retest. That failed reclaim confirms this zone as new resistance, shifting the near-term structure bearish.
Price is now sitting underneath a multi-touch level, and the market has a very obvious draw:
the equal lows resting just below the 4,020 → 4,000 range.
Market Structure
Lower high formed after the sharp selloff
Clear break in structure
Retest of resistance was rejected
Momentum continues to favor downside
Liquidity Outlook
There’s a cluster of untapped liquidity sitting beneath recent lows. Gold often sweeps these “equal lows” before making a meaningful move.
Targets below include:
4,020 → 4,000 liquidity sweep
3,975 intermediate reaction zone
3,902 (higher-timeframe demand + major resting liquidity)
As long as price remains below 4,110–4,115, the downside continuation remains the higher-probability scenario.
Invalidation
The bearish idea is invalidated only if gold reclaims 4,115 with strength.
A clean break and hold above that level opens the door back into:
4,183
4,209
4,225
…where unfilled imbalance sits overhead.
Bias
Short-term bearish until equal lows are taken.
Looking for continuation into the liquidity pool below before any meaningful bounce.
Long Gold, Read description is a must Yeah, I’ll be honest , this one’s a bit of a forced setup. It’s not really my usual day trading style, and it doesn’t fully align with my playbook, but I still see potential in Gold here. I’ve been tracking the consolidation after that last leg down, and we finally got a breakout to the upside.
My broader view hasn’t changed though , I’m expecting a deeper correction once price taps that black line. If we get a retrace into the yellow box, that’s where I’d start looking for a long setup. But if price skips the retrace and tags the black line straight away, I’m sitting on my hands , that zone is a key decision point, and patience will pay off there. Once we confirm that the price is heading down, then we ride that wave down, if it happens.

GOLD: The Daily and Weekly +FVGs Hold The Key! In this Weekly Market Forecast, we will analyze the Gold (XAUUSD) for the week of Nov. 17-21st.
Gold is still strong, but struggled to move higher last week. It is currently inside a bullish FVG, and this would be the key PD Array to watch. If the market shows respect to the +FVG, then expect higher prices. If it fails, and we see the market close below it on a daily close basis, buys should be avoided until the Weekly +FVG is reached.
Enjoy!
May profits be upon you.
Leave any questions or comments in the comment section.
I appreciate any feedback from my viewers!
Like and/or subscribe if you want more accurate analysis.
Thank you so much!
Disclaimer:
I do not provide personal investment advice and I am not a qualified licensed investment advisor.
All information found here, including any ideas, opinions, views, predictions, forecasts, commentaries, suggestions, expressed or implied herein, are for informational, entertainment or educational purposes only and should not be construed as personal investment advice. While the information provided is believed to be accurate, it may include errors or inaccuracies.
I will not and cannot be held liable for any actions you take as a result of anything you read here.
Conduct your own due diligence, or consult a licensed financial advisor or broker before making any and all investment decisions. Any investments, trades, speculations, or decisions made on the basis of any information found on this channel, expressed or implied herein, are committed at your own risk, financial or otherwise.

SELL OPPORTUNITY1. On Green level take Entry1 for sell on selling engulf candle.
2. or entry 2 on 2nd green level on selling engulfing.
3. Tp 1000 pips till lower green level.

How a Single Put Spread Predicted Gold’s BreakdownSo, gold has broken below the previous bearish zone — meaning we now have a bearish sentiment in play (at least according to my classification).
Now, regarding options flow:
On the chart, I’ve highlighted those lucky (or rather, well-informed) players who entered with a Put Spread — just before the correction started.
Perfect timing.
Their ideal target?
$3,950 — to be reached within 8 days, right around expiry.
Or at least close enough for maximum profit.
p.s. Just to be clear:
We are not teaching options trading as such — even though much of my methodology is built on options market data.
What we are doing is showing you how to read the option sentiment and use that insight to trade more effectively on the markets you already know — like spot Forex.
It’s about understanding why price moves — before it does.
We believe that trading without using options sentiment analysis is similar to fishing with a fishing rod🤦🏻♂️ on the shore while your neighbor has arrived at the river with a sonar on a boat.
We are on that boat, and we want to help you make better trading decision.💰

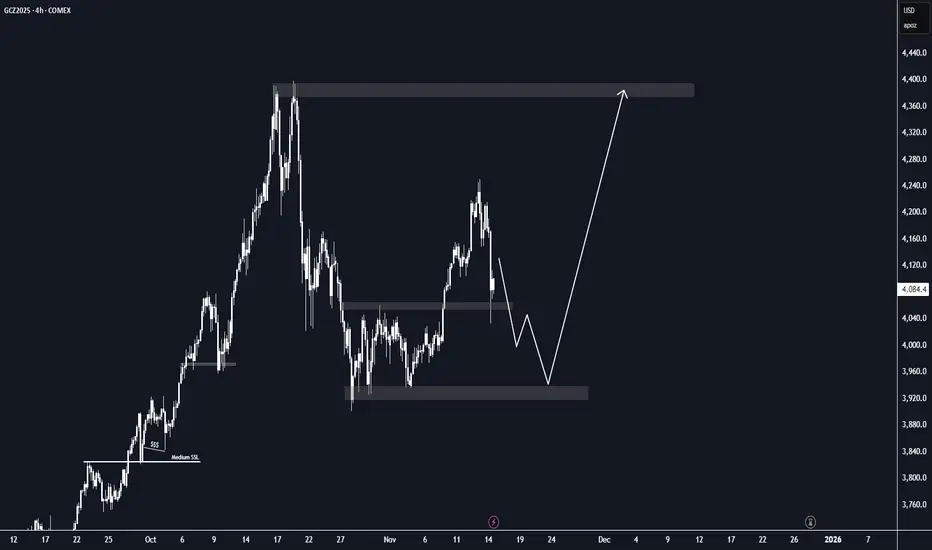
Gold Buys for Next WeekAfter the mid-October sell-off, Gold entered a period of consolidation lasting more than a week. Price showed clear indecision during this phase. Buyers were convinced the correction had run its course, while sellers continued to push for a deeper move down.
Once the U.S. government reopened, the bullish continuation many traders anticipated finally came through.
Following this minor pullback, I want to see buyers step back in and drive price higher, ideally making a move to retest the previous all-time highs.
GC UpdateWeird rally last week, looks like it's headed right back to 4k though.
Silver did a double top, so I think that's done.... which may put downward pressure on gold for the next month or so. There will probably be a rate cut in January though.

Long trade
📘 Trade Journal Entry — Micro Gold Futures (MGC1!)
Date: 12th Oct 25
Time: 12:00 PM
Session: LDN → NY AM
Direction: Buyside Trade
Timeframe: 1H
🔹 Trade Details
Entry: 3978.8
TP: 4290 (+8.06%)
SL: 3924.9 (–1.31%)
RR: 6.15
📌 Technical Narrative
Price formed a macro liquidity sweep, followed by CHOCH and BOS confirming a bullish reversal. A clean inducement below the 4050 zone fueled displacement upward through multiple FVGs, each of which held as re-entry zones. The trade was taken from a discount retracement aligned with the 0.382 and 0.61 fib levels, supported by stacked FVGs and KAMA MA trend alignment.
🔹Model: FVG → Inducement → BOS → Re-entry
Liquidity swept - Price immediately shifted into displacement
Accumulation & Inducement Zone - Between Oct 28 → Nov 5, price carved:
Slow accumulation structure
Multiple small FVGs (stacked)
A clean inducement low at 4050-zone
Equal lows resting near 4084 PD-array
Displacement Leg (Current Move Up) Price breaks:
BOS @ 4148.7 and holds above: 0.382 retracement @ 4140
0.618 retracement @ 4229.
Multiple micro FVGs (confirmed by fills)
📌Market Sentiment Narrative
Gold currently trades in an environment of: Fed dovish shift, Geopolitical uncertainty
Commodity demand rotational flows, Liquidity flight from risk-on assets. This supports a buyside continuation toward HTF premium zones.
