Serve yourself a coffee and have a look at Dr. Copper!Serve yourself a coffee and have a look at Dr. Copper’s chart this morning.
It’s hinting at something bigger…
MHGX2026 trade ideas

super volitile selloff brings us back to major =BUYers1->5 : solid uptrend ,
number 3 surpasses number 1 making number 2
a solid major low ,
number 5 surpasses number 3 , making number 4
a solid major low
5->6: a reutrn to the highly volitile solid major low
number 4
what do I think will happen ?
* this is just a theory, my opinion on what could
occur in a similar case.
* as number 5 sellers contend with buyers from number
4, we can see that we have a bullish divergence on 3 indicators, the RSI , MFI and accumumation/distribution. we also have oversold indications on the rsi and mfi which is helpful
* looking at dow theory, we are in an uptrend, and in fact have returned to major buyers, though the way we returned was 8 months of buying soldoff in a single day... regardless, we returned to major buyers, and are seeing micro bullish sort of uptrend forming even on the day, if we talk about cheap, it does not get much better than this.

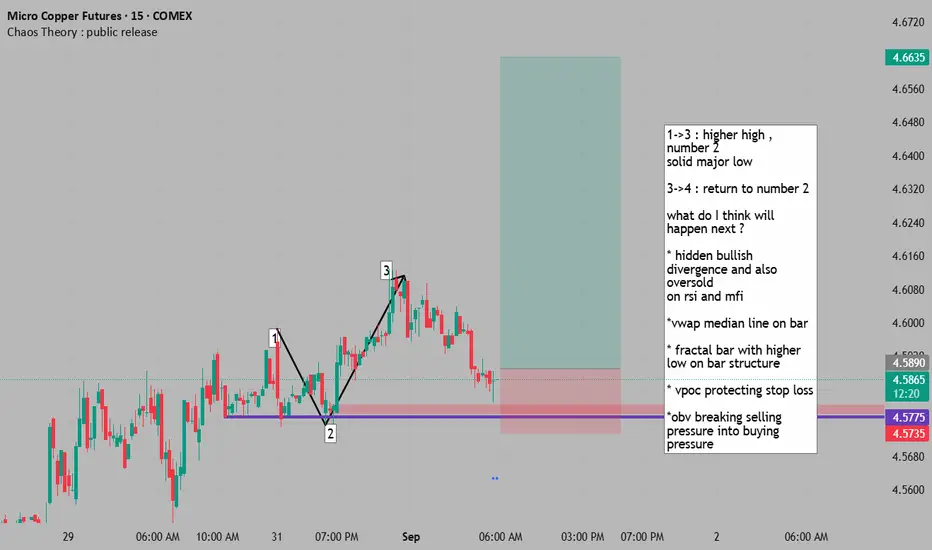
return to solid buyers presents =BUY +mfi+rsi+obv+vwap+volume1->3 : higher high , number 2
solid major low
3->4 : return to number 2
what do I think will happen next ?
* hidden bullish divergence and also oversold
on rsi and mfi
*vwap median line on bar
* fractal bar with higher low on bar structure
* vpoc protecting stop loss
*obv breaking selling pressure into buying pressure
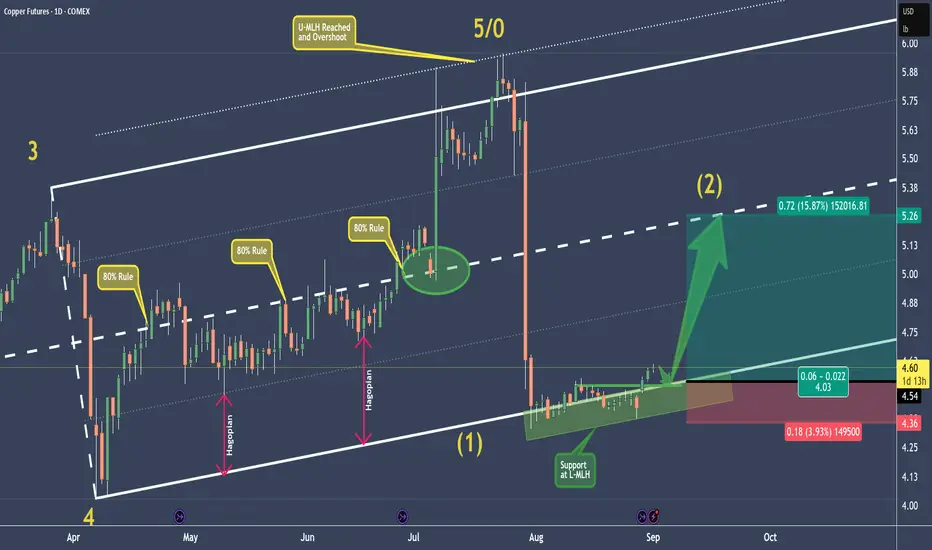
HG - Copper Setting Up For A Long Opprtunity At Extreme📊 Fundamentals first:
- Short-term: The copper market is turbulent—marked by sharp price spikes, crashes, and global shifts in stock levels.
- Medium-term: Despite forecasted surpluses from ICSG, technology innovations and steady demand (especially from China and green sectors) may underpin prices.
- U.S. risk factor: The tariffs remain a major wildcard, likely restructuring trade flows, increasing domestic input costs, and distorting global price differentials.
📈 Now the Chart:
P5/0 at the U-MLH marked the end, and price dropped into the void.
Now, at the L-MLH we see support has built up.
The momentum we see now will probably lead in a pullback before the potential massive run-up to the Centerline.
💡 If the trading God gives me a pullback, I am willingly risk my 0.5% in this trade to make at least 4x more. 🦊
Happy new week to all §8-)
Is the price of copper cheap or is something else occuring?Is the price of copper cheap or is the price of copper indicating coming weakness in the economic cycle?

a return to proven sellers presents a =SELL opportunity1->4 : represents a buildup of orders, a consolidation and determination
of where market players think the value of this asset belongs.
4->5: sellers decide the market is overpriced and begin to sell off
the copper futures, this flux of orders fills the market and due to supply
and demand the price drops
* this could have been forseeable as number 3 was a bit below number 1,
showing the sellers from 2 were stronger than the buyers from 1 , but
it was not super obvious
what do I think will happen ?
* a return to the proven sellers presents an opporuntity to join on trend
with a tight stop at a logical location, the genesis the the most recent leg down
which took out an entire set of buyers and re-established the trend to be
solid
* we have hidden divergence on RSI , MFI and accumulation/distribution indicators, which is a good sign, an ontrend divergence is always preferred.

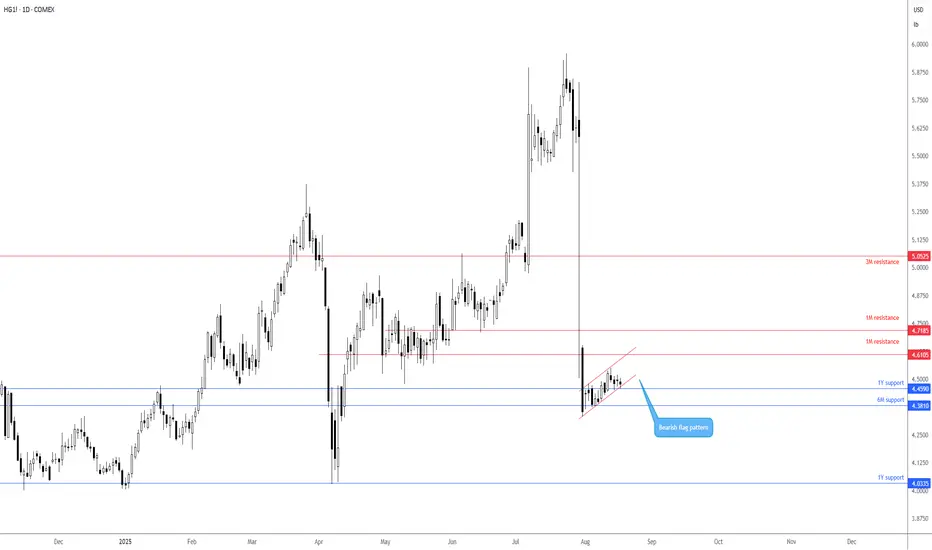
Potential bearish flag pattern on Copper futuresPrice action on Copper Futures shows that buyers and sellers have been confined between two ascending lines since the beginning of August, taken from the low of US$4.3325 and a high of US$4.4800. While this offers a potential bearish flag pattern to work with, the base metal is seen rebounding from support between US$4.3810 (6M) and US$4.4590 (1Y), with room for price to continue pushing higher until reaching resistance between US$4.7185 and US$4.6105 (1M levels).
As a result, price could continue to grind higher within the confines of the bearish flag until reaching resistance at US$4.7185-US$4.6105 before sellers attempt to push things lower.
Written by the FP Markets Research Team
AI, Copper, and the Energy SupercycleThe rise of Artificial Intelligence is more than just a tech story, it’s also a massive commodities story.
AI adoption requires massive infrastructure buildouts... high-performance data centers, advanced semiconductors, and power-intensive cloud networks. Each of these components relies heavily on copper for wiring, cooling systems, and energy transmission.
At the same time, AI-driven demand accelerates the broader electrification trend... more servers, more grid upgrades, more renewable energy projects, all of which are copper-intensive.
Historically, copper has been a reliable barometer for economic expansion, often called “Dr. Copper” for its ability to forecast global growth. But in this cycle, demand is not just cyclical it’s structural.
With supply growth constrained by limited new mining projects and rising costs of extraction, the long-term balance is setting up for potential substantial price appreciation.
The same story applies to energy :
AI and cloud computing are electricity-hungry, and global utilities are already projecting significant demand spikes. This suggests that both copper and energy markets could be among the biggest beneficiaries of the AI-driven decade ahead.
For traders and investors, the takeaway is pretty clear...while the headlines are dominated by AI’s impact on technology stocks, the real long-term winners may lie in copper and energy markets which are the raw inputs powering the digital revolution.
COMEX:HG1!

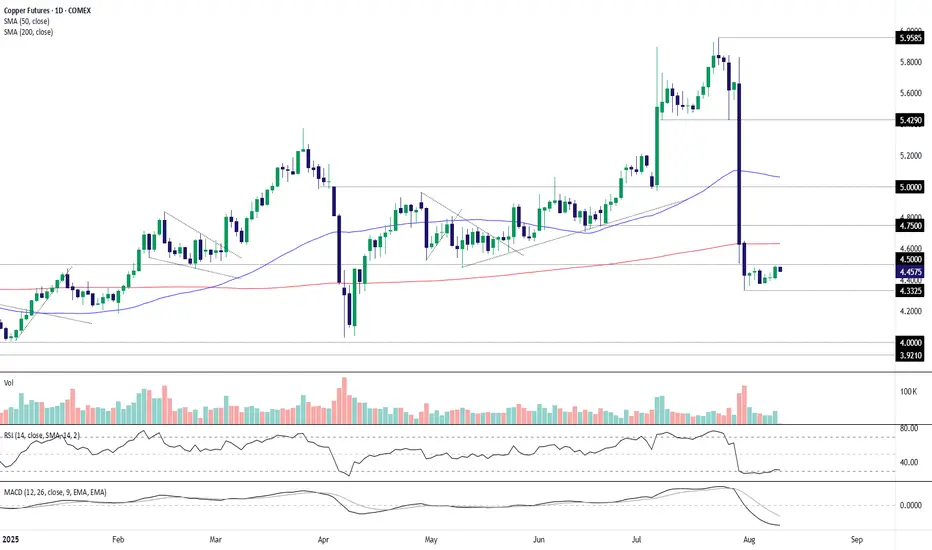
Copper Futures: Bearish bias intact below $4.50COMEX copper may have found a base, but whether the nascent recovery of recent weeks can continue faces a major hurdle at $4.50 resistance. With momentum indicators like RSI (14) and MACD still deeply negative, favouring a bearish bias, the contract remains a sell-on-rallies prospect until the price action suggests otherwise.
If the contract stays capped beneath $4.50 per pound, the July 31 low of $4.3325 is the first downside level to note, followed by $4.25 and $4.00. Those considering bearish setups could place stops above $4.50 for protection.
If the rebound were to extend above $4.50, the setup could flip, allowing for longs to be established above the level with a stop beneath for protection. The 200-day moving average, $4.75 and $5 per pound stand out as potential targets, depending on desired risk-reward.
Good luck!
DS
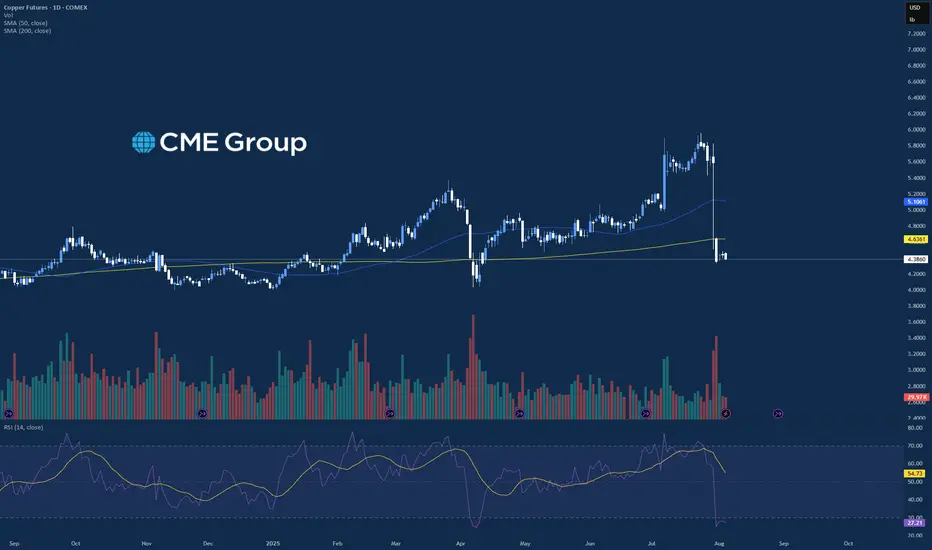
Strength in Precious Metals ContinuesThere was a good mix in price action across many asset classes on the day today where the precious metals traded higher led by the Silver market, which traded up near 1.3% on the day. There was a mixed set of data being released today with manufacturing data and PMI, and the S&P and Nasdaq finished the day lower. Over the past few weeks, there has been significant volatility in the precious metals looking at Gold, Silver, and Copper, and the last few trading days Gold and Silver have strung together a few positive days in a row. Both Gold and Silver have been trading at or near all time high prices and have been able to hold at these levels even with slight selling pressure.
Copper on the other hand has continued to struggle after the 50% tariff on all imports was announced last week, and the market has dropped from “overbought” to “oversold” levels on a daily basis in a matter of a few days. There will be a good amount of earnings coming out for the remainder of the week that could add additional volatility to the equity indices along with the precious metals to wrap up the week.
If you have futures in your trading portfolio, you can check out on CME Group data plans available that suit your trading needs tradingview.com/cme/
*CME Group futures are not suitable for all investors and involve the risk of loss. Copyright © 2023 CME Group Inc.
**All examples in this report are hypothetical interpretations of situations and are used for explanation purposes only. The views in this report reflect solely those of the author and not necessarily those of CME Group or its affiliated institutions. This report and the information herein should not be considered investment advice or the results of actual market experience.
Copper ShortCopper is now net short on the regression break.
The roll is +0.007% (Neutral).
I am not taking this trade.

#COPPER #MCX View as on 31st JulyMCX:COPPER1! Copper MCX if it doesnot make one more swing higher then the rally should correct all the way. Alternate is it could be doing a triangle and then make new high.

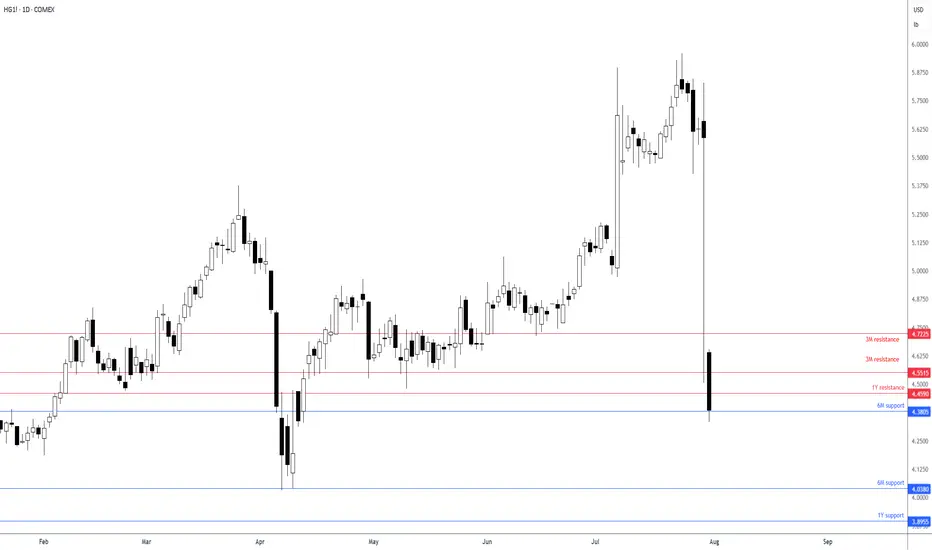
Copper testing support!Following the surprise announcement that the US administration is exempting tariffs on refined metals, the price of copper has tanked and connected with a 6M support from US$4.3805. Notably, directly above, we have a 1Y resistance level from US$4.4590 and a 3M resistance level at US$4.5515, while a breakout south could lead the base metal to as far south as 6M support at US$4.0380.
Given the downside momentum, a breakout lower could serve to add to the current bearish flow and potentially see sellers pyramid positions.
Written by the FP Markets Research Team
Copper: Trump Signs Tariffs on Imports Amid National Security...President Donald Trump signed a proclamation on Wednesday that imposes tariffs on copper imports, citing concerns over national security.
The White House announced that the new policy will introduce a 50% tariff on semi-finished copper products and other copper-derived goods that are highly dependent on the metal.
These tariffs are scheduled to come into effect on August 1, as outlined in a White House fact sheet.
In terms of market dynamics, copper is currently within a monthly demand zone, with a daily demand area also identified for setting pending orders. The potential impact on prices could be twofold: a possible upward movement driven by the discount effect on the metal, or continued decline following President Trump's announcement.
What are your thoughts on how these tariffs might influence copper prices moving forward?
✅ Please share your thoughts about HG1! in the comments section below and HIT LIKE if you appreciate my analysis. Don't forget to FOLLOW ME; you will help us a lot with this small contribution.

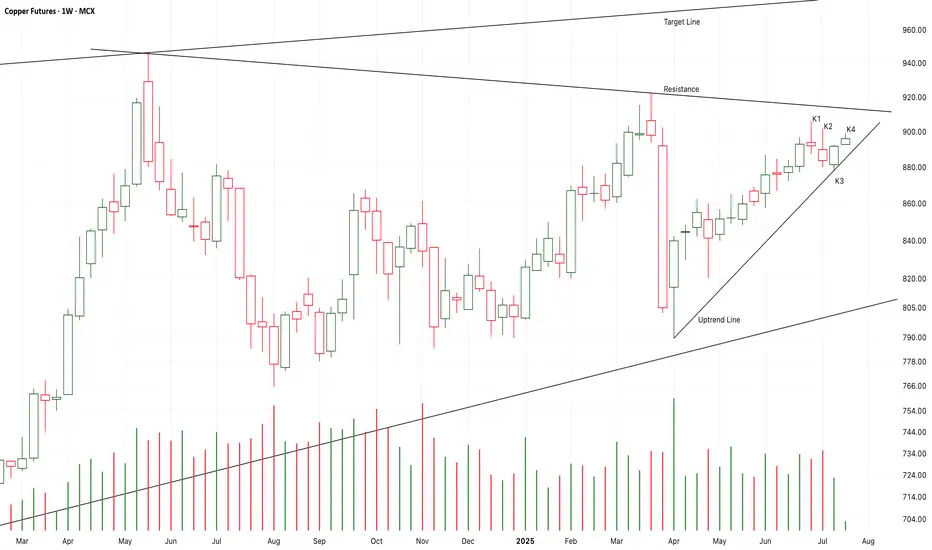
Chart Pattern Analysis Of Copper
K2 and K3 is a strong bullish up engulfing pattent.
K4 started with a bull gap to verify it.
It seems that K5 or K6 will break up the resistance to test the target line in the near future.
If I didn’t buy it earlier,I will try to buy it here.
I still hold the idea that the expensive metals such as Gold/Silver/Copper are in the long-term bull market.
Long-896/Target-1000/Stop-880
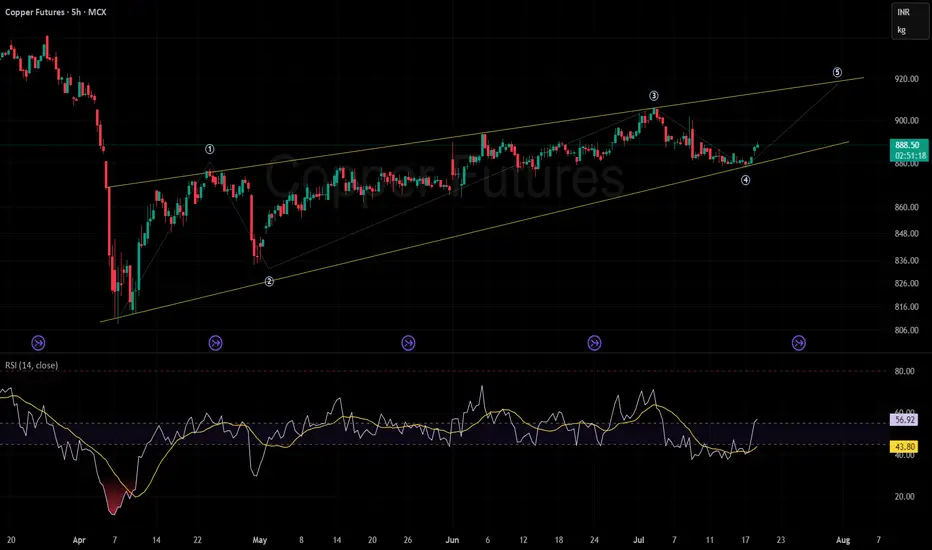
Copper looking good an upmoveKey Observations
Channel Pattern & Elliott Wave Count:
Price action is moving within a well-defined upward-sloping channel (yellow lines).
An Elliott Wave structure is marked (① to ⑤). The price just completed wave ④, suggesting the next move may attempt to form wave ⑤ towards the upper channel boundary, targeting roughly the 920 level.
Price Support & Resistance:
Support: The lower channel boundary, recently tested during the wave ④ dip (~880 area), acts as a dynamic support.
Resistance: The upper channel line, which coincides with the projected wave ⑤, serves as resistance near 920.
RSI & Momentum:
The Relative Strength Index (RSI) at the bottom oscillates between 43.81 (current), with a recent bounce upward.
The yellow MA of RSI is at 57.07, showing the RSI is crossing its MA from below, which is typically a bullish signal.
RSI is neither overbought nor oversold, offering room for upward movement if momentum sustains.
Trend Context:
The overall trend is upward within the channel.
Recent price action after the wave ④ low suggests a renewed attempt at bullish momentum.
Summary & Implications:
The chart implies a bullish bias as long as the lower channel (support) holds. There is a technical setup for a move toward the upper trendline and wave ⑤ target (~920).
Watch for price reactions near the lower channel support—if broken, it would invalidate the immediate bullish thesis.
RSI is supportive of further upside, but needs confirmation from increasing volume and a sustained move above the 890 mark.
COPPER Top of 4-year Rising Wedge. Sell.Copper (HG1!) eventually followed the bearish break-out signal we gave on our last analysis (April 03, see chart below) and within 2 days it hit our 4.1250 Target:
Right now the price sits at the top of the 4-year Rising Wedge pattern and on the 1W time-frame it is a textbook technical sell signal.
With the 1W RSI also rejected on a Lower Highs trend-line, we are looking to aim for the 1W MA50 (blue trend-line) at least. Every Bearish Leg since the July 11 2022 Low, reached at least its 0.618 Fibonacci retracement level before rebounding again.
As a result, our Target is 4.700, which given a fair 3-month time-frame, should be at the time marginally below the 1W MA50, in line with all previous bottoms of the Rising Wedge.
-------------------------------------------------------------------------------
** Please LIKE 👍, FOLLOW ✅, SHARE 🙌 and COMMENT ✍ if you enjoy this idea! Also share your ideas and charts in the comments section below! This is best way to keep it relevant, support us, keep the content here free and allow the idea to reach as many people as possible. **
-------------------------------------------------------------------------------
💸💸💸💸💸💸
👇 👇 👇 👇 👇 👇

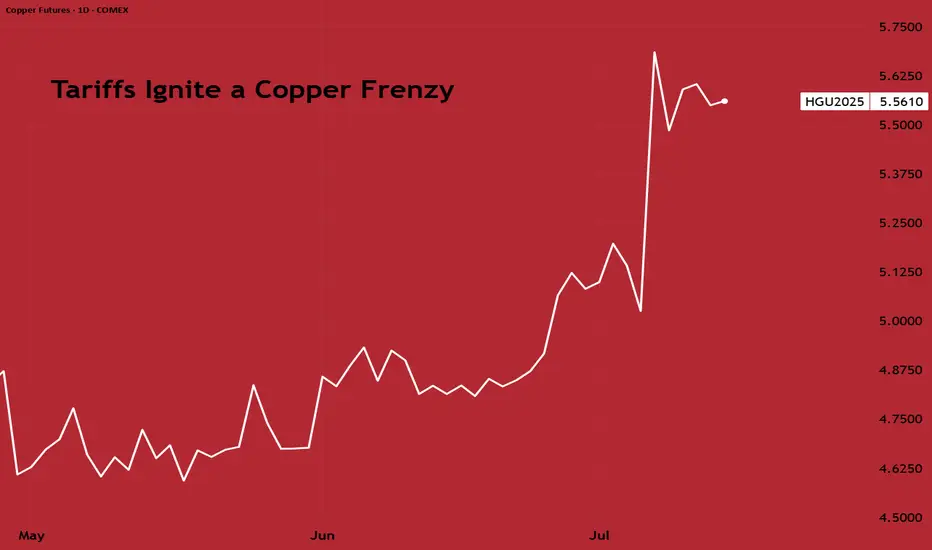
Tariffs Ignite a Copper FrenzyCOMEX copper has surged to a record premium over London Metal Exchange (LME) copper over the past few weeks, reflecting a lucrative arbitrage as traders rush metal into the U.S. ahead of looming import tariffs.
President Donald Trump’s announcement of a 50% tariff on U.S. copper imports (effective August 1, 2025) has dramatically disrupted the global copper market. U.S. futures are now trading at a significant premium of $2,600 per metric ton over LME prices, pulling physical copper into the US from around the world.
As a result, inventories have ballooned in U.S. warehouses while declining sharply elsewhere. COMEX (CME) stockpiles have surged to exceed the combined copper inventories of LME and SHFE (Shanghai), indicating massive stockpiling in the U.S.
Correspondingly, LME warehouse stocks have fallen to multi-year lows, fuelling a steep backwardation (near-term prices trading above far-dated futures) as available supply in London shrinks. LME–tracked inventories have declined by roughly 60% so far in 2025.
Source: Bloomberg
This tariff-induced distortion is also evident in trade flows. Analysts estimate the U.S. imported around 881,000 tons of copper in the first half of 2025, roughly double its underlying consumption, as buyers rushed to secure cheaper metal before tariffs hit.
Once the tariff is implemented and these stockpiles start being utilised, U.S. imports are expected to plunge and weigh on global copper prices later this year.
Going forward, clarity on the tariff’s scope regarding any exemptions for key suppliers like Chile or Canada will determine if COMEX Copper sustains a large premium.
CHINA'S PIVOT FROM HOARDING TO DRAINING
While the U.S. has been hoarding copper, demand in China, the world’s largest consumer, presents a mixed picture. On the one hand, China’s property construction sector remains sluggish, and manufacturing activity has only tentatively improved.
Earlier in the year, Chinese copper inventories surged to multi-year highs; an unusual build likely driven by weak consumption and precautionary stockpiling. However, this trend has since reversed sharply. Chinese copper stockpiles peaked around 377,000 mt in March before plunging to 126,000 mt by end-June.
This drawdown suggests that, despite macroeconomic headwinds, China’s copper usage remained resilient. Grid companies and manufacturers continued buying copper at high levels, even as consumer sectors slowed.
Source: Crux Investor
Copper demand in China is coming from strategic industries: State Grid investment soared nearly 20% YoY until May 2025, and manufacturing of electric vehicles and appliances remains a bright spot.
Owing to reduced demand in construction, though, the net effect for near-term demand remains somewhat on the softer side, but it is still far from collapsing.
Any further government stimulus for infrastructure or housing in H2 2025 could quickly translate into a bump in copper demand, given the low inventories now in China.
LONGER-TERM UPSIDE THROUGH SUPPLY CHALLENGES
Beyond the immediate cross-currents, the medium-to-long-term outlook for copper is fundamentally bullish, owing to the significant constraints on the supply side.
Many of the world’s largest copper mines are ageing, with declining ore grades and operational challenges.
In Chile (the top copper-producing country), Codelco’s output hit a 25-year low in 2023 amid falling grades and project delays. The state-owned giant is striving to boost production in 2025, but first-quarter 2025 output was essentially flat (+0.3% YoY), and was hampered by unforeseen disruptions like heavy rains and a nationwide power blackout.
Similarly, Anglo American, another major producer, has warned of lower production. Anglo expects its copper output to drop to 690–750 thousand tons in 2025, down from 773k in 2024, due to lower ore grades and water restrictions at its Chilean operations.
Due to the massive wedge between demand and supply dynamics, analysts have predicted the copper market to slip into a substantial deficit next year, even sans tariffs.
The recent tariff saga, creating all the noise, would exacerbate near-term tightness, and would lead to U.S. consumers drawing down global supply. This sets the stage for sharper shortages later.
Supply from recycling is also expected to take a hit due to the trade friction between China and US.
Source: Bloomberg
In response to the tariffs, China could cut back imports of US scrap copper. This would, in effect, reduce China's exports of refined copper, with less refined copper entering the global supply consequently.
This further strengthens the case for prolonged upward price pressure.
HYPOTHETICAL TRADE SET-UP:
For investors, the divergent short- and long-term forces in copper open several strategy avenues. In the very near term, prices may remain volatile or even pull back once U.S. imports pause, with others having increased access to the metal.
However, any such dip would present a buying opportunity given copper’s strong fundamentals. A straightforward bullish strategy is to establish a long position in copper futures, taking advantage of any weakness.
For example, one could go long the CME Copper futures (March 2026 expiry) to express a positive view on copper into next year.
Source: CME QuikStrike
Open interest for this contract lies just under 30,000, with volume as on 11/Jul clocking 3095.
The hypothesis is that after a period of consolidation, copper prices will resume an uptrend as the market shifts focus from temporary inventory builds to the looming supply deficit. Indeed, the term structure is also signalling tighter conditions down the line; while nearby copper prices spiked on the tariff news, longer-dated futures have also firmed as traders anticipate future scarcity.
Source: CME QuikStrike
With that in mind, a possible trade setup is outlined below:
● Entry: $5.68 per pound
● Target: $6.20 per pound
● Stop Loss: $5.37 per pound
● Profit at Target: $13,000 ((6.20 – 5.68) = 0.52 x 25,000 pounds/contract)
● Loss at Stop: $ 7,750 ((5.37 – 5.68) = -0.31 x 25,000 pounds/contract)
● Reward-to-Risk: 1.7x
The same view can also be expressed through CME Micro Copper futures, which offer smaller notional positions and more flexibility. Each Micro contract is priced in USD per pound and represents 2,500 pounds of copper, compared to 25,000 pounds for the standard contract.
As history shows, the “electrifying metal” tends to reward those who can weather short-term volatility in pursuit of its long-term uptrend.
MARKET DATA
CME Real-time Market Data helps identify trading set-ups and express market views better. If you have futures in your trading portfolio, you can check out on CME Group data plans available that suit your trading needs tradingview.com/cme .
DISCLAIMER
This case study is for educational purposes only and does not constitute investment recommendations or advice. Nor are they used to promote any specific products, or services.
Trading or investment ideas cited here are for illustration only, as an integral part of a case study to demonstrate the fundamental concepts in risk management or trading under the market scenarios being discussed. Please read the FULL DISCLAIMER the link to which is provided in our profile description.
Bullish Reversal Builds in Copper: Eyes on $5.20 Resistance
The current price has closed above the Bollinger Band middle line (20-day SMA), indicating short-term upward momentum.
A sustained close above 4.90–4.95 could open the way to challenge the psychological level of 5.00 and possibly 5.20.
Immediate resistance: 4.95 → 5.00 → 5.20
Support zones: 4.75 (middle band) → 4.60 (recent low) → 4.45 (lower band)

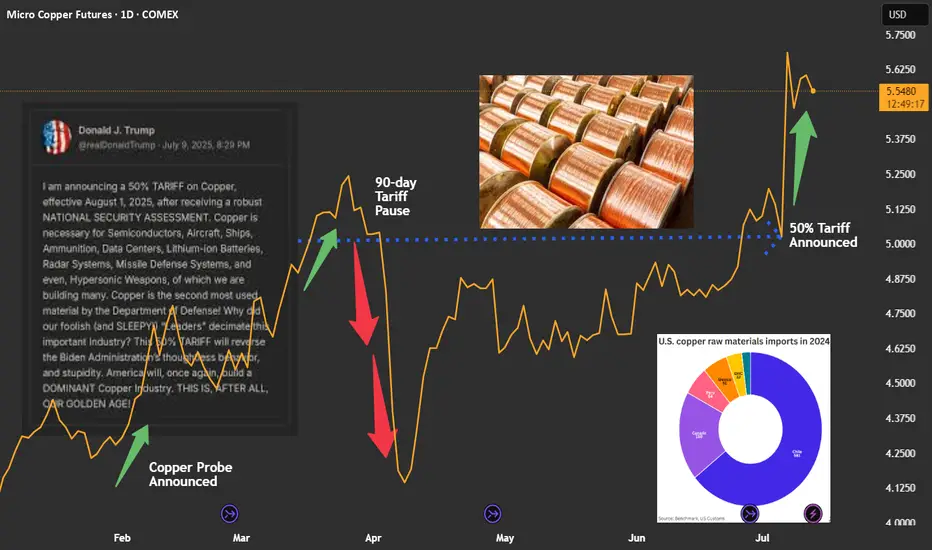
Copper: Event-driven Trade Idea on Recent TariffsCOMEX: Micro Copper Futures ( COMEX_MINI:MHG1! ), #microfutures
The Event
On July 9th, President Trump announced that he would impose a 50% tariff on imports of copper, effective August 1st.
The decision was based on national security assessment. Copper is the second most used material by the U.S. Department of Defense. The President intents to use tariffs to reduce reliance on imports and shore up support for domestic production.
Immediate Market Reaction
U.S. copper prices ended Tuesday’s session over 13% higher — the sharpest single-day gain since 1989. The September COMEX copper futures contract was settled at $5.584 a pound on Friday, up 35.7% year-to-date.
Due to tariffs, Copper in the U.S. is priced at a large premium over international markets.
• UK: LME copper contract was quoted at $9,660.5 per ton on Friday.
• China: SHFE coper futures was settled at RMB 78,420 per ton. It can be converted to $10,959.4 via the Dollar/RMB exchange rate of 7.1555.
• US: COMEX copper quote of $5.584 can be converted to $12,312.7 per ton.
• As of Friday, COMEX copper is priced at a 27.5% premium over LME copper, and a 12.3% premium over SHFE copper.
The U.S. Copper Market
The U.S. Geological Survey reports that the 2024 total refined copper consumption was 1.8 million metric tons. Of which, 850,000 tons were from mining, 150,000 tons were refined from scrap, and 810,000 tons from imports.
Chile is the biggest source of U.S. copper imports, accounting for 581,000 tons, or 71.7% of total imports. Canada is the second largest, for 169,000 tons, or 20.9%.
Copper is a widely used base metal, found in products ranging from machinery, electronics, household goods, housing, infrastructure projects, to aircraft and missiles.
Since President Trump announced a probe into copper in February, traders have been poised for a hike on copper duties, leading to major shifts in inventories away from Europe and Asia and into the U.S.
The Next Event: Will the Copper Tariffs get postponed or reduced?
The goal to increase domestic production of copper is very challenging. It will take years to ramp up and decades to fully meet demand — at a massive upfront investment cost.
Hiking the import duties would not help national security. It could not change the fact that the biggest copper mines are in Chile, Peru and Canada. A sharp increase in the cost of copper will quickly translate into wide-ranging inflation in the U.S.
In my opinion, once the Trump administration realizes the full impacts, we could possibly see a crawl-back from the intended copper tariffs. The effective date would be postponed, the tariff rate could be reduced, and many companies may get exemption/waiver. We have seen similar maneuvers happening multiple times in the past few months.
Overall, the actual impact of copper tariffs will be much smaller than the original announcement.
Shorting COMEX Copper Futures
Historically, the price difference between COMEX and LME coppers has been near-zero and was around the $150 level in 2024.
Since February, COMEX copper has been trading at $500-$1,500 premium over LME. As of Friday, COMEX copper futures have gone up 35% this year and are now priced at $2,652 per ton above LME copper.
In my opinion, these price differences reflect no economic fundamentals. It is purely due to the ever-changing global tariff conflict. If President Trump rescinds his tariff narratives, we could likely see a large drop in COMEX copper prices.
A trader sharing this view could explore shorting the COMEX Micro copper ( GETTEX:MHG ).
Last Friday, the September micro copper futures contract (MHGU5) was settled at 5.5910. Each contract has a notional value of 2,500 pounds of high-grade copper, or a market value of $13,977.5. To buy or sell 1 contract, a trader is required to post an initial margin of $1,100. The margining requirement reflects a built-in leverage of 12.7-to-1.
Let’s use a hypothetical trade to illustrate how to use a short futures position to take advantage a potential reduction on copper tariffs.
Hypothetical Trade:
• Short 1 MHGU5 contract at 5.5910, and set a stop loss at 6.00
• Trader pays $1,100 for initial margin
Scenario 1: Tariffs go into effect, copper rises to $6.57
• Futures reflect a 50% premium over current LME copper price, which is at $4.38 per pound
• Short order stop loss at 6.00, and the maximum loss is $1,022.5 (= (6-5.591) x 2500)
• The trader loses most of the margining fund, but owes no more
Scenario 2: Trump Rescinds Tariffs, Copper falls to $4.38
• COMEX copper will be priced at No premium over LME
• Short position gains: $3,027.5 (= (5.591-4.38) x 2500)
• The hypothetical return will be 275.2% (= 3027.5 / 1100)
The above scenarios show that
• When copper falls, short position will have higher returns due to its leverage nature.
• When copper rises, the stoploss will kick in to set maximum losses.
The above trade idea could be deployed using the standard-size Copper Futures contract. Its notional value is 25,000 tons, which is 10 times bigger than that of the micro contract. The initial margin is $11,000. The standard-size contract is more liquid. On Friday, it had a total volume of 60,313 contracts, and an open interest of 221,682.
Happy Trading.
Disclaimers
*Trade ideas cited above are for illustration only, as an integral part of a case study to demonstrate the fundamental concepts in risk management under the market scenarios being discussed. They shall not be construed as investment recommendations or advice. Nor are they used to promote any specific products, or services.
CME Real-time Market Data help identify trading set-ups and express my market views. If you have futures in your trading portfolio, you can check out on CME Group data plans available that suit your trading needs www.tradingview.com
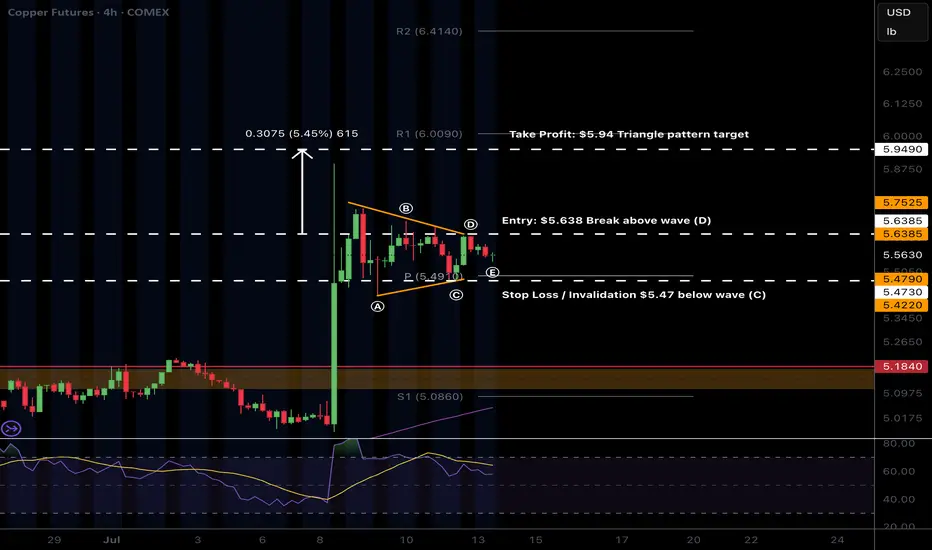
$COPPER triangle trade?CAPITALCOM:COPPER triangle has potentially printed and a triangle is an Elliot wave pattern that results in a terminal thrust up to complete a motif wave.
That would trap bulls as price terminates with a poke above the all time high keeping them believing they can capture the same gains already gone.
After the termination wave 2 often finds support at the triangle base.
Safe trading
Copper - the hot topic this weekUS is planning to implement tariffs on copper imports at a scale of 50%. It's an interesting move, which might not make much sense. Let's dig in.
MARKETSCOM:COPPER
COMEX:HG1!
Let us know what you think in the comments below.
Thank you.
75.2% of retail investor accounts lose money when trading CFDs with this provider. You should consider whether you understand how CFDs work and whether you can afford to take the high risk of losing your money. Past performance is not necessarily indicative of future results. The value of investments may fall as well as rise and the investor may not get back the amount initially invested. This content is not intended for nor applicable to residents of the UK. Cryptocurrency CFDs and spread bets are restricted in the UK for all retail clients.
