My Opinion on CRV cryptocurrenciesWith Fibonacci Extension, I found potential that the price have high possibility to go higher to price 1usdt. But this is just my opinion, this is not financial advice, PLEASE DO YOUR OWN RESEARCH
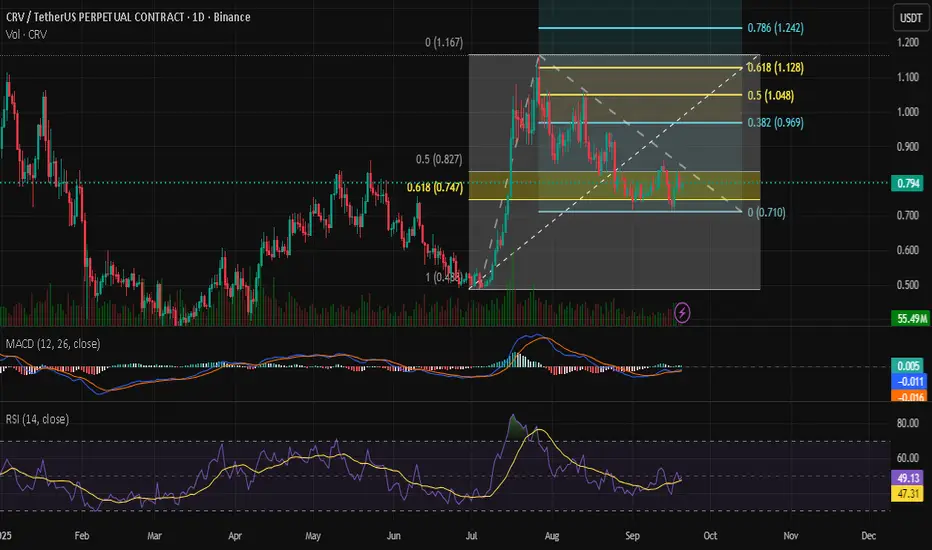
CRVUSDTThis is a good buy as the price has established a solid support level, indicating that buyers are stepping in consistently at this zone. The repeated defense of this area suggests limited downside risk, while the potential for an upward move remains favorable.

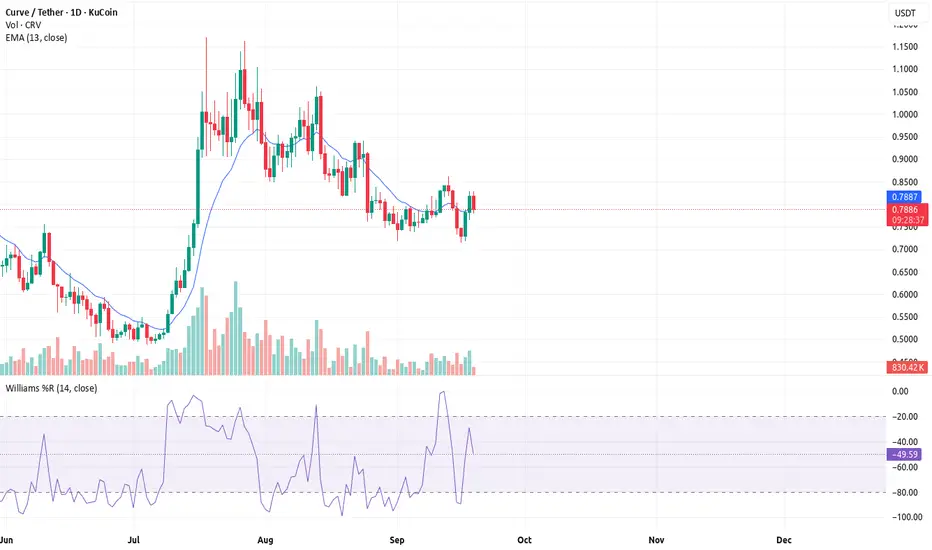
The 13 EMA System On Re- Entry (Swing Trading)So am sitting on my computer desk.
Trying to register my publishing business..
then it hit me man.
Its more affordable to start a business
than to get a driving license.
So which one would you do?
Would you start a business or get a driving
license?
Starting a business is something
i wish i did
Crvusdt buy opportunityCRVUSDT is forming a potential inverse head and shoulders pattern, with price approaching the neckline zone. The marked entry range offers a strategic buy opportunity for early positioning. A confirmed breakout above the neckline would signal strong bullish continuation, with the final target outlin

CRVUSDT 1D#CRV is moving inside a falling wedge pattern on the daily chart. Currently, it has bounced nicely from the daily EMA200 and is on the verge of breaking out above the wedge resistance and the daily SMA50. Keep an eye on it. If it happens, the potential targets are:
🎯 $0.8762
🎯 $0.9744
🎯 $1.0538
🎯 $

CRV Bullish FlagCRV is forming a bullish Wedge.
If the price broke the resistance level at 0.86 and Established above, We can expect a bullish move up to 1.11 area.
Stops at 0.71.

Retail Trap at Resistance📣 Team, get this…
CRV printed 5 green candles, triggered a golden cross, and suddenly every YouTube thumbnail said “TO THE MOON.” 🌝 That’s exactly the kind of retail trap we love to fade. This ain’t DeFi summer, it’s just overheated spaghetti. 🍝
🔥 TRADE SETUP
Bias: Short
Strategy: Retail Trap at Re

CurveCrv usdt daily analysis
Time frame daily
Risk rewards ratio >3.2 👈👈
Target 1.12$
Crv is dropping smoothly after it's powefull pump
You can see that crv is in the two downtrend yellow lines
If crv can break this famous pattern, with a good news in crypto market my analysis will happen

Curve DAO is still working on a bullish strucureCRV still has room to dip while building a CHoCH and getting follow-through. If the price falls into short-term liquidity laddering in is a safe way to prepare for the reversal and expansion.

CRVUSDT – Accumulation Breakout Setup After 163% MoveWe nailed a 163%+ move on CRV in the first round — a textbook momentum play. Now, price action is showing signs of breaking out of accumulation, and we’re watching closely for confirmation.
🔍 Key Levels & Setup
Entry Zone: Around $0.80 (support retest)
Breakout Confirmation: Daily close above $0.

See all ideas
Summarizing what the indicators are suggesting.
Oscillators
Neutral
SellBuy
Strong sellStrong buy
Strong sellSellNeutralBuyStrong buy
Oscillators
Neutral
SellBuy
Strong sellStrong buy
Strong sellSellNeutralBuyStrong buy
Summary
Neutral
SellBuy
Strong sellStrong buy
Strong sellSellNeutralBuyStrong buy
Summary
Neutral
SellBuy
Strong sellStrong buy
Strong sellSellNeutralBuyStrong buy
Summary
Neutral
SellBuy
Strong sellStrong buy
Strong sellSellNeutralBuyStrong buy
Moving Averages
Neutral
SellBuy
Strong sellStrong buy
Strong sellSellNeutralBuyStrong buy
Moving Averages
Neutral
SellBuy
Strong sellStrong buy
Strong sellSellNeutralBuyStrong buy
Displays a symbol's price movements over previous years to identify recurring trends.