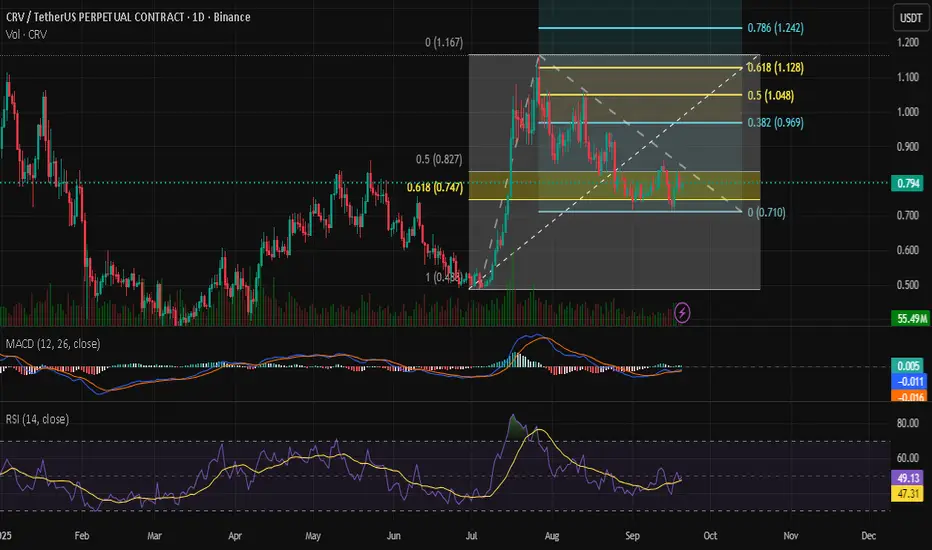
My Opinion on CRV cryptocurrenciesWith Fibonacci Extension, I found potential that the price have high possibility to go higher to price 1usdt. But this is just my opinion, this is not financial advice, PLEASE DO YOUR OWN RESEARCH
CRVUSDT.P trade ideas
The #1 Bearish Chart PatternThere is something so powerful;
about technical analysis
that's very hard to put together
but once you do piece them together
you will begin to see the power of it
Tracking the price for
these alt coins
has been the best hing
i have ever witnessed.
Seeing the pennant bearish
price pattern
Has been something
i didn't think i would
see
This stuff is starting to get
more and more clear the more
i study about it.
Studying about the reversal pattern
is like reverse psychology
It gives you
the advantage in the market
Because?
Because everyone wants
a bullish signal when
the market is bullish
every one wants a bearish signal
when the market is bearish.
No one wants a correction.
No one wants the reversal.
Think about it how many
times have you seen a sucker
and you know deep down in your heart
that sucker
wont make it
Now imagine a sucker
that makes it in life.
That what this reversal pattern
is all about my man
this is what separates you
from the crowd
because you have hope that one
day that loser guy
you see will make it
think of the buy signal as
the potential you see in that loser
guy friend of yours
You have seen the potential but
no one around
you has..you have seen
it using the buy signal
now you see a big potential
he finally tells you he has made it
because you saw the potential in him
a long time ago and now
he is thanking you for seeing
this potential in him
and vows to help you
with hand outs if you will
ever need one.
That's what this correction is all about
Notice the angles
there all 90 degrees
this chart pattern is
called the pennant bearish pattern
i got it form Steve Nison's book
on Japanese candlestick patterns.
Thats where i first saw
this pattern.
Patterns are important .
If you want to learn more check
out the resources below.
Rocket boost this content to learn more.
Disclaimer:Trading is risky please learn risk
management and profit
taking strategies.Also
feel free to use a simulation trading account
before you trade with real money.
CRVUSDT 1D#CRV is moving inside a falling wedge pattern on the daily chart. Currently, it has bounced nicely from the daily EMA200 and is on the verge of breaking out above the wedge resistance and the daily SMA50. Keep an eye on it. If it happens, the potential targets are:
🎯 $0.8762
🎯 $0.9744
🎯 $1.0538
🎯 $1.1331
🎯 $1.2461
⚠️ Always remember to use a tight stop-loss and follow proper risk management.

The 13 EMA System On Re- Entry (Swing Trading)So am sitting on my computer desk.
Trying to register my publishing business..
then it hit me man.
Its more affordable to start a business
than to get a driving license.
So which one would you do?
Would you start a business or get a driving
license?
Starting a business is something
i wish i did in my younger days.
Those days i had so much imagination
and no guidance on how to monetise
my ideas.
Starting this publishing business
is something am so proud of myself by.
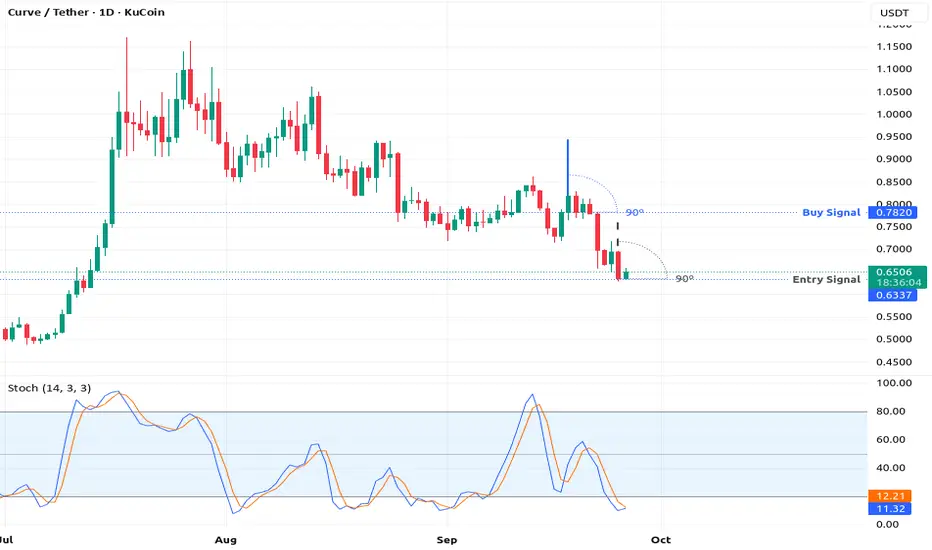
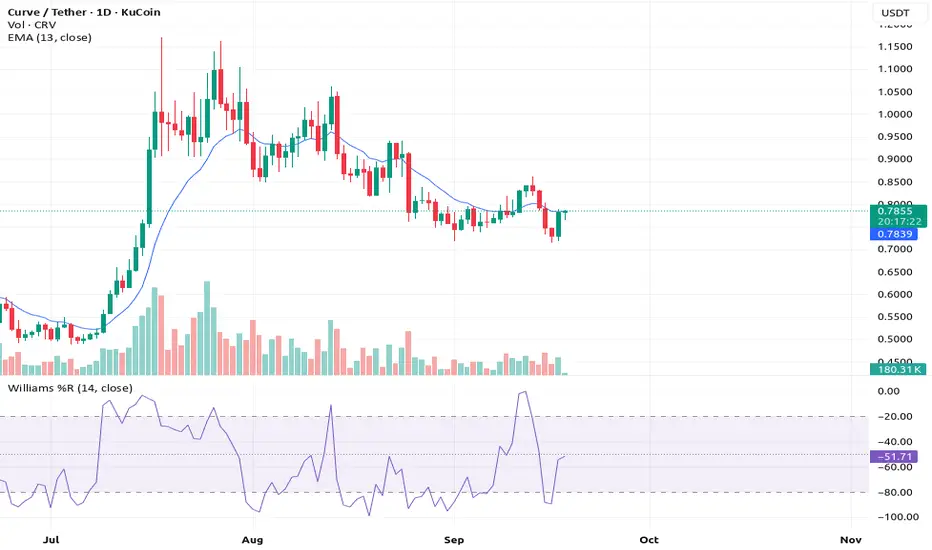
Now look at this chart KUCOIN:CRVUSDT
you will see something called a failure swing.
What is a failure swing?
This is the break even point or the re entry signal.
Dont get sacred of this
its a sign that the next bullish move in KUCOIN:CRVUSDT
is going to be huge!!
Am using the William %R to see this swing
because its my favourite indicator..
Which indicator do you use to see the failure swing?
Do you think this is where the name
swing trading comes from?
If you remember on the last idea
i told you i saw a dragonfly doji as an entry
This failure swing signal is the icing on the cake.
Trade safe.
Rocket boost this content to learn more
Disclaimer:Trading is risky please learn risk managment
and profit taking strategies.Also feel free to use
a simulation trading account before you trade with real money.
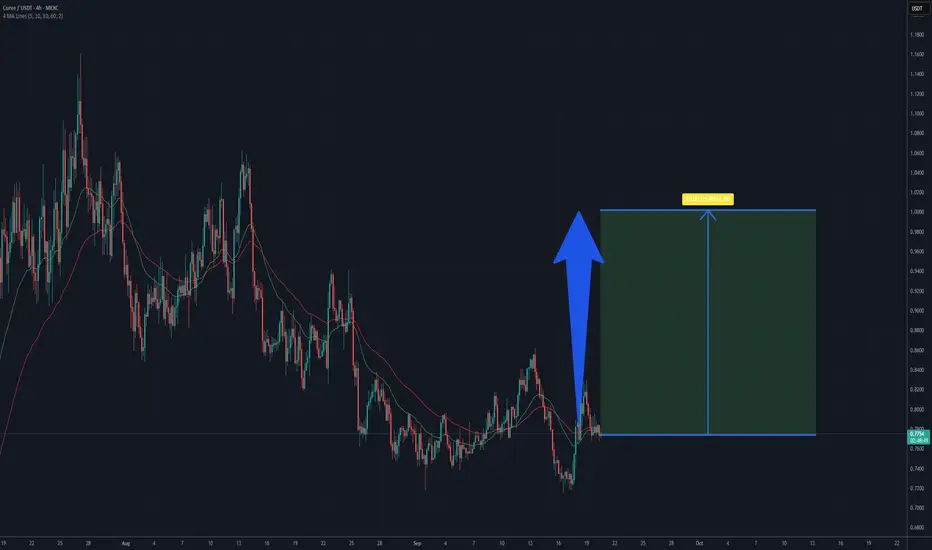
CRVUSDTThis is a good buy as the price has established a solid support level, indicating that buyers are stepping in consistently at this zone. The repeated defense of this area suggests limited downside risk, while the potential for an upward move remains favorable.

Is it a time for CRVUSDT. 30% potential target 1 $
On the 4-hour Curve/USDT chart the market shows a period of sideways consolidation after a recent rebound from the 0.72 USD area. Price is hovering around 0.77 USD, moving in a relatively tight range and testing both short-term moving averages.
The shorter moving average has started to flatten and occasionally crosses above the longer one, a sign that selling momentum is easing. At the same time, the longer moving average still trends slightly downward, so the broader picture remains neutral to mildly bearish until a clear break higher occurs.
A key support zone is visible around 0.74–0.75 USD, where several pullbacks have recently been absorbed. Above current levels, the first notable resistance lies near 0.80 USD, followed by a wider supply zone around 0.86–0.88 USD that previously capped upward moves. A sustained close above those levels, especially with rising trading volume, would indicate strengthening bullish pressure.
Overall, the chart reflects a market that is stabilizing after a decline, with early signs that buyers are trying to build momentum. Further confirmation from price closing above the identified resistance areas and a continued uptick in volume would improve the outlook for additional upward movement.
Potential TP: 1 $
The 13 EMA System Rocket Booster StrategyHave you ever been labelled as a loser?
Thats what happened to me last night.
I was talking to an old buddy of mine.
He told me off.
He said:
"Lubosi you are old, grow up
and leave your parents home."
"Lubosi find a job and get married"
I replied telling him
that i have options.
In this case am talking
about crypto options trading.
Now am not in this trade.But i want to
share it with you because i appreciate
you following me.I think
i saw one of my followers
with a tag from
"the real world" i am humbled
to know that my reach goes
even to you.
You see am not the "cool" guy
but one thing about me man is that
i bust my behind to get isshh done.
Am like the video director
for the real world - That guy is cool
sadly he gets bullied. Once in a while
but they love him, because
he produces good results.
The market doesn't care about
your race, past, or present
All it cares about is what you are
going to give it today.
If you give the market high value.
You will get
high value in return
Thats why am so humbled
to be part of
this community.
My goal is to take you with me on
my journey.
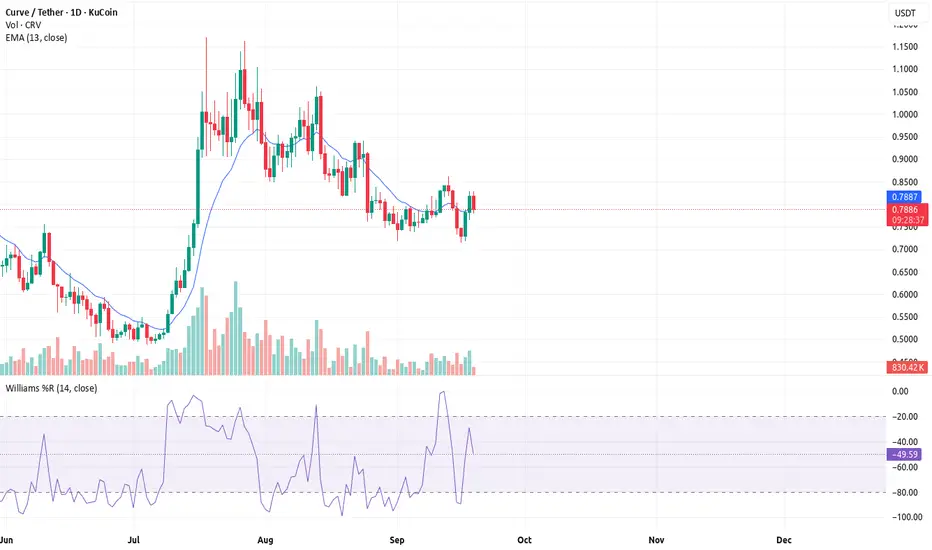
Now look at this crypto KUCOIN:CRVUSDT
its below the William %R -50
that's your entry No negotiation.
You should exit at above the -20
that's your profit taking target and risk
management no negotiation
man do it.
This is called the 13 EMA System
Rocket Booster Strategy
Rocket boost this content to learn more.
Thank you for reading.
P.S.
The entry pattern you are seeing is called the
Dragon Fly Doji
Its got a long wick at
the bottom.
I learnt this from candlestick patterns
book by Steve Nison
Thanks for reading again
remember to rocket boost the content.
So that you learn more
Disclaimer: Trading is risky please learn risk management
and profit taking strategies.Also
feel free to use a simulation trading account
before you trade with real money .
Retail Trap at Resistance📣 Team, get this…
CRV printed 5 green candles, triggered a golden cross, and suddenly every YouTube thumbnail said “TO THE MOON.” 🌝 That’s exactly the kind of retail trap we love to fade. This ain’t DeFi summer, it’s just overheated spaghetti. 🍝
🔥 TRADE SETUP
Bias: Short
Strategy: Retail Trap at Resistance
Entry: $0.98 – $1.03
SL: $1.10
TPs: $0.78, $0.65, $0.50
Why?
– RSI 83 + MACD maxed out = overcooked
– LTF CHoCH after sweeping $1.03
– Positive funding across exchanges → ripe for short squeeze reversal
– Retail buying golden cross = premium exit liquidity
Candle Craft | Signal. Structure. Execution.

CRV Bullish FlagCRV is forming a bullish Wedge.
If the price broke the resistance level at 0.86 and Established above, We can expect a bullish move up to 1.11 area.
Stops at 0.71.

#CRVUSDT 4H ChartPrice is currently ranging in an ascending channel and recently got rejected off the resistance line. MACD is showing some bullish weakness, RSI is bought and EMAs are turning bullish. Price is expected to tap into the 4h demand at $0.8 before continuing its bullish movements.

Crvusdt buy opportunityCRVUSDT is forming a potential inverse head and shoulders pattern, with price approaching the neckline zone. The marked entry range offers a strategic buy opportunity for early positioning. A confirmed breakout above the neckline would signal strong bullish continuation, with the final target outlined on the chart. Let us know your thoughts on CRV.

CurveCrv usdt daily analysis
Time frame daily
Risk rewards ratio >3.2 👈👈
Target 1.12$
Crv is dropping smoothly after it's powefull pump
You can see that crv is in the two downtrend yellow lines
If crv can break this famous pattern, with a good news in crypto market my analysis will happen

Curve DAO is still working on a bullish strucureCRV still has room to dip while building a CHoCH and getting follow-through. If the price falls into short-term liquidity laddering in is a safe way to prepare for the reversal and expansion.

CRVUSDT – Accumulation Breakout Setup After 163% MoveWe nailed a 163%+ move on CRV in the first round — a textbook momentum play. Now, price action is showing signs of breaking out of accumulation, and we’re watching closely for confirmation.
🔍 Key Levels & Setup
Entry Zone: Around $0.80 (support retest)
Breakout Confirmation: Daily close above $0.83
Stop Loss: Daily close below $0.73
Take Profit Targets:
TP1: $0.94
TP2: $1.07
TP3: $1.31

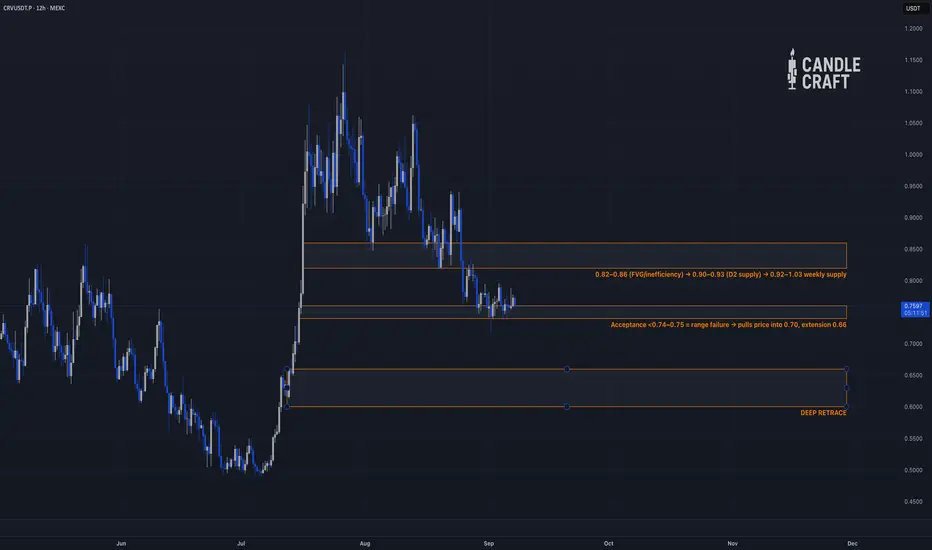
CRVUSDT — Stuck Under the 0.80 CeilingCRV feels like it’s hitting its head on the same doorway every bounce. Each rally into 0.80 gets sold, each dip defended near 0.75. Let’s map the price action.
High Timeframes (Weekly → 2D → 12H)
– Weekly: Corrective drift after 1.0 rejection. Supply 0.92–1.03; demand 0.68–0.72, deeper 0.60–0.66.
– 2D: Lower-highs since Aug; basing 0.74–0.76. Resistance 0.82–0.85, support 0.74–0.76 → 0.70.
– 12H: Range 0.74–0.82. Acceptance ≥0.82 = 0.84–0.86. Break <0.74 = 0.70 → 0.66.
Orderflow / Profile
– POC ~0.76–0.77.
– VAL 0.74–0.75, VAH 0.79–0.80.
– VAH rejections dominate; delta clusters lean distributive.
Derivatives
– OI steady-to-down.
– Funding ~0, CVD net-down.
– No leverage chase, spot flows distributive.
Inter-Market
– BTC mid-range, BTC.D <60%. Alts can rotate, but CRV remains capped unless reclaim ≥0.80.
Conclusion
CRV is balanced-to-heavy around POC 0.76–0.77. Above 0.80 → 0.84–0.86. Below 0.74–0.75 → 0.70, extension 0.60–0.66.
💡 Pro Tip: In markets boxed this tight, grid bots can print profits by automating the support-resistance rotation while waiting for the breakout.
Candle Craft | Signal. Structure. Execution.

CRV-USDT SHORT LAST UPDATE (FULL TARGET)Hello my good friends 😍
I hope you are well 💖
First of all, thank you for giving me the motivation to post more analyses by hitting the 👉boost button👈
Let's go for a quick update of the previous analysis. The analysis I did on the CRV-USDT cryptocurrency and now it can be said that it is fully targeted and you can exit this position and close the position
The targets that I had planned for this analysis, although it took a while, were touched one after the other
💁♂️This analysis was mid-term
Targets of this analysis:
✅TP1: 0.93$ (DONE) 🔥
✅TP2: 0.82$ (DONE) 🔥🔥
✅TP3: 0.73$ (DONE) 🔥🔥🔥
🤔Has anyone used this analysis?
🤔 Are you ready for a new analysis?
🤔Would you like me to put an analysis on Bitcoin?
Share your opinion with me 🙂↕️
To support me, I would appreciate it if you boost the analysis and share it with your friends so that I can analyze it with more energy for you, my dears. Thank you all. 💖

CRV : Will suffering be broken?Hello friends
Well, after reaching a resistance and hitting a higher ceiling, the price has fallen in the two movement logs that we have specified for you.
Now the price has been compressed in a support area and we have to wait for it to move to the specified targets if this range is broken.
*Trade safely with us*

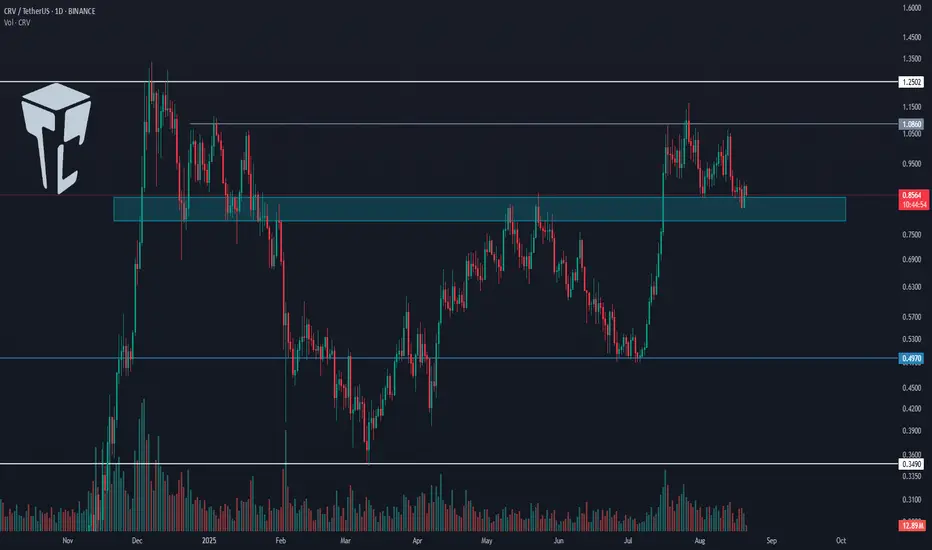
TradeCityPro | CRV: Key Support Test in DeFi Token👋 Welcome to TradeCity Pro!
In this analysis, I want to review the CRV coin for you. It is one of the DeFi projects under Ethereum with a market cap of 1.17 billion dollars, currently ranked 72 on CoinMarketCap.
📅 Daily Timeframe
In the daily timeframe, CRV has a very important support zone, and right now the price is trading near this area.
✔️ The overall trend of CRV can currently be considered bullish because the main highs and lows it has formed are higher highs and higher lows, and at the moment, the price is in the corrective phase of this trend.
⚡️ If the support zone is broken, this corrective phase will deepen, and the price could move toward lower levels. The main supports for this coin in the daily timeframe are 0.497 and 0.349.
💥 Considering the ongoing bullish trend, long positions are currently more logical. If CRV gets supported at this zone, we can look for triggers in lower timeframes to open positions.
📈 The main triggers for long positions on this coin are the breakouts of 1.086 and 1.2502.
📝 Final Thoughts
Stay calm, trade wisely, and let's capture the market's best opportunities!
This analysis reflects our opinions and is not financial advice.
Share your thoughts in the comments, and don’t forget to share this analysis with your friends! ❤️
CRV SHORT UPDATE Hello everyone 😍
Let's go for an update on the analysis of the CRV-USDT cryptocurrency
According to the analysis, everything went great and we achieved the first target. After that, we experienced a good price growth, but our analysis did not stop and we moved towards the second target and the second target was touched just now.
TP1: 0.93$ DONE ✅🔥
TP2: 0.82$ DONE ✅🔥
TP3: 0.73$ soon . . .
Did anyone use this analysis?
To support me, I would appreciate it if you boost the analysis and share it with your friends so that I can analyze it with more energy for you, my dears. Thank you all. 💖

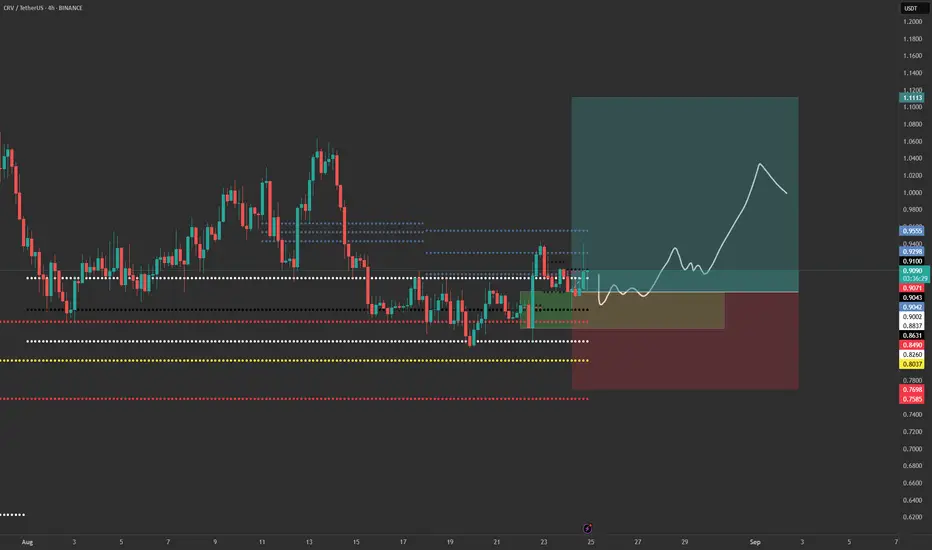
CRV still bullish on HTF, but dips are possibleOn higher timeframes CRV still look awesome, although last week's dump increased chances for lower correction. But that still can change if price returns back above 2024 close - in this case only 0.99 will be on the way to breakout.
I don't have any CRV on spot. Not that I don't like it - just not ready to load a bag above 0.75 (might miss it completely, but I don't care)
CRV Price Analysis: Bullish Breakout Targeting $2.64 CRV has been in a long accumulation phase since 2022, suggesting selling pressure has weakened and buyers are slowly gaining control.
The current price is around $1.0436, with RSI at 54.59, indicating mild bullish momentum above the neutral 50 line.
A significant resistance lies at $2.6395, which aligns with a key historical structure and a psychological barrier.
Major supports are found at $0.6001 and $0.4005, both levels from which price has previously bounced strongly.
The chart shows a potential breakout above the short-term blue range, which would confirm bullish continuation.
A monthly close above $1.10 would strengthen the bullish case toward the $2.6395 target.
Long lower wicks on recent candles indicate strong buyer defense at lower prices.
The risk-to-reward from current price to the $2.6395 target is attractive, exceeding 1:2 even with conservative stops.
Holding above $1.00 for consecutive monthly closes will greatly increase the probability of a sustained rally.
Overall momentum and structure lean bullish, with a projected upside potential of over 150% if the breakout holds.
