Crypto Cycle: The Arrogance and The Irony — A Must ReadThe Cycle That Changed Everything
This cycle — which really started in October 2023 — broke every pattern from previous crypto bull runs.
Crypto was created as a rebellion:
Freedom from banks.
An anti-system technology.
Privacy.
Self-sovereignty.
A way for normal people to create wealth without p
Key data points
Previous close
—
Open
—
Day's range
—
About Crypto Total Market Cap, $
A prepared trader is defined by their ability to see a bigger picture of a market. It applies to crypto traders too — if you agree, we've prepared a chart that will let you see the whole crypto market from a bird's-eye view. It shows total crypto market cap, which is calculated by TradingView by adding up top 125 coins market caps, which, in their turn, are the number of coins times their current price. A growing market cap can indicate investors' interest and their positive evaluation of the current market state. For you it might be a good indicator of where the wind blows and whether digital coins are a good investment tool.

CRYPTO MARKET IN BIG TROUBLE! CRACK!!🔥 Crypto Bros… this is the LAST thing you ever want to see on your chart.
The last time I warned about a MEGAPHONE CRACK back in July 2024, the entire crypto market dropped 31% — and that was while it was still in an uptrend.
This time?
This crack is far, far worse because it’s breaking the entire

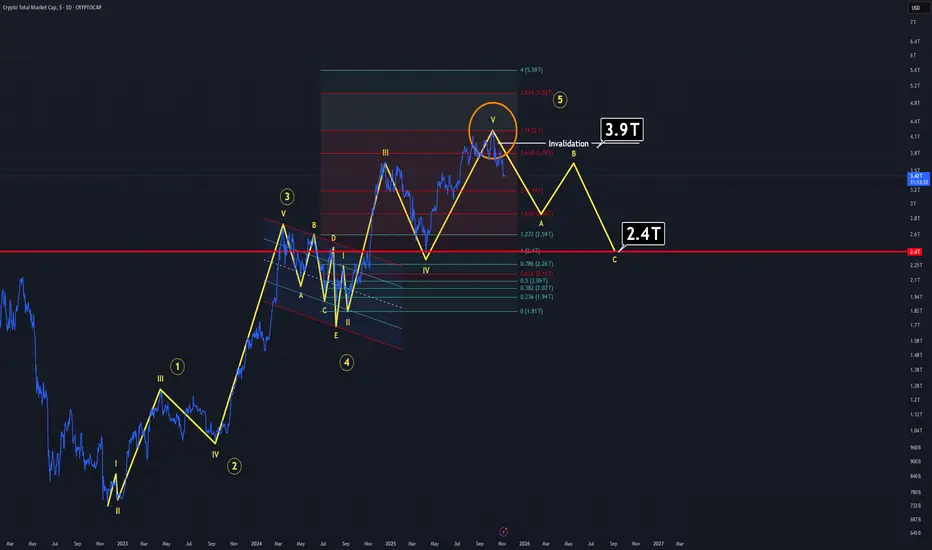
TOTAL market cap to hit all time high! 🚀 Why I believe TOTAL MARKET CAP is bottoming & gearing up for a run to new ATHs 🟢📈
After reviewing Elliott Wave counts + classical price action, the structure looks extremely constructive. Here’s why 👇
🔍 Key Reasons I'm Expecting a Major Rally:
Wave 4 appears complete 🧩
Price just tapped the lon

"Truth or Dare?"The parameter known as "Total" (All total market cap), shows a clear signal right now.
Before explain the techniacl details, I'll explain why should this move work:
Fundemental Details:
- FED has cut the interest rates for second time this year and most likely do it again before the year ends in
MARKETS week ahead: November 17 – 23Last week in the news
The longest Government shutdown in the US is over, however, investors were more concerned regarding valuations of tech companies and probability that the Fed might (not) cut rates in December. A strong correction occurred in equity markets followed with a strong sell-off on th
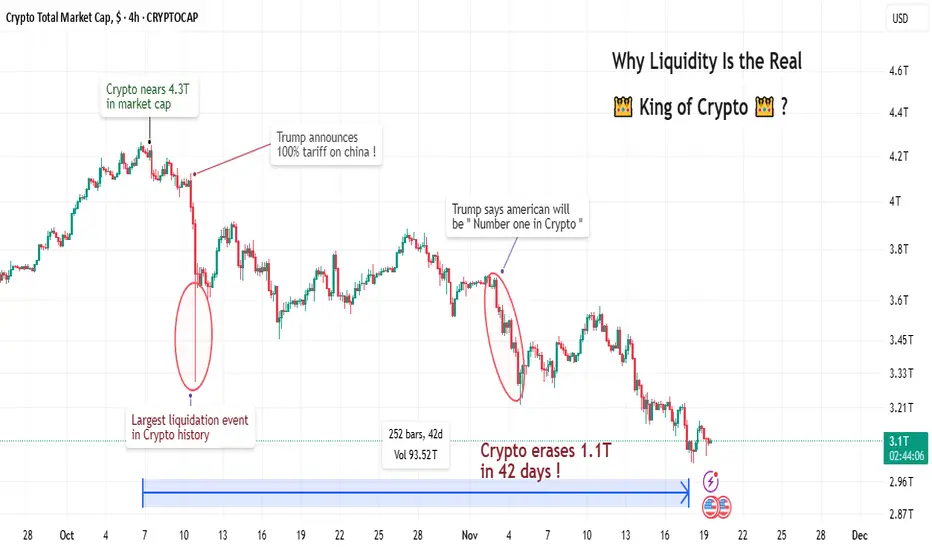
Why Liquidity Is the Real King of Crypto ?🧨 The $1.1 Trillion Lesson: Why Liquidity Is the Real King of Crypto 🧨
A deep dive into how macro headlines and liquidity shifts shape every chart you trade.
Hello Traders 🐺
In this idea, I want to take you on a journey through one of the most brutal and eye-opening moments in crypto history — a
The Bear Market. Officially Here.
Well, congrats to everyone on the start of the bear market. If anyone still hasn’t realized it yet — this is it.
CRYPTOCAP:TOTAL has broadly followed the roadmap from my previous overview , and now we finally have confirmation: five waves up, an ending diagonal, the main volume pool sitting a

CRYPTO market see that bottom go for long The total cryptocurrency market capitalization is now testing a critical technical confluence, positioned at both a multi-week channel support and a significant historical demand zone. Following the recent market correction, this level represents a pivotal area where buyer interest has traditionally

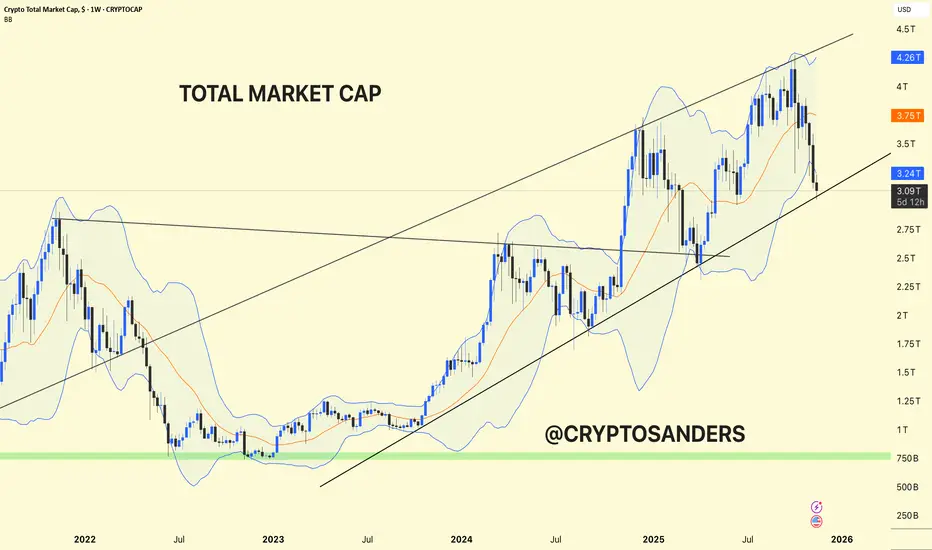
Crypto Total Market Cap. Crypto Total Market Cap – Weekly Chart Analysis & Full Update
The entire crypto market cap is trading within a large ascending channel, keeping the long-term uptrend intact.
Recent Action: After making new highs above $4 trillion, the market has corrected sharply, pulling back to the channel's l
Crypto Is a Zero Growth "Industry"Look at that, after 4 years, failure to fully sustain a new higher market valuation. All the while, stablecoin dominance has increased and ETFs have come into play. Instead, retail money is being extracted through fees and the profits garnered through trader liquidation. That's not a sign of growth.

See all ideas
Summarizing what the indicators are suggesting.
Oscillators
Neutral
SellBuy
Strong sellStrong buy
Strong sellSellNeutralBuyStrong buy
Oscillators
Neutral
SellBuy
Strong sellStrong buy
Strong sellSellNeutralBuyStrong buy
Summary
Neutral
SellBuy
Strong sellStrong buy
Strong sellSellNeutralBuyStrong buy
Summary
Neutral
SellBuy
Strong sellStrong buy
Strong sellSellNeutralBuyStrong buy
Summary
Neutral
SellBuy
Strong sellStrong buy
Strong sellSellNeutralBuyStrong buy
Moving Averages
Neutral
SellBuy
Strong sellStrong buy
Strong sellSellNeutralBuyStrong buy
Moving Averages
Neutral
SellBuy
Strong sellStrong buy
Strong sellSellNeutralBuyStrong buy
Displays a symbol's price movements over previous years to identify recurring trends.