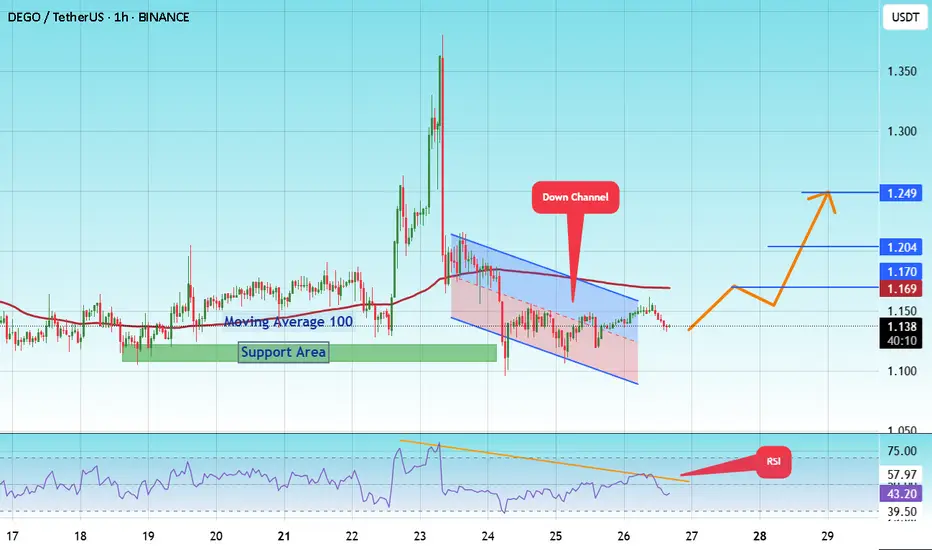
#DEGO/USDT Forming Bullish Wave#DEGO
The price is moving within a descending channel on the 1-hour frame and is expected to break and continue upward.
We have a trend to stabilize above the 100 moving average once again.
We have a downtrend on the RSI indicator that supports the upward break.
We have a support area at the low
Related pairs
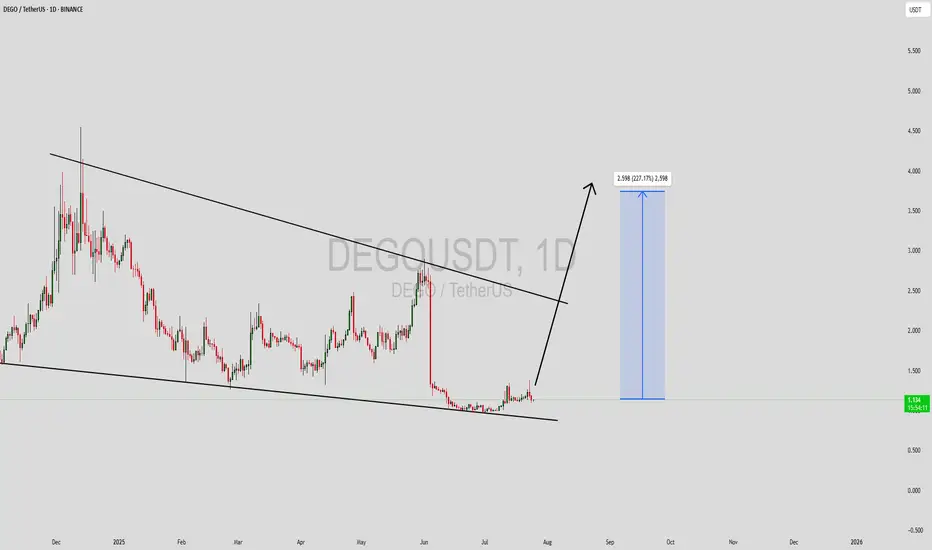
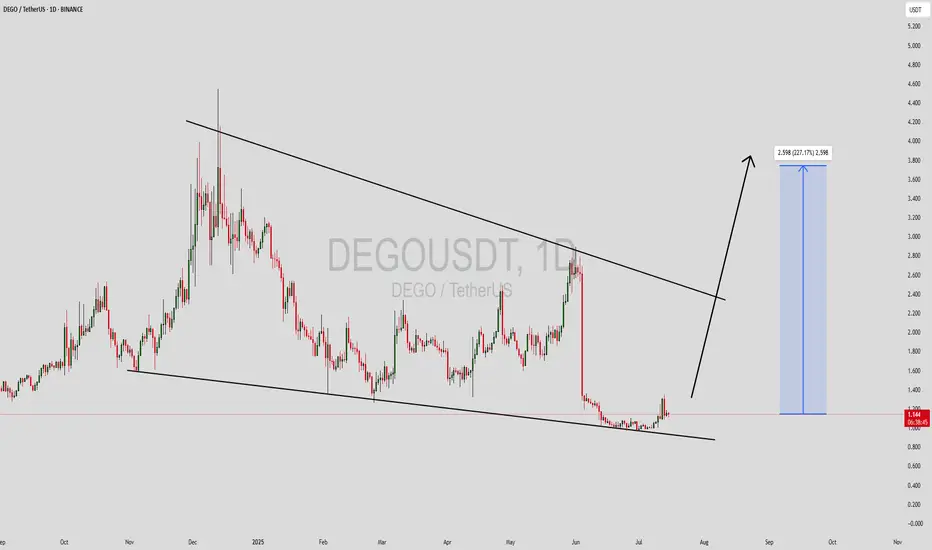
DEGOUSDT Forming Descending ChannelDEGOUSDT is currently showing signs of a strong bullish reversal setup after forming a well-defined descending channel pattern on the daily timeframe. Historically, descending channels are seen as bullish continuation or reversal patterns when price breaks above the upper trendline with increased vo
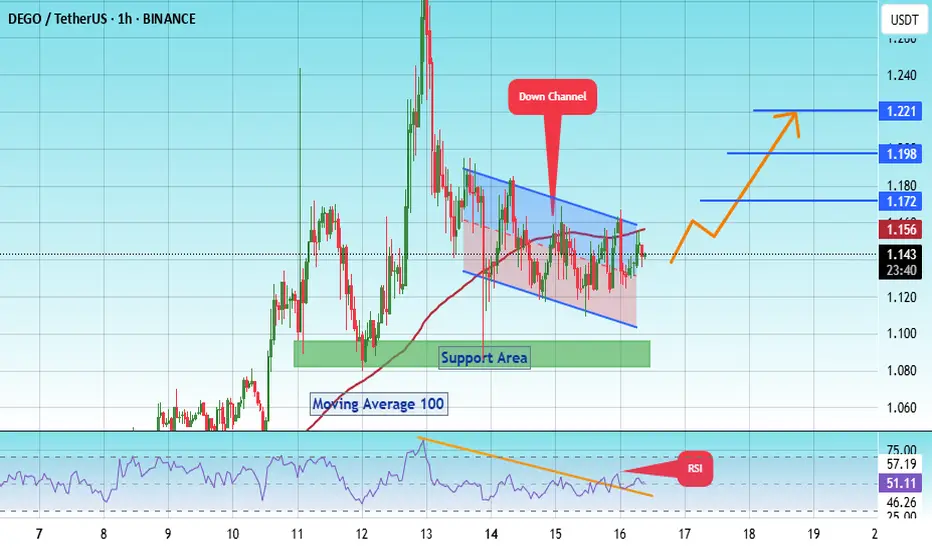
#DEGO/USDT – Bullish Breakout Setup | 1H Chart Analys#DEGO
The price is moving within a descending channel on the 1-hour frame, adhering well to it, and is heading for a strong breakout and retest.
We are experiencing a bounce from the lower boundary of the descending channel. This support is at 1.10.
We have a downtrend on the RSI indicator that i
DEGOUSDT Forming Bullish WaveDEGOUSDT is emerging as a strong contender for traders who are looking for high-potential altcoins with an impressive upside. The chart is currently forming a good bullish wave pattern, which is often a reliable signal for the start of a major uptrend. This setup, combined with steadily increasing t
#DEGO/USDT#DEGO
The price is moving within a descending channel on the 1-hour frame, adhering well to it, and is heading toward a strong breakout and retest.
We are experiencing a rebound from the lower boundary of the descending channel, which is support at 1.23.
We are experiencing a downtrend on the RSI

#DEGO/USDT#DEGO
The price is moving within a descending channel on the 1-hour frame, adhering well to it, and is heading towards a strong breakout and retest.
We are experiencing a rebound from the lower boundary of the descending channel, which is support at 1.04.
We are experiencing a downtrend on the RSI

#DEGO/USDT#DEGO
The price is moving within a descending channel on the 1-hour frame and is expected to break and continue upward.
We have a trend to stabilize above the 100 moving average once again.
We have a downtrend on the RSI indicator that supports the upward move with a breakout.
We have a support

DEGO/USDT – Bullish Rectangle Breakout Setup | 1H Chart AnalysisDEGO is currently exhibiting a bullish rectangle formation on the 1-hour chart, a pattern often indicative of continuation in an existing uptrend. The price has been consolidating between clearly defined horizontal support and resistance levels, and it's now approaching a breakout zone.
🔹 Entry Pr

DEGOUSDT 1D#DEGO is trading inside a symmetrical triangle on the daily chart. It has bounced off the triangle support and the daily MA100, which looks promising. In case of a breakout above the triangle resistance, the targets are:
🎯 $2.552
🎯 $2.933
🎯 $3.313
🎯 $3.854
⚠️ Use a tight stop-loss.

#DEGO/USDT#DEGO
The price is moving within a descending channel on the 1-hour frame and is expected to break and continue upward.
We have a trend to stabilize above the 100 moving average once again.
We have a downtrend on the RSI indicator that supports the upward move with a breakout.
We have a support

See all ideas
Summarizing what the indicators are suggesting.
Oscillators
Neutral
SellBuy
Strong sellStrong buy
Strong sellSellNeutralBuyStrong buy
Oscillators
Neutral
SellBuy
Strong sellStrong buy
Strong sellSellNeutralBuyStrong buy
Summary
Neutral
SellBuy
Strong sellStrong buy
Strong sellSellNeutralBuyStrong buy
Summary
Neutral
SellBuy
Strong sellStrong buy
Strong sellSellNeutralBuyStrong buy
Summary
Neutral
SellBuy
Strong sellStrong buy
Strong sellSellNeutralBuyStrong buy
Moving Averages
Neutral
SellBuy
Strong sellStrong buy
Strong sellSellNeutralBuyStrong buy
Moving Averages
Neutral
SellBuy
Strong sellStrong buy
Strong sellSellNeutralBuyStrong buy
Frequently Asked Questions
The current price of Dego Finance / Tether SPOT (DEGO) is 1.132 USDT — it has risen 0.97% in the past 24 hours. Try placing this info into the context by checking out what coins are also gaining and losing at the moment and seeing DEGO price chart.
Dego Finance / Tether SPOT price has risen by 10.50% over the last week, its month performance shows a 4.74% increase, and as for the last year, Dego Finance / Tether SPOT has decreased by −33.18%. See more dynamics on DEGO price chart.
Keep track of coins' changes with our Crypto Coins Heatmap.
Keep track of coins' changes with our Crypto Coins Heatmap.
Dego Finance / Tether SPOT (DEGO) reached its highest price on Jun 1, 2025 — it amounted to 2.888 USDT. Find more insights on the DEGO price chart.
See the list of crypto gainers and choose what best fits your strategy.
See the list of crypto gainers and choose what best fits your strategy.
Dego Finance / Tether SPOT (DEGO) reached the lowest price of 0.969 USDT on Jun 25, 2025. View more Dego Finance / Tether SPOT dynamics on the price chart.
See the list of crypto losers to find unexpected opportunities.
See the list of crypto losers to find unexpected opportunities.
The safest choice when buying DEGO is to go to a well-known crypto exchange. Some of the popular names are Binance, Coinbase, Kraken. But you'll have to find a reliable broker and create an account first. You can trade DEGO right from TradingView charts — just choose a broker and connect to your account.
Dego Finance / Tether SPOT (DEGO) is just as reliable as any other crypto asset — this corner of the world market is highly volatile. Today, for instance, Dego Finance / Tether SPOT is estimated as 28.44% volatile. The only thing it means is that you must prepare and examine all available information before making a decision. And if you're not sure about Dego Finance / Tether SPOT, you can find more inspiration in our curated watchlists.
You can discuss Dego Finance / Tether SPOT (DEGO) with other users in our public chats, Minds or in the comments to Ideas.