Dow Jones Wave Analysis – 15 October 2025
- Dow Jones reversed from support zone
- Likely to rise to resistance level 47000.00
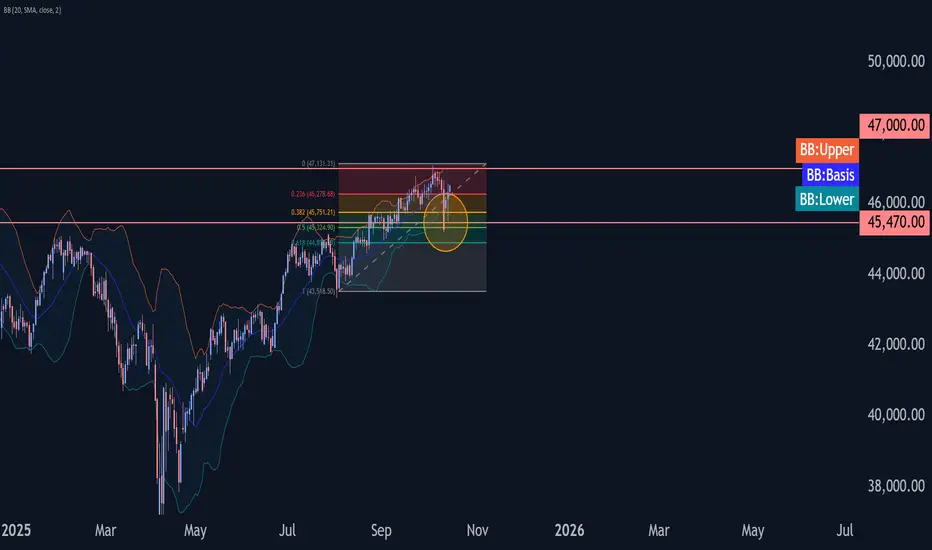
Dow Jones index recently reversed up from the support zone between the key support level 45470.00 (former resistance from August), lower daily Bollinger Band and the 38.2% Fibonacci correction of the upward impulse from August.
The upward reversal from this support zone created the daily reversal pattern Hammer, which stopped earlier correction ii.
Given the strong daily uptrend, Dow Jones index can be expected to rise further to the next resistance level 47000.00 (which stopped earlier impulse wave i).
Trade ideas
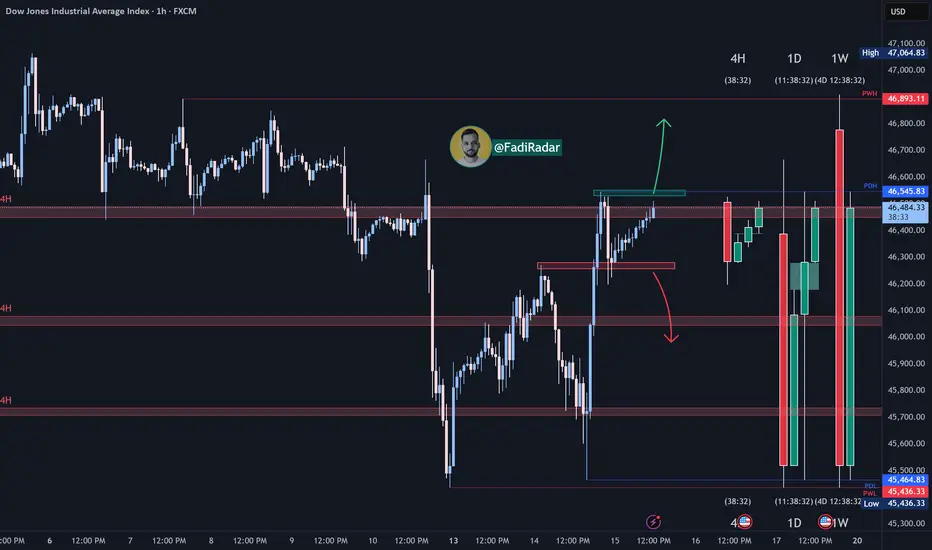
Dow Jones (US30) Analysis:The Dow Jones Index is heading toward a key resistance level at 46,550.
🔻 If the price rejects this level, it is likely to retrace back to test support at 46,250, and a break below this support could resume the bearish trend.
🔺 However, if the index breaks and holds above 46,550, this could push the price higher toward 46,700 as the first target.
📈 Best Buy Zone: After confirming a breakout above 46,550
📉 Best Sell Zone: On rejection from 46,550 or a confirmed break below 46,250
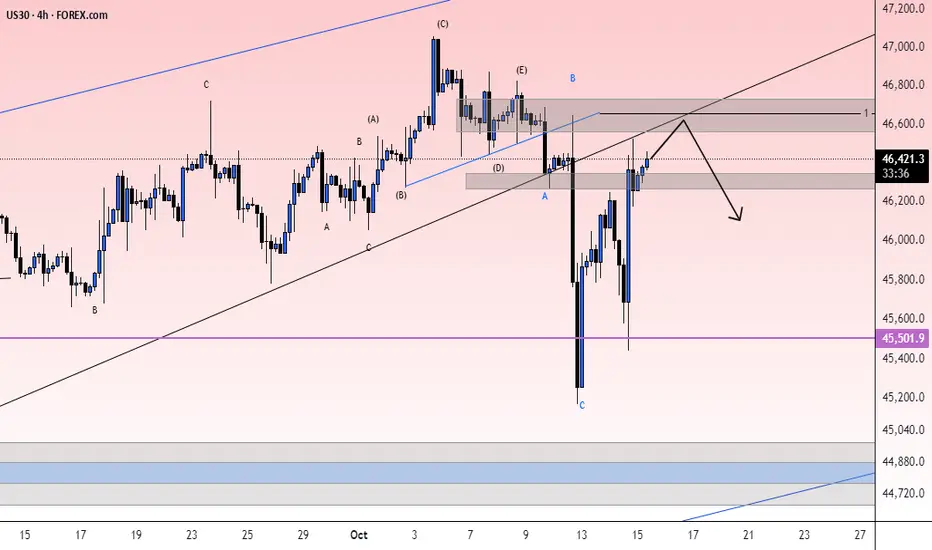
check the trendIt is expected that a trend change will form in the current resistance range and we will witness the beginning of a downward trend.
As long as the index does not stabilize above the resistance range, the continuation of the downward trend and correction will be likely.
US30 (Dow Jones) Trade UpdateTimeframe: 4-hour
Current Price: 46,385.40
Key Levels:
Resistance: 46,493 (watch for a breakout and retest for potential buy setups)
Support: 45,705.02 (watch for a breakdown and retest for potential sell setups)
Strategy:
If 46,493 is broken and price retests, I will look to add buy positions for a potential move higher, targeting resistance around 47,000.
If price fails to break above this level and breaks support at 45,705.02, I will look for sell setups on the retest, targeting lower support levels around 45,210.

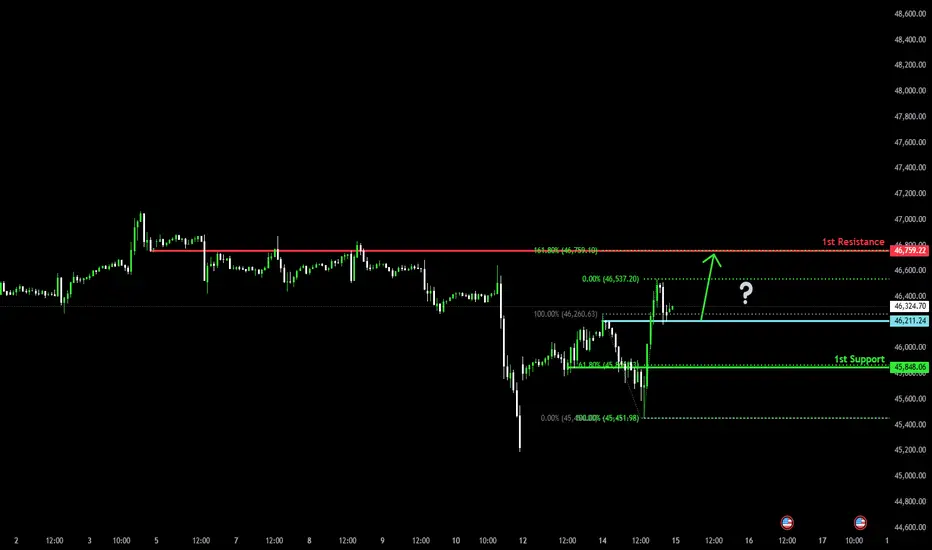
Bullish momentum to extend?Dow Jones (US30) is reacting off the pivot, which acts as a pullback support and could rise to the 1st resistance that aligns with the 161.8% Fibonacci extension.
Pivot: 46,211.24
1st Support: 45,848.06
1st Resistance: 45,759.22
Disclaimer:
The above opinions given constitute general market commentary, and do not constitute the opinion or advice of IC Markets or any form of personal or investment advice.
Any opinions, news, research, analyses, prices, other information, or links to third-party sites contained on this website are provided on an "as-is" basis, are intended only to be informative, is not an advice nor a recommendation, nor research, or a record of our trading prices, or an offer of, or solicitation for a transaction in any financial instrument and thus should not be treated as such. The information provided does not involve any specific investment objectives, financial situation and needs of any specific person who may receive it. Please be aware, that past performance is not a reliable indicator of future performance and/or results. Past Performance or Forward-looking scenarios based upon the reasonable beliefs of the third-party provider are not a guarantee of future performance. Actual results may differ materially from those anticipated in forward-looking or past performance statements. IC Markets makes no representation or warranty and assumes no liability as to the accuracy or completeness of the information provided, nor any loss arising from any investment based on a recommendation, forecast or any information supplied by any third-party.
MARKET RECAP-FED CHAIR POWELL SPEAKS_DOW JONES_RF+NEWS10-14-25-News-Daily Recap-Market opened up on Sunday 12, 2025. Market gapped. initally expecting gap to fill later in the week. But the market filled gap Tuesday 10/14/25/ Traded to the buyside, into higher timeframe (Daily) small FVG. Expecting some sell off, then retracement higher. News Thursday Core PPI.

Dow Jones Returns to the 46,000 Level Since the beginning of the week, the Dow Jones Index has maintained a notable bullish bias, extending a two-day winning streak as the equity benchmark posts a gain of around 2.20% in the short term. For now, buying pressure has supported the price recovery following the sharp correction seen last Friday, which was triggered by the escalation of trade tensions between China and the United States.
Although no major trade agreement has been announced, the aggressive tone of the tariff threats appears to have eased slightly, helping the market regain confidence in the short term. However, it’s important to note that if tensions escalate again, the Dow Jones could once more show heightened sensitivity to such developments, quickly reactivating selling pressure in the coming trading sessions.
Uptrend at Risk
The uptrend line, which had been sustained through much of 2025, has started to weaken following last Friday’s sharp correction. As a result, the average bullish momentum has entered a neutral zone in the short term. Currently, there is a recovery attempt from the previous downward move, though it has not yet been strong enough to bring prices back to recent highs.
If buying pressure fails to remain decisive over the next few sessions, a period of market indecision could emerge, potentially leading to a sideways range in the short term.
RSI
The RSI line continues to hover around the 50 level, reflecting a neutral momentum over the past 14 sessions. As long as the indicator stays within this range, neutrality may dominate the market bias, leading to indecisive price movements in the coming days.
MACD
The MACD histogram also remains near the neutral (0) level, indicating that there is no clear directional strength in short-term moving averages. This reinforces the idea of indecision in the market, suggesting that the price action may remain range-bound without a defined trend in the near term.
Key Levels to Watch:
46,790 points – Major Resistance: Corresponds to the all-time high area of the index. Buying activity approaching or surpassing this level could reactivate the bullish trend and establish a dominant buying bias.
45,741 points – Near-Term Barrier: Aligns with the 50-period simple moving average. As long as prices continue to fluctuate around this level, a new short-term consolidation range could form.
44,834 points – Critical Support: Represents the most stable neutral zone in recent weeks and coincides with the Ichimoku cloud boundary in the short term. A decisive break below this level could trigger a stronger bearish bias, putting the year-long uptrend at risk and potentially signaling the start of a new downward phase in the short term.
Written by Julian Pineda, CFA – Market Analyst

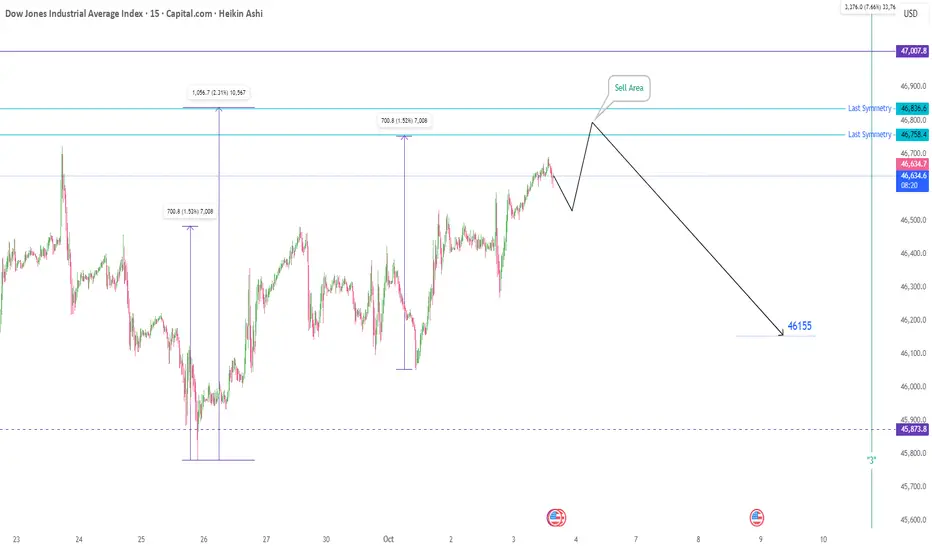
Us30 in FridayToday is Friday, the last trading day of the week. Despite the absence of major economic news releases, the following forecast for the Dow Jones Index is highly probable.
Upon market open and with an increase in trading volume, we anticipate an upward move. After registering a new price high, the index is expected to decline to approximately the 46,160 level.
Entering short positions within the specified target zone presents a favorable opportunity to capture profits. May it be profitable.
Please note: This is solely a trading idea. The responsibility for any trading decision rests entirely with the individual.
Breaks Above 46,400.00 as Bulls Extend RecoveryUS30 has pushed decisively above 46,400.00, confirming strong buyer momentum after last week’s deep correction. This breakout shifts short-term sentiment firmly bullish, with price now eyeing the next resistance at 46,809.40.
Support at: 46,400.00 🔽 46,150.00 🔽
Resistance at: 46,809.40 🔼 47,000.00 🔼
🔎 Bias:
🔼 Bullish: Momentum remains with buyers while price holds above 46,400.00. A sustained move could target 46,809.40, and a break above that opens the path to 47,000.00.
🔽 Bearish: Only a drop back below 46,400.00 would weaken the current momentum and expose 46,150.00 as the next test for buyers.
📛 Disclaimer: This is not financial advice. Trade at your own risk.


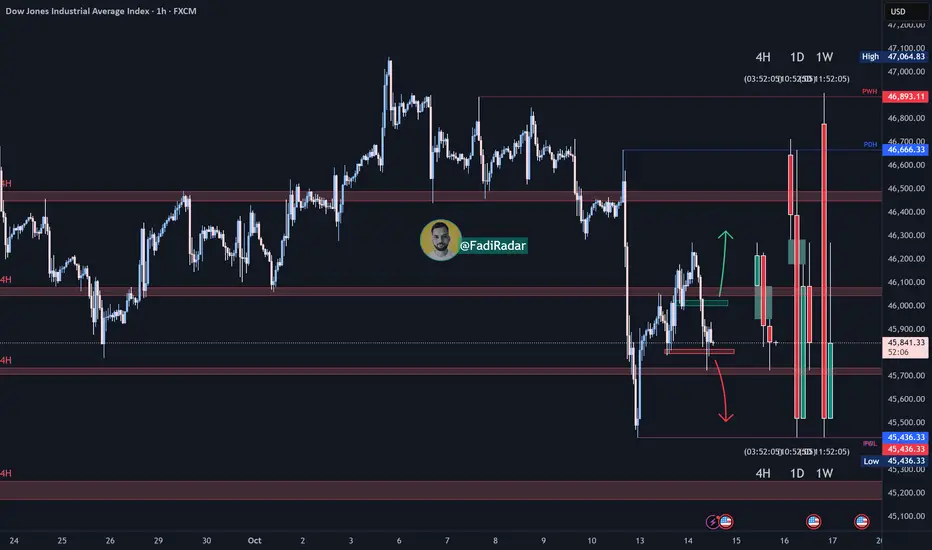
Us30 Trade Set Up Oct 14 2025Price has swept both PDH and PDL and has formed a bearish 4h FVG, so i will be trading with the bearish trend looking for sells after London highs get swept as liquidity and look for a 1m IFVG/CISD to target swing lows

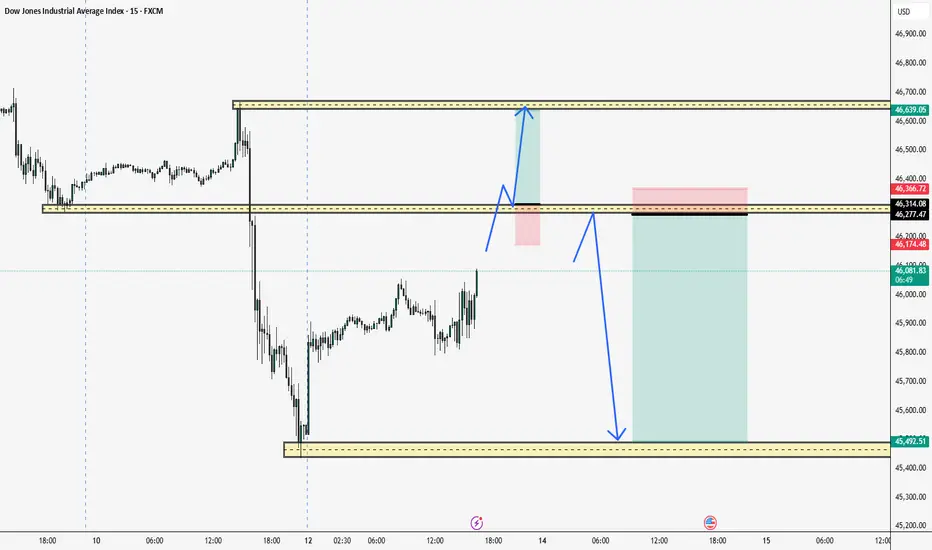
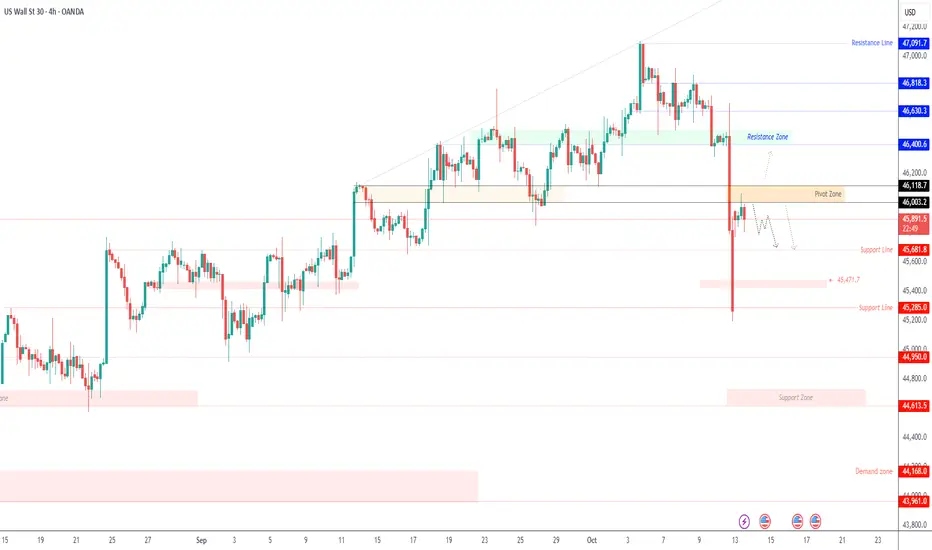
US30 / Overview | Bearish Pressure Below 46,000US30 – Overview | Bearish Momentum
The price retested its resistance zone and then reversed into bearish momentum.
As long as the index trades below 46,000, the bearish trend is expected to continue toward 45,690, and a 1H close below this level would extend losses toward 45,470.
To shift into a bullish trend, price must close a 1H candle above 46,000, which would open the way toward 46,120 → 46,250.
Pivot: 46,000
Support: 45,680 – 45,470 – 45,280
Resistance: 46,120 – 46,250 – 46,400

DowJones trend change? Key resistance zone at 46262Key Support and Resistance Levels
Resistance Level 1: 46262
Resistance Level 2: 46476
Resistance Level 3: 46700
Support Level 1: 45433
Support Level 2: 45253
Support Level 3: 45025
This communication is for informational purposes only and should not be viewed as any form of recommendation as to a particular course of action or as investment advice. It is not intended as an offer or solicitation for the purchase or sale of any financial instrument or as an official confirmation of any transaction. Opinions, estimates and assumptions expressed herein are made as of the date of this communication and are subject to change without notice. This communication has been prepared based upon information, including market prices, data and other information, believed to be reliable; however, Trade Nation does not warrant its completeness or accuracy. All market prices and market data contained in or attached to this communication are indicative and subject to change without notice.

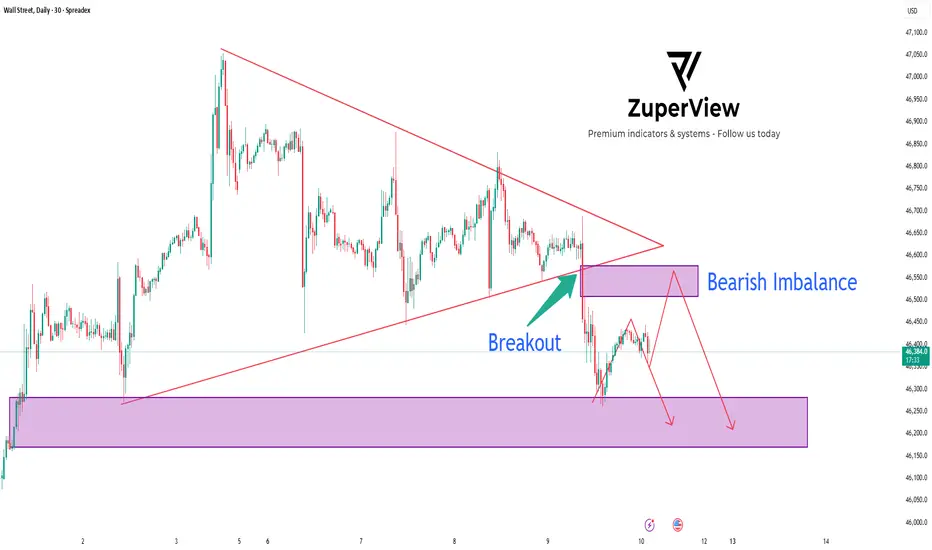
US30: Triangle breakout signal deeper sell move
📉 US30 Analysis: 4-Layer Resistance, Bearish Imbalance & Triangle Breakout | TradingView
The SPREADEX:DJI just printed a clean bearish breakout from a symmetrical triangle pattern on the 30-minute chart 🕒.
What makes this setup stand out is the 4-layer resistance zone perfectly overlapping with a Bearish Imbalance, creating a strong confluence for a potential continuation to the downside.
________________________________________
🧠 Technical Overview
On TradingView, the chart shows multiple lower highs forming inside a symmetrical triangle — a sign of buying exhaustion and seller accumulation. After several attempts, price finally broke below the structure, confirming a bearish market shift.
Key zones:
🔴 4-Layer Resistance: 46,850 → 46,550
⚫ Bearish Imbalance: 46,500 – 46,550
🟣 Demand Zone / Support: 46,150 – 46,250
Each resistance layer acted as a rejection point, showing how Smart Money continues to distribute orders and defend that area aggressively.
________________________________________
📊 Breakout – Retest – Continuation Setup
Following the breakout, price made a quick pullback to retest the 4-layer resistance zone — right where the Bearish Imbalance sits.
This is a textbook Breakout–Retest–Continuation pattern on TradingView, confirming that sellers are still in control.
1️⃣ Breakout: Price breaks below the triangle.
2️⃣ Retest: Price retraces to test the 4-layer resistance and imbalance.
3️⃣ Continuation: Strong rejection signals the next bearish leg.
________________________________________
💡 Trading Plan
Our trading plan for this setup is straightforward. I’m waiting for price to retest the 46,500–46,550 zone and show clear signs of rejection — such as a bearish engulfing candle or a break of structure on lower timeframes.
If confirmed, I’ll look to enter a short position targeting the Demand Zone around 46,150–46,250.
A stop loss would be placed just above 46,650, beyond the resistance cluster, to protect against false breakouts.
This plan aligns perfectly with Smart Money Concept (SMC) and Price Action trading, offering a strong risk-to-reward ratio 📈.
________________________________________
🧩 Market Psychology
✅ The four consecutive rejections at the same price zone clearly show how institutional traders are defending supply levels.
✅ Every time price pushes higher, Smart Money sells into liquidity, leaving wicks and imbalances behind.
✅ This behavior reinforces the bearish bias and supports the idea of a continued drop once short-term liquidity is collected.
________________________________________
🔎 Summary
✅ Bearish breakout confirmed from the triangle pattern
🔴 Strong 4-layer resistance overlapping with Bearish Imbalance
📉 Expecting price to continue toward the lower Demand Zone
This setup is clean, confluence-rich, and ideal for traders using TradingView, Price Action, and Smart Money Concepts.
A well-timed short from this zone could deliver a high-probability trade with excellent structure confirmation 🔥.
Please like and comment below to support our traders. Your reactions will motivate us to do more analysis in the future 🙏✨
Harry Andrew @ ZuperView
Dow Jones (US30) Analysis:The Dow Jones index is seeing a decline today, currently trading near the support zone at 45,800.
🔻 If 45,800 breaks and holds below, the price is likely to retest the previous low at 45,430.
🔺 However, if the index rebounds from the current support zone, it may rise toward 46,000 initially, and a breakout above this resistance could push it further to 46,300.
📉 Best Sell Zone: Below 45,800 (after confirmation)
📈 Best Buy Zone: Upon rebound from 45,430
US30Seeing Bullish opportunity on US30.
The market has presented buy bias based on support & resistance strat.

US30 H4 | Bullish RiseDow Jones (US30) has reacted off the buy entry at 45,831.82, which is a pullback support and oculd potentially rise from this level to the take profit.
Stop loss is at 45,441.31, which is a pullback support.
Take profit is at 46,530.01, which is an overlap resistance.
High Risk Investment Warning
Trading Forex/CFDs on margin carries a high level of risk and may not be suitable for all investors. Leverage can work against you.
Stratos Markets Limited (tradu.com ):
CFDs are complex instruments and come with a high risk of losing money rapidly due to leverage. 65% of retail investor accounts lose money when trading CFDs with this provider. You should consider whether you understand how CFDs work and whether you can afford to take the high risk of losing your money.
Stratos Europe Ltd (tradu.com ):
CFDs are complex instruments and come with a high risk of losing money rapidly due to leverage. 66% of retail investor accounts lose money when trading CFDs with this provider. You should consider whether you understand how CFDs work and whether you can afford to take the high risk of losing your money.
Stratos Global LLC (tradu.com ):
Losses can exceed deposits.
Please be advised that the information presented on TradingView is provided to Tradu (‘Company’, ‘we’) by a third-party provider (‘TFA Global Pte Ltd’). Please be reminded that you are solely responsible for the trading decisions on your account. There is a very high degree of risk involved in trading. Any information and/or content is intended entirely for research, educational and informational purposes only and does not constitute investment or consultation advice or investment strategy. The information is not tailored to the investment needs of any specific person and therefore does not involve a consideration of any of the investment objectives, financial situation or needs of any viewer that may receive it. Kindly also note that past performance is not a reliable indicator of future results. Actual results may differ materially from those anticipated in forward-looking or past performance statements. We assume no liability as to the accuracy or completeness of any of the information and/or content provided herein and the Company cannot be held responsible for any omission, mistake nor for any loss or damage including without limitation to any loss of profit which may arise from reliance on any information supplied by TFA Global Pte Ltd.
The speaker(s) is neither an employee, agent nor representative of Tradu and is therefore acting independently. The opinions given are their own, constitute general market commentary, and do not constitute the opinion or advice of Tradu or any form of personal or investment advice. Tradu neither endorses nor guarantees offerings of third-party speakers, nor is Tradu responsible for the content, veracity or opinions of third-party speakers, presenters or participants.

Us30 Bearish forminglets see if Us30 resists our recent low.. After all its thr third day US Goverment shutdown.

Us30 Trade Set Up Oct 13 2025Overall price is still bearish but today i can see price sweeping SSL, touching 50% of the 1h Gap and targeting the 4h FVG before continuing its bearish trend

US30 - Futures Rebound as Trump Calms U.S.–China Trade TensionsUS30 – Overview | Futures Rise as Trump Softens Tone on China
U.S. stock index futures advanced Monday, recovering from Friday’s pullback, as investors shifted back to risk assets following President Donald Trump’s softer stance on China.
Trump signaled a more measured approach, easing concerns over trade escalation after previously announcing steep tariffs and export restrictions tied to rare earth controls.
Market sentiment improved modestly, though caution remains as investors await further clarity on policy direction and upcoming U.S. data.
Technical Outlook
The Dow Jones maintains a bearish bias while trading below the pivot zone at 46,000.
As long as the price holds under this level, momentum favors downside toward 45,680 → 45,470, with increased pressure if a 1H candle closes below 45,680.
A 1H close above 46,120 would shift sentiment to bullish, targeting 46,400 → 46,630, potentially confirming a short-term reversal.
Pivot Line: 45,920
Resistance: 46,120 · 46,400 · 46,630
Support: 45,680 · 45,500 · 45,285
Summary:
US30 remains bearish below 46,000, with a possible retest of key supports at 45,680–45,470.
A break above 46,120 would invalidate the bearish view and open the way for a recovery toward 46,400.
US 30 POETENTIAL BULLISH RUNAfter setting a strong low on Friday, Dow Jones Industrial Average is likely to correct close to the rejection thus cueing for long entries. be on the lookout for those buys at around 45300. Buy stops at the current weekly high.

There is initial projected support for Monday at 45362 and 45154This channel is not providing individualized trading or investment advice, nor is it a banking service, brokerage service, trading service, investment service or money management service
