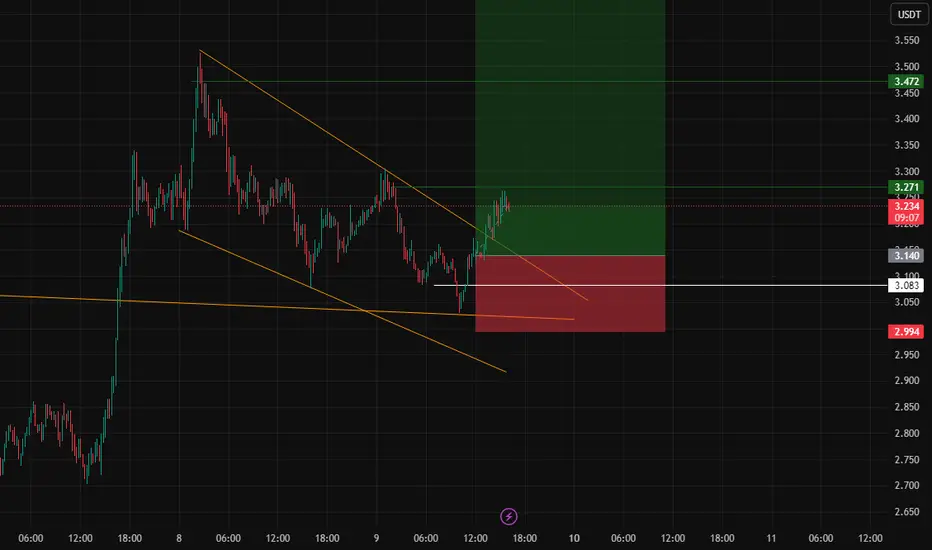
Polkadot (DOT): Seeing a Good Push/Pump To Happen Soon!DOT is sitting inside a key zone where we’re waiting for a clean BOS to confirm buyers are stepping in. Once that happens, the next objective becomes the unfilled zone above, left behind during the bigger dip on higher timeframes. Until then, we stay patient and watch the reaction here.
Swallow Academy
Trade ideas

DOTUSDT - inverted head and shoulders patternhi traders,
DOT is currently forming a bullish inverted head and shoulders pattern on the daily chart, suggesting a potential medium-term trend reversal to the upside.
Left Shoulder: Price declines and rebounds, creating the first swing low.
Head: A deeper sell-off forms the lowest point of the structure before buyers step back in.
Right Shoulder: Price is now developing the right shoulder, with higher lows indicating strengthening bullish momentum.
The neckline resistance sits slightly above the current price. A confirmed daily close above the neckline would complete the pattern and trigger a potential breakout.
The projected target, measured from the head to the neckline and extended upward from the breakout point, suggests an approximate 28% upside move, with the target area around 4.21 USDT.
The Stochastic RSI is currently in mid-range and curling upward, providing additional momentum support for a potential bullish breakout.
Trading Plan Considerations:
Entry: Upon a decisive breakout and daily close above the neckline.
Target: ~4.21 USDT (pattern completion target).
Invalidation: Breakdown below the right shoulder low would invalidate this setup.

DOT longFits my setup and had a bos and hh and looks strong compared to others alts. Happy taking a long here with clear SL. Great R/R.

DOTDOT has been in a long-term bearish trend for more than 2 years, with no clear signs of reversal.
The recent candle is a large red one, confirming increased selling pressure.
The price is sitting at the very bottom of the range, indicating weak buying interest.

DOT USDT SHORT SIGNAL---
📢 Trade Idea: DOT/USDT
Type: Short
Entry Price: 3.070
🎯 Take-Profit Targets:
• TP1 = 3.010
• TP2 = 2.863
• TP3 = 2.724
• TP4 = 2.597
• TP5 = 2.460
🛑 Stop-Loss: 3.173
⏱ Timeframe: 1H
⚖️ Risk/Reward Ratio: 6.3
💥 Suggested Leverage (if used): 5x–10x
---
Technical Analysis:
DOT is forming a clear bearish structure, with price failing to hold above the key resistance zone at 3.10–3.17.
A rejection from this level, combined with a lower-high formation and EMA crossover to the downside, confirms short momentum.
RSI also shows bearish divergence, signaling potential continuation toward the 2.86–2.60 range.
A clean break below 3.00 would validate further downside targets, with 2.46 as the extended goal.
---
Trade Management Tips:
• Consider partial profit-taking at each TP level.
• Move SL to entry once TP1 is hit.
• Setup invalid if price closes above 3.18 on 1H timeframe.
---
⚠️ Disclaimer:
This analysis is for educational purposes only and not financial advice.
Always DYOR and apply proper risk management before trading.
---
📌 Hashtags for visibility (TradingView SEO):
#DOTUSDT #Polkadot #CryptoTrading #ShortSetup #TechnicalAnalysis #TradingViewIdea #CryptoSignals
---

DOT USDT LONG SIGNAL---
📢 Signal – DOT/USDT
📈 Trade Type: LONG
💰 Entry:
2.722
🎯 Targets (with partial take-profit management):
TP1 = 2.767
TP2 = 2.824
TP3 = 2.894
TP4 = 2.956
TP5 = —
TP6 = —
🛑 Stop-Loss: 2.690
📊 Timeframe: —
⚖️ R/R: 8.36
📌 Suggested Leverage: 5× or 10×
⚠️ Risk management is mandatory — please check the chart before entering.
📌 Important Note on Risk Management:
✔️ Once price hits the first target (TP1), the Stop-Loss moves to the entry point.
This is a standard risk-management rule to protect capital.
❗ So it’s completely normal if sometimes the price reaches TP1, then pulls back and hits breakeven.
This is not a failed trade — it means the position closed with zero loss and zero risk.

DOT forming dual flag structure with supportDOT has formed a bullish flag on the global chart, and a similar pattern has formed more locally.
DOT's attempt to consolidate above the MA50 and MA200 was unsuccessful, but given these patterns, we are more likely to see a retest of them in the near future
Currently, we are at support at $2.668
A reversal and a breakout of the MA50 and MA200 resistance levels are more likely to occur
A move below the purple area will indicate a continuation of the downward movement
More detailed analysis, additional charts, and key levels to watch are available on our site

DOT USDT LONG SIGNAL---
📢 Signal Alert
🔹 Pair: DOT / USDT
📈 Trade Type: Long
💰 Entry Price: 3.082
🎯 Take-Profit Targets (Partial Management):
▫️ TP1 = 3.270
▫️ TP2 = 3.310
▫️ TP3 = 3.439
▫️ TP4 = 3.676
▫️ TP5 = 4.000
🛑 Stop-Loss: 2.850
📊 Timeframe: 1H
⚖️ Risk/Reward Ratio: 10.14
📌 Suggested Leverage: 5x – 10x
⚠️ Capital management is mandatory.
💬 Please review the chart before entering the trade.
---
🧠 Technical Analysis Summary:
DOT is forming a bullish continuation pattern above key support at 2.85–2.90, showing strong reaction and volume accumulation.
If price sustains above 3.08, a breakout toward 3.43–3.67 is likely.
RSI is turning upward from the mid-zone (≈50), suggesting renewed bullish momentum, and the EMA20 crossover supports a move to higher highs.
---
⚙️ Trade Management Tip:
• Take partial profits at TP1 and move stop-loss to Entry.
• Use a trailing stop after TP2 to lock in gains.
• Avoid re-entry if price closes below 2.85 on the 1H timeframe.
---
⚠️ Disclaimer:
This signal is for educational purposes only and not financial advice.
Always DYOR and apply strict risk management.
---

DOT USDT LONG SIGNAL📢 Signal Alert
🔹 Pair: DOT / USDT
📈Trade Type: Long
💰Entry Zone: 3.140 – 3.085
🎯 Take-Profit Targets (Partial Management):
▫️TP1 = 3.270
▫️TP2 = 3.470
▫️TP3 = 3.675
▫️TP4 = 4.000
🛑 Stop-Loss: 2.990
📊Timeframe: 15m
⚖️Risk/Reward Ratio: 6.35
📌Suggested Leverage: 5x – 10x
⚠️ Capital management is mandatory.
💬Please review the chart before entering the trade.
---
🧠 Technical Overview:
DOT is consolidating near a strong support zone.A hold above the 3.08-3.14 area could initiate a new upward impulse towards higher resistance levels. The exceptionally high Risk/Reward ratio suggests a favorable potential move if the support holds.
RSI is positioned for a potential bullish reversal, and a break above the local resistance could confirm strength for targets TP1 and beyond.
---
⚙️ Trade Management Tips:
· Take partial profit at TP1 and move SL to entry to secure risk-free exposure.
· Trail your stop-loss for the remaining positions as price progresses through TP2 and TP3.
· A decisive candle close below the 2.990 stop-loss level invalidates the bullish structure.
---
⚠️ Disclaimer:
This signal is for educational purposes only and not financial advice.
Always perform your own analysis and apply strict risk management.
---
DOT/Polkadot DropDOT is facing a supply zone (the green area), and the neckline (green) on the RSI has been broken. When the blue line breaks and the RSI pulls back to its broken neckline, that's one of the optimal entry points. This is because stop hunting is highly likely in supply and demand zones, I've drawn the probable path of movement. BINANCE:DOTUSDT

support and resistance in DOTUSDTyou can see the support and resistance levels of the dotusdt in the chart
Scalp Long – DOT💎 Scalp Long – DOT
Price has broken out of the downtrend, confirming a shift in short-term momentum. RSI is in the buying zone, and buying volume is increasing, signaling renewed strength. On the 1H timeframe, RSI has also broken out, reinforcing bullish sentiment.
🎯 Trade Setup:
→ TP: 2.976 | SL: 2.491 | RR: 1 : 2.77
Market structure and momentum align for a clean scalp long setup, favoring a continuation move following the breakout.

DOT USDT LONG SIGNAL📢 Signal Alert
🔹 Pair: DOT / USDT
📈 Trade Type: Long
💰 Entry Zone: 2.745– 2.700
🎯 Take-Profit Targets:
TP1 = 2.795
TP2 = 2.820
TP3 = 2.863
🛑 Stop-Loss: 2.69
📊 Timeframe: 1H
⚖️ Risk/Reward Ratio: 3.88
📌 Suggested Leverage: 5x–10x
🔄 After TP1 is reached, move Stop-Loss to Entry to secure profits.
🧠 Technical Analysis Explanation
DOT is forming a bullish structure with higher lows and is currently retesting the 2.70–2.71 support zone, which previously acted as a strong demand level. The price is holding above the EMA 50 on the 1H chart, confirming a short-term uptrend continuation.
RSI is recovering from the 50 zone, signaling renewed buying momentum. The entry range (2.756–2.700) provides an optimal setup for a continuation move toward 2.86 resistance, aligning with Fibonacci and price action confluence.
The stop-loss at 2.710 is well-placed below structural support, maintaining a solid R/R ratio of 3.88.
⚙️ Trade Management Tip: Wait for a bullish confirmation candle (e.g., 1H engulfing or strong bounce) before entering. Take partial profits at TP1, and move SL to entry afterward for optimal risk control.
---

$DOT (WEEKLY): this coin was BORN in 2021 to be DISTRIBUTED CRYPTOCAP:DOT - whole existance on this WEEKLY chart. Ugh.
Coclusion: it exists only to be DISTRIBUTED.
Peaked in the previous cycle, no signs of recovery ever since.
#dot2.0 was merely the last attempt to re-distribute a dying coin with terrible tokenomics.
This is not an argument, these are facts.
You can argue with Wyckoff Schematics if you want to.
💙👽

DOT - Up or Down?Afternoon fellow traders,
So, will UP or DOWN be the destine for Polkadot?
I gotta say, whole lotta ppl shorting thinking BTC will close that gap at 111k bucks give or take, but if that were to happen, I think we could just touch the support trendline and break up, now problem is, even if it breaks upwards, it could just fake it and come back down aggressively.
Anyway, regardless of the end result, theres money to be made both ways! Take advantage!
Trade thirsty, my friends!

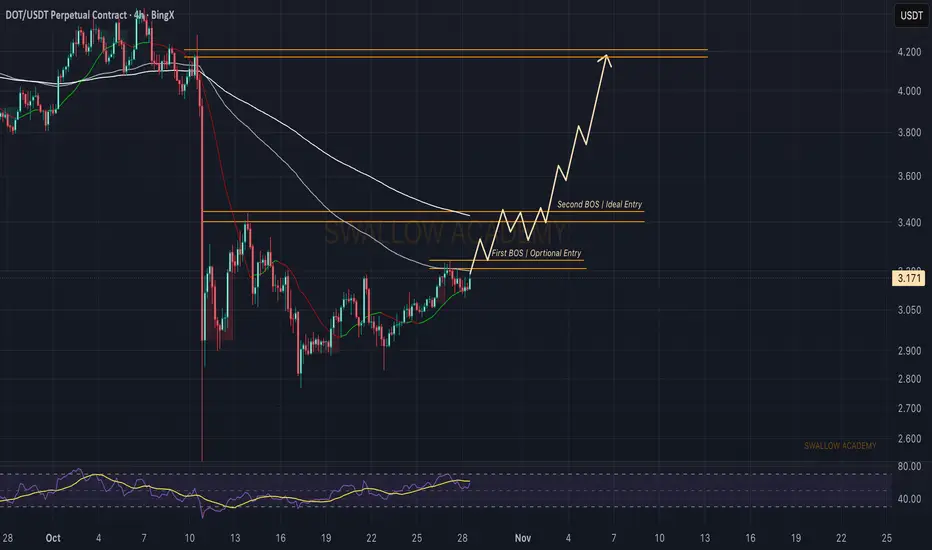
Polkadot (DOT): We Might Get Soon a Good R:R Setup!For DOT, we’re waiting for the first BOS to form — that would be the first step toward a possible upside movement. Once that happens, we’ll look for the second BOS as the main confirmation for the setup.
Good R:R trade can be taken here, but patience is key; we want to see structure shifts play out properly before going in.
Swallow Academy
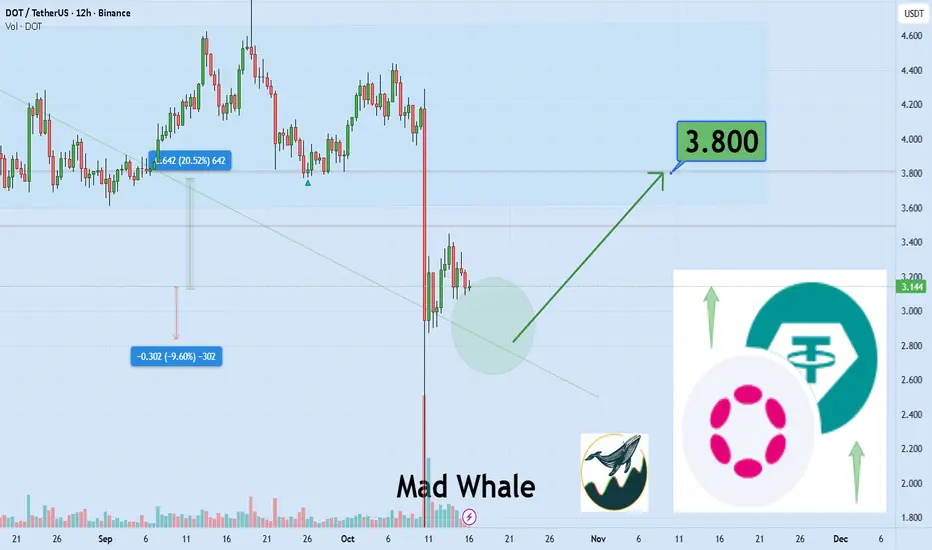
Dot can hit the upper targets if it holds the support areaHi the support and resistances on the chart are based on the previous data and weekly candlesticks if BINANCE:DOTUSDT holds this last support the potential of 20% gain is logical toward 3.80$
DOT : A 300% Opportunity with 2% RiskAlright, listen up, folks, this ain't no con, it's the real deal!
The DOT coin's pullin' off a textbook Wyckoff Spring pattern, and let me tell ya, it's a beaut!
We're talkin' 'bout a three-year accumulation phase—patience like that sets up somethin' big.
Right now, at $3.08, this is your shot, your golden ticket, and you don't wanna miss it. Set your stop-loss below $3 on a weekly candle close—yep, just a measly 2% risk. But the payoff? Oh, boy, the target’s sittin’ pretty at $10-$11. That’s a 300% gain, partner! And get this: the Wyckoff Spring pattern’s got a success rate hoverin’ around 75% when it’s this clean. So, you in, or you gonna sit there and watch the train leave the station?
BINANCE:DOTUSDT CRYPTOCAP:DOT COINBASE:DOTUSD BYBIT:DOTUSDT.P

$DOT (DAILY): LOWEST prices in 5 years, DEATH-SPIRALLING?CRYPTOCAP:DOT has started going into a DOWNSPIRAL due to poor adoption and terrible tokenomics.
The lowest prices since its launch in the previous crypto cycle, what else to add?
This project has built-in inflation of 8%+, daily emmissions of roughly 330k tokens, freshly minted, entering circulation every day.
Nobody wants it, nobody needs it, that's the realest truth, and I know how many die-hard fans and holders it's got. This coin should not be valued in billions ($4.7B market-cap).
Too late for this wreck to do anything, it's destined for sub-dollar prices in the coming years.
In Q4, even if it gets lucky and ends up rallying a bit due to a wider market run... I see no coming back, and nothing positive to say about the DAILY chart, either.
Very weak bounce, below all lows and support levels, that's just illustrates clearly how bad the fundamentals are for this project this year. 👽💙
#Dot #bearmarket #coin

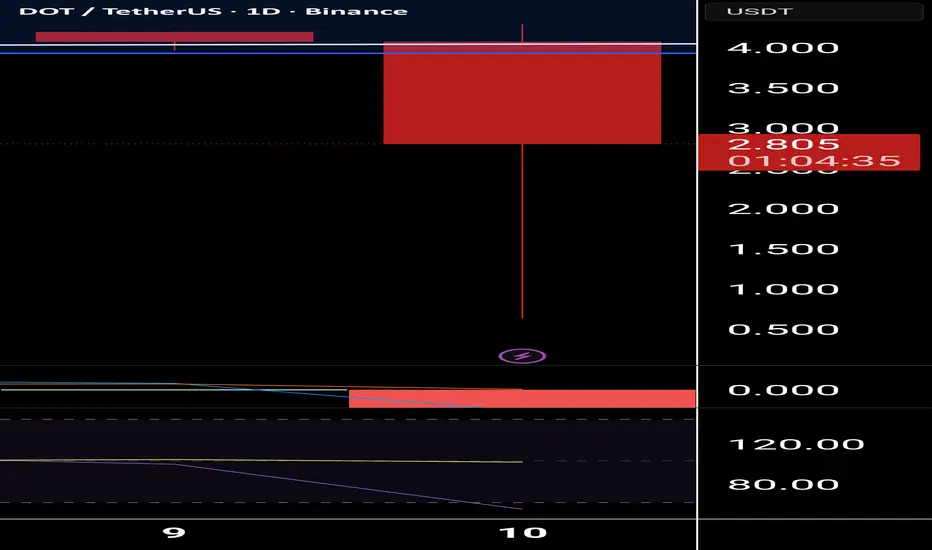
$DOT Technical Analysis And Price forecast: DOT could fall to 2.DOT dropped to 0.6$ during the crash last week, and now DOT is showing bearish momentum, 3.5$ was previously reacting as a key support level and now it is reacting as resistance the DOT has faced rejection from this price.
At the time of writing this on Saturday DOT is trading at 2.92$ making lower lows and lower highs indicating short term bearish momentum.
The next key psychological support level is 2.55$-2.60$, CRYPTOCAP:DOT Could retest this support.
The price sentiments for Dot are bearish until it will not make a day close above 3.5$.
Relative strength Index RSI is at little higher from the over sold level indicating strong bearish momentum. Moving Average Convergence Divergence MACD is also showing higher selling pressure in DOT.
#Polkadot

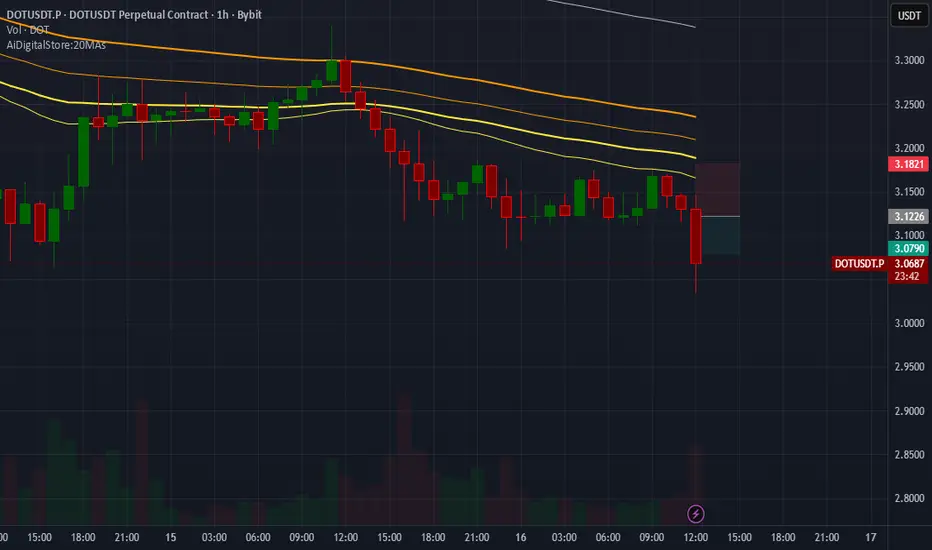
DOTUSDT.P SHORTDOTUSDT.P SHORT
The market has the potential for an downtrend
Price: 3.1226 $
Main target 3.0790 $
SL 3.1821 $
Dot What just happened? Does anyone know what just happened?
Also could either be the start of the Bull run for this coin or its demise? Be safe guys, I just lost a lot on this one, At the moment.
$DOT WEEKLY CHART UPDATE #DOT is showing a strong long-term CRYPTOCAP:DOT WEEKLY CHART UPDATE
CRYPTOCAP:DOT is showing a strong long-term accumulation pattern around the $3-4 zone. This level has acted as a solid historical support since 2022. If it holds, we could see a major reversal ahead with potential upside targets around $10–$20 by 2026.
The structure looks bullish, and early accumulation here could pay off big in the next cycle. 🚀
