DOT – Bullish Reversal on 4H | Inverse Head & Shoulders in Play#Polkadot (#DOT) is showing a strong bullish reversal signal on the 4-hour timeframe, where the price is developing a clean Inverse Head & Shoulders pattern.
Currently, #DOT is forming the right shoulder, indicating that buyers are stepping in and market structure is shifting toward the upside.
Key Highlights
Inverse H&S pattern active on 4H
Right shoulder formation underway
Breakout expected above the neckline + resistance zone
High-probability setup for a trend reversal
Focus on confirmation, not anticipation
Trading Plan
I will wait for:
Breakout above the neckline/resistance
Successful retest with bullish confirmation
Long entry with strict risk management
Targets will be based on measured move of the pattern and key supply zones.
Risk Management
Always trade with:
Stop-loss below the right shoulder
Strict position sizing
Market structure validation
What do you think?
Do you expect #DOT to break out or reject the neckline?
Share your thoughts in the comments!
If you found this helpful, like, follow, and comment for more high-probability setups on BTC, ALTCOINS, FOREX & Indices.
#DOT #Polkadot #Crypto #Altcoins #InverseHeadAndShoulders #ChartPattern #CryptoTrading #TechnicalAnalysis #4HChart #BullishReversal #PriceAction #TradingStrategy #LongSetup #BreakoutTrading
Trade ideas

POLKADOT ($DOT) Polkadot (DOT) Weekly Chart (1W) Technical Analysis
Examining the Polkadot (DOT) weekly chart, we can see that the asset is at a highly critical and historic juncture. From the perspective of a technical analyst, let's detail this chart regarding market cycle, critical support/resistance levels, and trend structure.
1. General Market Structure and Cycle Analysis
The chart clearly illustrates a classic "Boom and Bust" cycle.
Full Cycle Reset: The price has returned to the exact starting point of the massive bull run that began in late 2020 (approximately $1.98). This means the price action of the last 5 years has been effectively erased, returning the market to "ground zero."
Trend Outlook: The main structure is currently dominated by a Bear Market. The major ascending trendline (dashed line) was broken in early 2022, and the price has remained suppressed below this trend ever since.
2. Critical Price Levels
The most significant technical zones on the chart are as follows:
🟢 Major Support: $1.98 - $2.00 Zone (The "Kiss of Life")
This region is the "Make or Break" level for DOT.
Historical Significance: This is where the historic rally of 2020 originated. Returning to this level suggests we may be at a point of total seller exhaustion (capitulation).
Technical Expectation: A strong reaction/bounce from this level is technically highly probable. However, weekly closes below this level would drag the price into "price discovery" to the downside (unknown territory).
🔴 Major Resistance: $10.67 (Red Line)
Marked as "$10" on the chart, this is the most critical resistance barrier.
Price attempted to breach this level in 2022, 2023, and 2024, but was rejected every single time (as indicated by the red down arrows).
It is technically impossible to speak of a new bull trend until this level is decisively reclaimed.
⚠️ Intermediate Resistance and Broken Trendline
Broken Ascending Trend: The dashed black line now acts as strong diagonal resistance. Every bullish attempt hits this line or horizontal resistance and retraces.
Intermediate Targets: In a potential reversal, the $4.50 - $5.00 band would likely act as the first intermediate resistance.
3. Technical Formation and Interpretation
Round Trip (Cycle Completion): The drop from $55 levels back to $2 indicates a massive cycle completion. Usually, the end of such large drops is followed by a prolonged "Horizontal Accumulation" phase.
Triple Top / Rejection: The multiple rejections at the $10 level (seen around 2024) prove there is a significant supply (seller) block in that region.
4. Investor Strategy and Scenarios
As a market analyst, two main scenarios can be constructed based on this chart:
Scenario A: "Bottom Fishing" (Bullish Reversal)
Thesis: Price is at historic support ($1.98). The Risk/Reward (R/R) ratio is at its most attractive point for buyers.
Strategy: Gradual accumulation can be attempted in the $1.98 - $2.10 range, with a stop-loss strictly placed below $1.80.
Target: The first reaction target is the $4-5 band. Long term, the +$10 limit could be tested again. And Maybe old ATH = 50$

DOT USDT LONG SIGNAL---
📢 Official Trade Signal – DOT/USDT
📈 Position Type: LONG
💰 Entry Price: 2.179 (Limit Order)
---
🎯 Take-Profit Targets (Partial Exits):
• TP1: 2.218
• TP2: 2.248
• TP3: 2.300
• TP4: 2.393
• TP5: —
---
🛑 Stop-Loss: 2.084
📊 Timeframe: 15m
⚖️ Risk/Reward Ratio: ≈ 2.25 (based on TP4)
💥 Suggested Leverage: 3× – 5×
---
🧠 Technical Analysis Summary
DOT shows potential bullish momentum after stabilizing near a key support zone around 2.179.
A successful break above immediate resistance could trigger a move toward higher timeframe liquidity areas.
The 15m chart structure suggests a possible shift upward, with clear targets aligned with previous swing highs and orderbook liquidity levels.
Critical upside targets:
2.218 → 2.248 → 2.300 → 2.393
A sustained move above TP1 (2.218) may accelerate momentum toward 2.300 and 2.393.
---
⚙️ Trade Management Rules
✔ Take partial profit at each TP level
✔ Move stop-loss to entry point once TP1 is reached
✔ Trail stop-loss as price progresses toward higher targets
✔ No re-entry if stop-loss (2.084) is triggered
✔ Confirm bullish structure on 15m chart before entering
---
📌 TradingView Hashtags
#DOTUSDT #DOT #CryptoSignal #LongTrade
#TradingView #FuturesTrading #TechnicalAnalysis
---
Let me know if you would like this translated to Persian or adjusted in any way.


Polkadot (DOT): Looking For Bullish Movement | Unfilled ZoneDOT is holding the smaller support zone well, and that’s exactly where the first bullish signs started to form. The tap into that zone got picked up quickly, showing buyers are willing to react there, which is why the long makes sense from this area.
What we need next is a clean reclaim of the short-term resistance above. That’s the confirmation that opens the move toward the unfilled zone higher.
Until that breakout, the idea stays the same — buyers are trying to build momentum from this support, and the structure is slowly shifting in their favour.
Swallow Academy

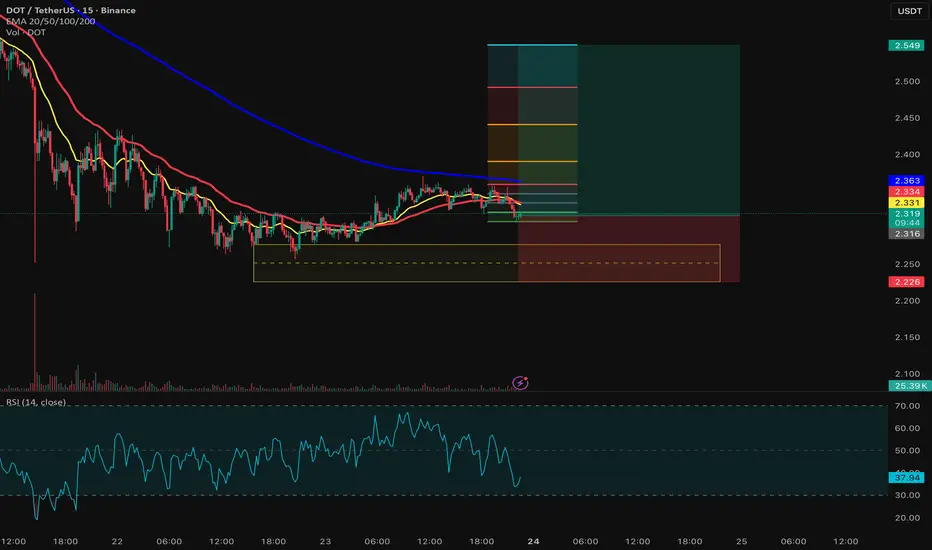
#DOT/USDT :BUY LOW#DOT
The price is moving within an ascending channel on the 1-hour timeframe and is adhering to it well. It is poised to break out strongly and retest the channel.
We have a downtrend line on the RSI indicator that is about to break and retest, which supports the upward move.
There is a key support zone in green at the price of 2.22, representing a strong support point.
We have a trend to stabilize above the 100-period moving average.
Entry price: 2.27
First target: 2.33
Second target: 2.41
Third target: 2.51
Don't forget a simple money management rule:
Place your stop-loss order below the support zone in green.
Once the first target is reached, save some money and then change your stop-loss order to an entry order.
For any questions, please leave a comment.
Thank you.

POLKADOT – LONG SETUP - LOADING SHORT SQUEEZE POTENTIALTraders,
$Polkadot is close to forming a high probability long setup, but it is not confirmed yet.
Here is the compact breakdown.
WHY DOT IS SETTING UP
Since 08 November price has been grinding down
Spot CVD, Coin Margined CVD and Stablecoin Margined CVD all fell with price which confirms real sell pressure
On 21 November the lows were swept
Today price tapped 2.220, the pivot level, and reacted
But we are still trading below 2.250, which means the squeeze setup is not active yet
Why the sweep matters
On Bybit around 915k Coin Margined short contracts opened into the low.
Coin Margined shorts use DOT as collateral which means when DOT rises they take a double hit.
The short loses value and their collateral also loses value.
This makes them far easier to liquidate once price reverses.
But price must reclaim the key level to trigger this effect.
THE KEY LEVELS
2.220 = the pivot
This is where price reacted
This is the 1.113 extension of the 04 November to 08 November move
This marks the completion of the downside rotation
2.250 = the trigger
This is the level price must reclaim and trade above
Above 2.250 shorts begin to go underwater
Above 2.250 the squeeze becomes active
Until $Polkadot trades above 2.250 the setup remains unconfirmed.
GAMEPLAN
Wait for two 30 minute candle closes above 2.250
This confirms the reclaim and activates the long setup
Look for a retest of the 2.240 to 2.250 zone
If buyers defend that retest it is the clean entry
As long as DOT stays below 2.250 this is only a potential setup
Falling back under 2.200 weakens the idea and requires reassessment
TARGETS IF CONFIRMED
If $Polkadot reclaims 2.250 the upside targets are:
3.675
3.877
4.063
4.327
Each level is a point to reassess momentum and structure.
FINAL VIEW
DOT swept the lows and trapped a large block of Coin Margined shorts.
The pivot at 2.220 has been touched, but the real trigger is 2.250.
Only once price reclaims and trades above 2.250 does the squeeze structure become active.
Until then it remains a potential high probability setup that requires confirmation.
Until the candles speak again,
ThetaNomad
-----------
If this helped you read the flow, drop a like and a comment
None of this is financial advice

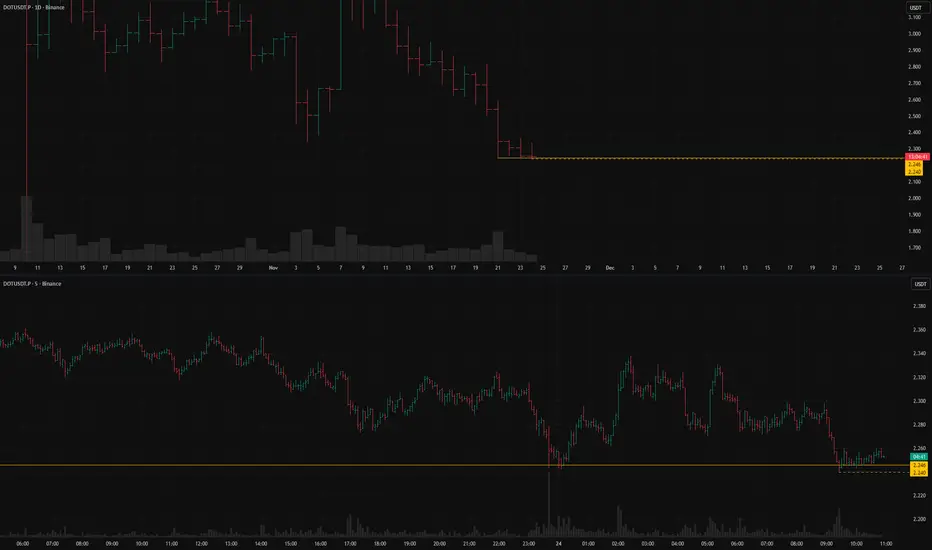
Polka dots Cyber Monday 2025Today polkadot Kissed The All time low $2 when it originally launched. I'm excluding the Black swan event at .6 ish. $2 for anyone who has kept up with this project will know We will hopefully never see these prices again. I hope you guys are able to get some today; as I did!
As always, this is not financial advice. Moreover, I do have a substantial position in this project and still DCA'ing.
DOT LONG SETUPDOT/USDT – Long Setup Explanation
Price has been in a sustained daily downtrend, but we’re now forming a tight consolidation right above a major liquidity cluster. The setup is based on a potential reversal from higher-timeframe levels.
Key Reasons for the Long
• Liquidity Sweep: Price swept the Monday Low and immediately reclaimed the Weekly + Daily Opens, showing buyer absorption.
• Support Cluster: Daily Open, Weekly Open, and Monday Low are all stacked together — strong confluence for a bounce.
• Accumulation Zone: Multiple small candles with long wicks indicate buyers defending this level after a sharp selloff.
• Clean Invalidation: Stop is placed below the sweep and structure low. If price breaks that level, the idea is invalid.
• Strong R:R Profile: Small downside risk with upside targets aligning with inefficiency fills and higher-timeframe opens.
Targets
1️⃣ Monday High (~2.40) – First liquidity pocket above.
2️⃣ 2.55–2.60 – Imbalance fill / mid-range.
3️⃣ Monthly Open (~2.85) – Main swing target if a larger reversal develops.
Idea Summary
I’m looking for a relief move after a liquidity sweep and reclaim of key opens. As long as price holds above the Weekly/Daily Open cluster, the bias remains bullish toward the Monday High and Monthly Open.

Algotrading DOTUSDTPress "Grab this chart", run strategy tester and make sure that is good time for a long to yellow line

DOT: Bullish Swing SetupIn this chart, the main focus is on the clear bullish divergence forming on the RSI, signaling a possible shift toward buyers regaining control. To find upside targets, I’ve added Fibonacci levels from recent swing highs to lows, marking key price zones where DOT could encounter resistance and potential breakout acceleration.
If momentum builds, the target is the golden ratio at $2.93, which historically acts as a strong magnet for price in retracement moves.
Another confluence is USDT.D at major resistance and soon a new fed cut will be priced in until 10th of December

DOTUSDT:short setup from daily support at 2.246BINANCE:DOTUSDT.P looks almost ideal for a short scenario. The only downside is that we've seen two false breakouts already, although, on the flip side, this confirms the strength of the level. Overall, we have a local level with no obstacles to the downside since 10.10.25 — a day that essentially "cleared" the chart. Right now, a solid pre-breakout base is forming directly above the level. There is no buy reaction to the test, which signals seller strength. If volatility remains low, this could turn out to be an easy and technical short.
Key factors for this scenario:
Global & local trend alignment
Price void / low liquidity zone beyond level
Liquidity grab (false move against the trend)
Volatility contraction on approach
Immediate retest
No reaction after a false break
Closing near the level
Closing near the bar's extreme
Was this analysis helpful? Leave your thoughts in the comments and follow to see more.
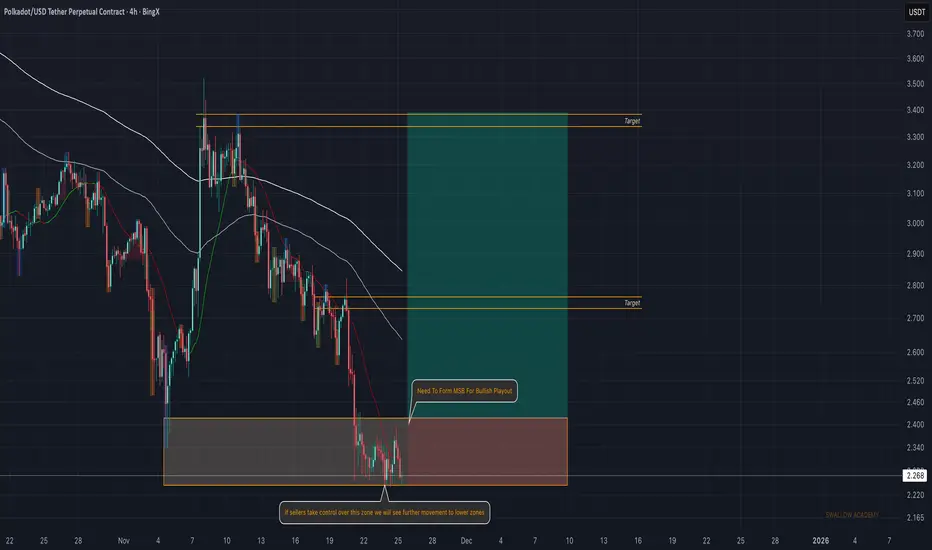
Polkadot (DOT): Looking For Bullish Breakout | Good R:RDOT is sitting right on its reaction zone, where buyers have been trying to hold the price from breaking lower. For now the structure is still weak, but we’re watching how price behaves inside this area — if buyers manage to flip this zone and show a clear shift in momentum, we’ll finally get the signal for a bullish play.
The setup gets canceled if price sweeps the current lows and closes below this whole zone — that would open the door for another leg down.
If buyers manage to stabilize here and give us a clean structure shift, the targets remain the same: first the local resistance around $2.75, and then the upper zone near $3.30–$3.40.
Swallow Academy
Maybe this is a good set upi dont know where is the dip but this price is so good to re-enter. SL below 2.22
DOT USDT LONG SIGNAL---
📢 Signal – DOT/USDT
📈 Trade Type: LONG
💰 Entry:
2.722
🎯 Targets (with partial take-profit management):
TP1 = 2.767
TP2 = 2.824
TP3 = 2.894
TP4 = 2.956
TP5 = —
TP6 = —
🛑 Stop-Loss: 2.690
📊 Timeframe: —
⚖️ R/R: 8.36
📌 Suggested Leverage: 5× or 10×
⚠️ Risk management is mandatory — please check the chart before entering.
📌 Important Note on Risk Management:
✔️ Once price hits the first target (TP1), the Stop-Loss moves to the entry point.
This is a standard risk-management rule to protect capital.
❗ So it’s completely normal if sometimes the price reaches TP1, then pulls back and hits breakeven.
This is not a failed trade — it means the position closed with zero loss and zero risk.

DOT longFits my setup and had a bos and hh and looks strong compared to others alts. Happy taking a long here with clear SL. Great R/R.

DOT forming dual flag structure with supportDOT has formed a bullish flag on the global chart, and a similar pattern has formed more locally.
DOT's attempt to consolidate above the MA50 and MA200 was unsuccessful, but given these patterns, we are more likely to see a retest of them in the near future
Currently, we are at support at $2.668
A reversal and a breakout of the MA50 and MA200 resistance levels are more likely to occur
A move below the purple area will indicate a continuation of the downward movement
More detailed analysis, additional charts, and key levels to watch are available on our site

Polkadot (DOT): Seeing a Good Push/Pump To Happen Soon!DOT is sitting inside a key zone where we’re waiting for a clean BOS to confirm buyers are stepping in. Once that happens, the next objective becomes the unfilled zone above, left behind during the bigger dip on higher timeframes. Until then, we stay patient and watch the reaction here.
Swallow Academy

DOTDOT has been in a long-term bearish trend for more than 2 years, with no clear signs of reversal.
The recent candle is a large red one, confirming increased selling pressure.
The price is sitting at the very bottom of the range, indicating weak buying interest.

DOTUSDT - inverted head and shoulders patternhi traders,
DOT is currently forming a bullish inverted head and shoulders pattern on the daily chart, suggesting a potential medium-term trend reversal to the upside.
Left Shoulder: Price declines and rebounds, creating the first swing low.
Head: A deeper sell-off forms the lowest point of the structure before buyers step back in.
Right Shoulder: Price is now developing the right shoulder, with higher lows indicating strengthening bullish momentum.
The neckline resistance sits slightly above the current price. A confirmed daily close above the neckline would complete the pattern and trigger a potential breakout.
The projected target, measured from the head to the neckline and extended upward from the breakout point, suggests an approximate 28% upside move, with the target area around 4.21 USDT.
The Stochastic RSI is currently in mid-range and curling upward, providing additional momentum support for a potential bullish breakout.
Trading Plan Considerations:
Entry: Upon a decisive breakout and daily close above the neckline.
Target: ~4.21 USDT (pattern completion target).
Invalidation: Breakdown below the right shoulder low would invalidate this setup.

DOT USDT SHORT SIGNAL---
📢 Trade Idea: DOT/USDT
Type: Short
Entry Price: 3.070
🎯 Take-Profit Targets:
• TP1 = 3.010
• TP2 = 2.863
• TP3 = 2.724
• TP4 = 2.597
• TP5 = 2.460
🛑 Stop-Loss: 3.173
⏱ Timeframe: 1H
⚖️ Risk/Reward Ratio: 6.3
💥 Suggested Leverage (if used): 5x–10x
---
Technical Analysis:
DOT is forming a clear bearish structure, with price failing to hold above the key resistance zone at 3.10–3.17.
A rejection from this level, combined with a lower-high formation and EMA crossover to the downside, confirms short momentum.
RSI also shows bearish divergence, signaling potential continuation toward the 2.86–2.60 range.
A clean break below 3.00 would validate further downside targets, with 2.46 as the extended goal.
---
Trade Management Tips:
• Consider partial profit-taking at each TP level.
• Move SL to entry once TP1 is hit.
• Setup invalid if price closes above 3.18 on 1H timeframe.
---
⚠️ Disclaimer:
This analysis is for educational purposes only and not financial advice.
Always DYOR and apply proper risk management before trading.
---
📌 Hashtags for visibility (TradingView SEO):
#DOTUSDT #Polkadot #CryptoTrading #ShortSetup #TechnicalAnalysis #TradingViewIdea #CryptoSignals
---

DOT USDT LONG SIGNAL---
📢 Signal Alert
🔹 Pair: DOT / USDT
📈 Trade Type: Long
💰 Entry Price: 3.082
🎯 Take-Profit Targets (Partial Management):
▫️ TP1 = 3.270
▫️ TP2 = 3.310
▫️ TP3 = 3.439
▫️ TP4 = 3.676
▫️ TP5 = 4.000
🛑 Stop-Loss: 2.850
📊 Timeframe: 1H
⚖️ Risk/Reward Ratio: 10.14
📌 Suggested Leverage: 5x – 10x
⚠️ Capital management is mandatory.
💬 Please review the chart before entering the trade.
---
🧠 Technical Analysis Summary:
DOT is forming a bullish continuation pattern above key support at 2.85–2.90, showing strong reaction and volume accumulation.
If price sustains above 3.08, a breakout toward 3.43–3.67 is likely.
RSI is turning upward from the mid-zone (≈50), suggesting renewed bullish momentum, and the EMA20 crossover supports a move to higher highs.
---
⚙️ Trade Management Tip:
• Take partial profits at TP1 and move stop-loss to Entry.
• Use a trailing stop after TP2 to lock in gains.
• Avoid re-entry if price closes below 2.85 on the 1H timeframe.
---
⚠️ Disclaimer:
This signal is for educational purposes only and not financial advice.
Always DYOR and apply strict risk management.
---

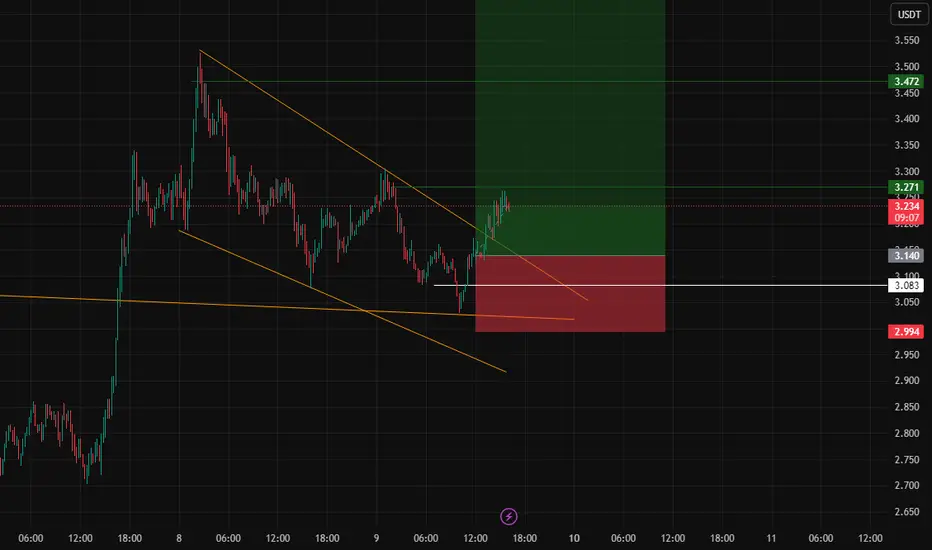
DOT USDT LONG SIGNAL📢 Signal Alert
🔹 Pair: DOT / USDT
📈Trade Type: Long
💰Entry Zone: 3.140 – 3.085
🎯 Take-Profit Targets (Partial Management):
▫️TP1 = 3.270
▫️TP2 = 3.470
▫️TP3 = 3.675
▫️TP4 = 4.000
🛑 Stop-Loss: 2.990
📊Timeframe: 15m
⚖️Risk/Reward Ratio: 6.35
📌Suggested Leverage: 5x – 10x
⚠️ Capital management is mandatory.
💬Please review the chart before entering the trade.
---
🧠 Technical Overview:
DOT is consolidating near a strong support zone.A hold above the 3.08-3.14 area could initiate a new upward impulse towards higher resistance levels. The exceptionally high Risk/Reward ratio suggests a favorable potential move if the support holds.
RSI is positioned for a potential bullish reversal, and a break above the local resistance could confirm strength for targets TP1 and beyond.
---
⚙️ Trade Management Tips:
· Take partial profit at TP1 and move SL to entry to secure risk-free exposure.
· Trail your stop-loss for the remaining positions as price progresses through TP2 and TP3.
· A decisive candle close below the 2.990 stop-loss level invalidates the bullish structure.
---
⚠️ Disclaimer:
This signal is for educational purposes only and not financial advice.
Always perform your own analysis and apply strict risk management.
---