DOTUSDT BULLISHDOTUSDT is in bullish trend
bullish divergence also shown
bullish flag pattern form
wait and watch for the breakout of flag pole.
DOTUSDT.P trade ideas

DOT Short Now !i expect new trend for DOT Because the price break the trend line also if we check the supply and demand they give us another confirmation

DOT/USDT 4HInterval Resistance and SupportHello everyone, let's look at the DOT to USDT chart on a one-day time frame. As you can see, the price is moving below the uptrend line.
Let's start with the support line and as you can see the first support in the near future is $ 5.66, which currently held the price, if the support is broken then the next support is $ 5.33 and $ 4.85.
Now let's move on to the resistance line, as you can see the first resistance is $ 6.04, if you manage to break it, the next resistance will be $ 6.31, $ 6.54 and $ 6.76.
Looking at the CHOP indicator, we see that most of the energy has been used, the MACD indicates an ongoing downtrend, while the RSI has a visible rebound and we are approaching the lower limit, which may change the trend.

DOTUSDT likely heading down for daily support around 5.55The price has close below the weekly support which is not a good sign. It might reclaim it this week if it is still bullish but from probability point of view the price seems to be going lower from here. I expect the price to reach to the next weekly support which is sitting around 4.5 zone but there is a daily support in between which may hold the price. Therefore, let us focus on the daily support as a target first and then reevaluate the weekly support target. The daily support is sitting around 5.55.

DOTUSDT at resistance, likely to retrace to 5.848The price is currently at resistance and a short is favorable. I believe the price can reach to the range low at 5.83.

PolkaDOT could fall further to $5.15BINANCE:DOTUSDT
Polkadot's price analysis shows that despite the bears' success in defending the moving averages on April 26, the support at $5.70 held and buyers emerged at lower levels.
As a result, the DOT/USDT pair is expected to trade within a range between $5.70 and the 50-day SMA ($6.20) for a while. If the consolidation breaks to the downside, the selling pressure may increase, pushing the pair towards $5.15, where demand is likely to pick up. Conversely, if buyers manage to push the price above the 50-day SMA, it would signal a comeback for the bulls. In this scenario, the pair may first target HKEX:7 , and if that level is surpassed, the next resistance would be at $7.90.
Let me know what you think!
Follow me for more TA!

W9-11 DOT BEARISH IDEA Potential Bearish Entry
Dow Theory In Place - Lower High and Lower Low Expected in Place
Formation of TRIPLE Top coupled with bearish divergence (Bearish reversal pattern)
Bullish Trend Is Still Intact. (careful for your levels)
SL & TP Levels are defined.

[polkadot] by qikoBehold DOT,
Embarking from $ 2, soaring to its zenith at $ 55, DOT boasts a remarkable 2673% escalation.
Mirroring numerous counterparts in the market, we've traced five descending waves, delineating the market's novel trend.
Anticipate a profound retracement to $4.5 within the local timeframe, prior to an inversion culminating Wave C. Subsequent to Wave C's completion, the downward trajectory shall persist.
Wave B Target: 4.50
Wave C Target: 13.50

DOT/USDT 4HInterval ReviewHello everyone, let's look at the DOT to USDT chart on a 4-hour timeframe. As you can see, the price is moving below the downtrend line.
Let's start with the support line and as you can see the first support in the near future is the support zone from $5.93 to $5.75, if the support is broken then the next support is $5.61, $5.46 and $5.26.
Now let's move on to the resistance line, as you can see the first resistance is $6.2, if you manage to break it, the next resistance will be $6.47, $6.69 and $6.90.
Looking at the CHOP indicator, we see that most of the energy has been used, the MACD indicates a local uptrend, while the RSI is approaching the upper limit, which may also slow down the current upward movement.

#DOTUSDT #LQR #TOBTC #LaqiraProtocol Support and resistance are specified in the chart
• Levels are obtained from the intersection of the fib and static levels
• You can open a position after confirmation
• This analysis is not an offer to buy or sell

DOTUSDT - 1HDOTUSDT - 1H
Bullish trough formed, at this moment the DOT is heading towards the upper edge of the trough which is at 6,276. There was an update regarding the DOT stake, among the resolutions is
• Increase the minimum number of tokens to create a nomination pool from 200 DOT to 500 DOT;
• Polkadot now supports fast unstake! Nominators can use the quick unbundle if the bet has not been active in the BondingDuration era in the past to unbounce their funds without waiting for the unbinding period.
Here are the supports and resistances:
Support 6098 / 6004
Resistances: 6,216 / 6,274
RSI: Exhaustion Buyer Forces
MACD: Positive
EMAS : Pointing upwards

DOT/USDT "triple bottom" formation? Hey guys 👋
Another coin that caught our attention is DOT with a nice "triple bottom" formation here which is near the breakout. Breakout is happening at neckline zone which seems to be strong so we suggest you to keep an eye on this one as well!
If you like ideas provided by our team you can show us your support by liking and commenting.
Yours Sincerely,
Swallow Team 🔱
Disclamer:
We are not financial advisors. The content that we share on this website are for educational purposes and are our own personal opinions.

DOTUSDT interesting price actionDOTUSDT is currently trading at the bottom of the ascending channel. A very interesting buying opportunity indeed. We are certainly taking this one serously.
THOT dot!If you find this info inspiring/helpful, please consider a boost and follow! Any questions or comments, please leave a comment! Also, check out the links in my signature to get to know me better!
Been awhile since I looked at this.
2s can run together, so if you see 2 exp flats that can be a tattle tail sign of a 12,12.
Unfortunately, I can also see this.
Cheers!

POLKADOT: UPTREND CONTINUATIONMIL:DOT looks bullish after last crypto correction, looking for a bounce from this uptrend and a continuation to the upside.
Daily 200 MA & uptrend touch confluence gave me more confidence on this long. Plus, trade has more than 1:3 RRR.
Will keep updating this in here, make sure you follow me.

DOT chartDot price levels on the chart will watch for a break either up or down
No clear direction yet

DOT - No clear direction
We had a false breakout above green resistance, which was quickly brought down by bears. Strong support at 5.70-5.80 is holding the price for the time being, and this is crucial for bullish hopes.
There are several wave scenarios that could be applied to this, but for now I'm keeping my previous count, with an adjustment for blue wave 2/B.
Invalidates below 5.150.

#Polkadot Drops 15%, DOT's 4 Month Rally Ending?Past Performance of Polkadot
The contraction of Bitcoin had a profound effect on altcoins, including Polkadot. The coin is underperforming at spot rates, sliding 15% from recent peaks. Even so, buyers remain in control from an effort-versus-results perspective, looking at the general performance in the daily chart.
#Polkadot Technical Analysis
The bearish engulfing bar of April 19 is with expanding volumes, thrusting bears in control. Since there was a follow-through and bears remain in control even at spot rates, traders can search for entries to sell. The immediate support line is $5.7, marking last week's highs. Meanwhile, resistance is at $6.1 and April highs, respectively. Losses below the previous week's lows with high participation levels may see DOT crumble to $5.2, the March 2023 lows; flashing with the 78.6% Fibonacci retracement line of the Q1 2023 trade range.
What to Expect from #DOT?
DOT buyers have a chance despite the recent drawdown. Any recovery pushing the price above $6.1 may spur activity, helping lift prices above $6.8 in a bullish continuation formation. Conversely, sharp liquidation may unwind gains, triggering a sell-off.
Resistance level to watch out for: $6.1
Support level to watch out for: $5.7
Disclaimer: Opinions expressed are not investment advice. Do your research.


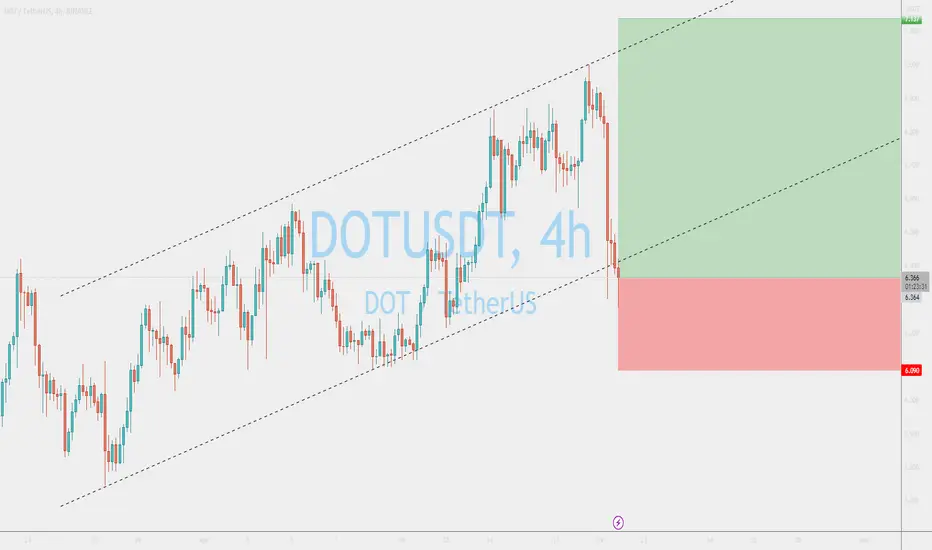
DOT TREND WITH BUY OR SELL ZONESLike is write in the chart, buy if the big trend is breakout or sell if the small channel is breakout in down
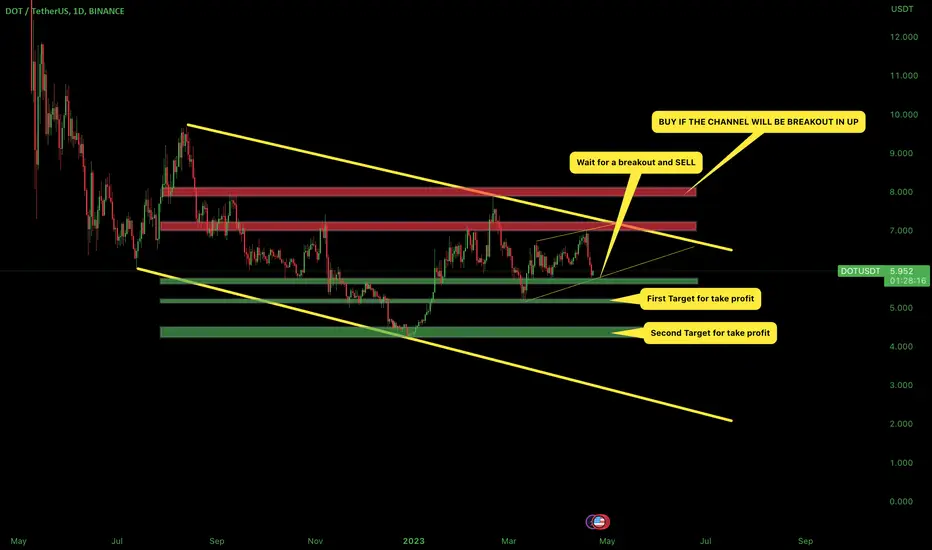
DOT/USDT 1D ReviewHello everyone, let's look at the DOT to USDT chart on a one-day time frame. As you can see, the price remains above the uptrend line.
Let's start by drawing a support line. And as you can see, the price is in front of a very strong support at the so-called golden point Fib Retracement equal to $ 5.63, if the support is broken then the next support is $ 5.02 and $ 4.22.
Now let's move on to the resistances that the price has to overcome. First, we have a very strong resistance zone from $6.23 to $6.54, when we manage to break it, the second resistance is $6.85, the third at $7.32 and then the fourth at $7.90.
Looking at the CHOP indicator, we see that there is still some energy left, the MACD indicates a downtrend, however, the RSI is approaching the lower limit, which may indicate the approaching end of the correction.

PolkaDOT could rest at support $5.93BINANCE:DOTUSDT
Polkadot experienced a sharp decline and dropped below the uptrend line on April 19, indicating aggressive selling by the bears. Although the bulls attempted to push the price above the 20-day EMA on April 20, the long wick on the candlestick suggests that the bears successfully protected the level, initiating a downward move towards the 200-day SMA ($5.93).
Buyers are expected to fiercely guard the zone between the 200-day SMA and $5.70, as failure to do so may intensify selling and cause the DOT/USDT pair to plummet to $5.15. However, this bearish view will be invalidated in the near term if bulls push and sustain the price back above the uptrend line.
Let me know what you think!
Follow me for more TA!

DOTUSDTDOTUSDT Formed a Rising Wedge.
And We can also see the Divergence.
Then We Noticed a sudden drop in the Price.
We can see a Support Zone at 5.9 to 5.8.
The price will test its 1st Support zone, at 0.618 Fib Level
And We can also see another strong Support zone at 5.1 to 4.9
