DOT ladder climb over...in retracementDOT has broken through its short upward trendline in the 15 min view. The whole alt coin market is in a retracement...so it's not just a DOT thing happening.
Trade ideas

DOT climbing the ladderThis is a 15 minute close up of DOT's price action. Look how uniformly it is climbing, like a ladder, revisiting each rung. Looks like you can guess the next price point for DOT.

DOTUSDT Head and Shoulder PatternCRYPTOCAP:DOT Head and Shoulder Pattern
wait until break and entry
target $24

DOTUSDT BUYI think we going up with DOT (will happen), but if it returns to the channel, we will see lower numbers

Polkadot - Bullish ChartDOTUSDT price bounced back from the support and broke the down trend line, also closing above the previous recent high, which is bullish.
As soon as bitcoin dominance starts to show some signs of weakness, DOT should rise.

#DOT/USDT#DOT
The price is moving in a downward channel on a 1-day frame
We have a higher stability moving average of 100
We have an RSI trend that is about to break higher
The channel is expected to break well
Entry price is 6.75
First target 7.00
Second goal 7.77
Third goal 8.57

DOT - breakout trade - uptrend continuationCRYPTOCAP:DOT is in an uptrend. We have just broken out above the resistance. Following the same pattern as a number of other Alt coins that have already pumped massively. This is a trend continuation trade, playing breakout above resistance.
Stop limits set below resistance. Trail stops. Sell 50% at 1:1 RR to turn this into a zero risk trade.

On Track I know alts are flying up in value and this one is taking a little bit longer, but I suggest you give it some time to catch up to other alts. It'll eventually get to FWB:30S range.

Dot will start its bullish journey !Dot will have its run after breaking through the resisting point

DOT/USDT Poised for a Bull Run? 👀🚀DOT Analysis💎Paradisers, let's direct our attention to #DOTUSDT, as it's showing signs of a potential significant move from a key demand level.
💎#Polkadot is demonstrating an upward trend, hinting at a likely bullish breakout from its current demand zone. We anticipate a retest of the demand level at $6.38, with a major supply zone in sight. If #DOT holds above this level, it might set the stage for a rise toward the major supply zone at $9.0.
💎However, if #DOT struggles to maintain its position above the support, a reassessment of our trading strategy may be in order. In that scenario, we would look towards initiating a bullish movement from a lower bullish Order Block (OB).
💎It's vital to keep a vigilant eye on this level, as a drop below it could trigger a considerable bearish trend.
💎Stay sharp and flexible, Paradisers. Your ParadiseTeam is committed to offering the latest insights and strategic guidance, ensuring you're fully prepared to handle these market movements.

... $DOTAfter todays flash crash swiftly after $64,000!!!! went as low as $7.643 I dont have a secret sauce i just manage my risk im looking to push up against the previous highs with a 3.5:1 and 6.3:1 with tight stops. EITHER WAY a 30% GAIN....
Not Financial Advice...

DOT waite for rengAnalysis by EZ7.startegy📊
This idea represents a price chart for the crypto asset **DOTUSDT**, analyzed using the **EZ7strategy. Let's break down the key elements:
1. **White Trend Lines**: These lines depict the asset's price movements.
2. **Red Annotation**: It signifies the strategy "Sell in high channel and base bear-trend."
3. **Green and Red Shaded Areas**: These indicate potential buy and sell zones.
4. **Price Levels**: Midle target levels at 7.295 and 7.737 are highlighted.
5. **Oval Highlight**: Indicates where the trendline and candle base broke, suggesting a potential trend change or significant price movement.
6. **DOTUSDT Logo**: Visible at the bottom right corner.
Using images and charts in crypto asset analysis can be valuable for professional traders. This image may provide useful insights into the price trend of DOTUSDT.


📊🌐 DOT - Long Trade Play Strategy! 💹🚀🔍 Strategy Overview:
Condition: Wait for the price to break and retest the $8.50 level.
Entry Criteria: Look for an open and close of a 4HR candle above $8.50.
Targets: Targeting the next resistance at $9.60, followed by $10.73.
Risk Management: Set stop loss just below $8.00.
📢 Analysis: Keep a close watch on the $8.50 breakout and subsequent retest. Evaluate the price action for confirmation and consider implementing risk management strategies. 🌐📈 #DOT #CryptoTrading #Altcoins 🚀💰

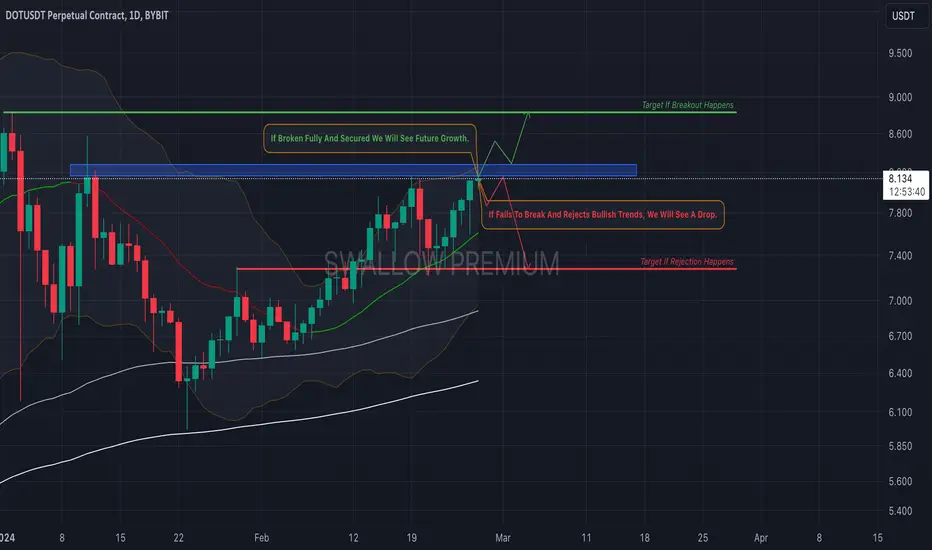
Polkadot(DOT): Breakout or Rejection, We Are Ready!Polkadot has reached the major resistance zone in the daily timeframe, which gives us two possible scenarios here:
First scenario: bullish breakout, which would mean we need to secure that upper resistance and turn it into a support zone for further growth from here.
Second scenario: bearish rejection, which would show the dominance of sellers in the current zone and lead price to the middle line of Bollinger Bands (just as last time) and potentially toward that target zone as well!
Swallow Team