Polkadot (DOT): We Might See +80% Movement Very SoonDOT looks very good - we might be seeing a decent bounce happen very soon, which would give us +80% movement.
More in-depth info is in the video—enjoy!
Swallow Academy
Related pairs

POLKADOT TO $25Now that we know an altseason is on the way, I think this time Polkadot can break through the $10 resistance.
The next important and strong resistance is at $25, which is a resistance area and the 0.702 of the Fibonacci.

DOT — Key Levels Reclaimed, Breakout Ahead?DOT has been in sideways chop for 222 days, but things are finally getting interesting. Price is now sitting above the yearly level ($4.309), the daily 233 EMA/SMA, and the weekly 21 EMA/SMA. Even better, it reclaimed the POC of the entire 222-day range.
Why $4 Is So Important
Yearly level →
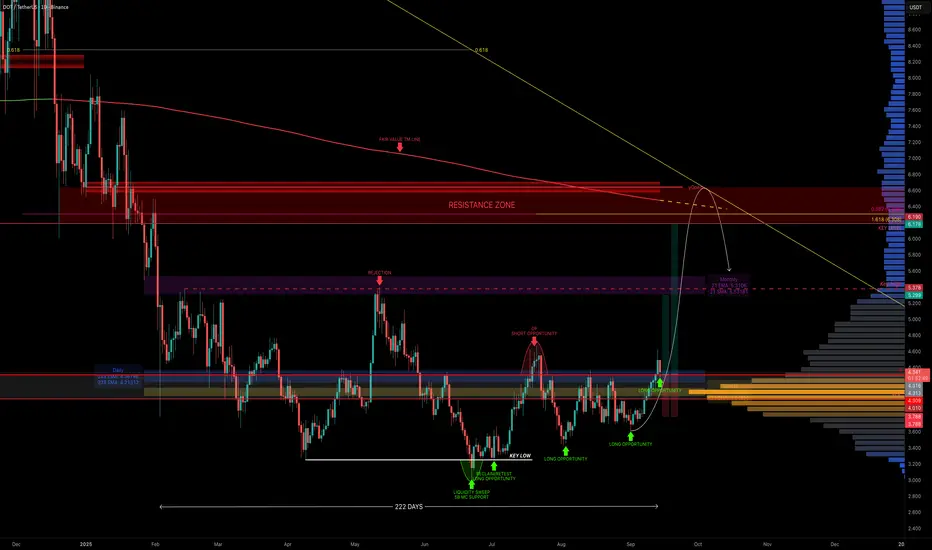
WHAT GOES UP, MUST COME DOWN – $DOT DUMP TIME?In my last analysis we nailed the move: CRYPTOCAP:DOT pumped to sweep the weak 14 Aug high exactly as projected. ✅ That mission is complete – now it’s time for the other side of the trade.
Analysis
14 Aug high swept → equilibrium reached.
Price in HTF Golden Pocket + strong Fib cluster.
B
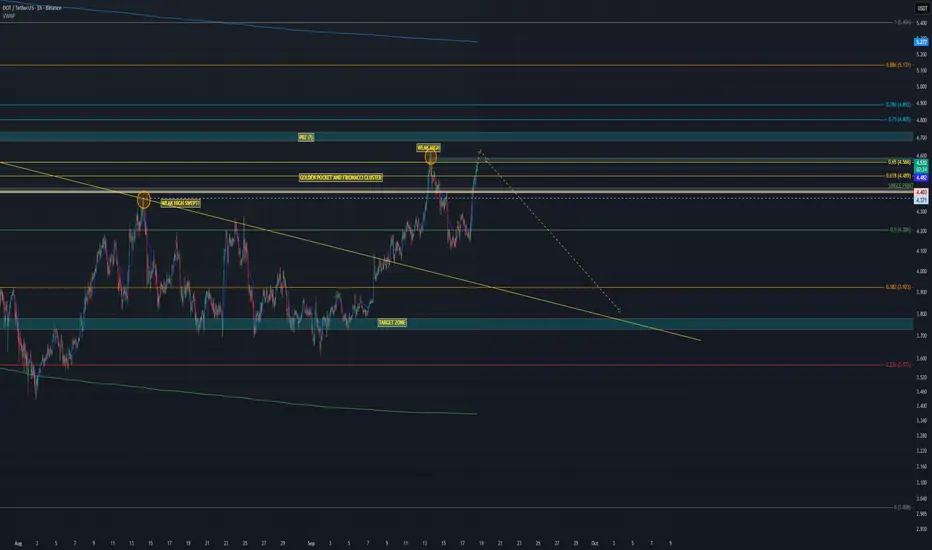
DOT / USDT : Momentum building for a strong rallyDOT/USDT is showing strong momentum and looks ready for a rally. If momentum continues to build, the next upside targets are $5 – $6.
Always manage risk and wait for confirmation before entering.

DOT is Ready for 130% Up Move DOT is making a pattern at Support zone and It has given a Breakout from that pattern . and at the same time Altcoin Season Index is at 74 , when it is >75 it is sign of very bullish in altcoins and Breakouts will have very high potential to give a big move .
and at the same time Bitcoin dominance
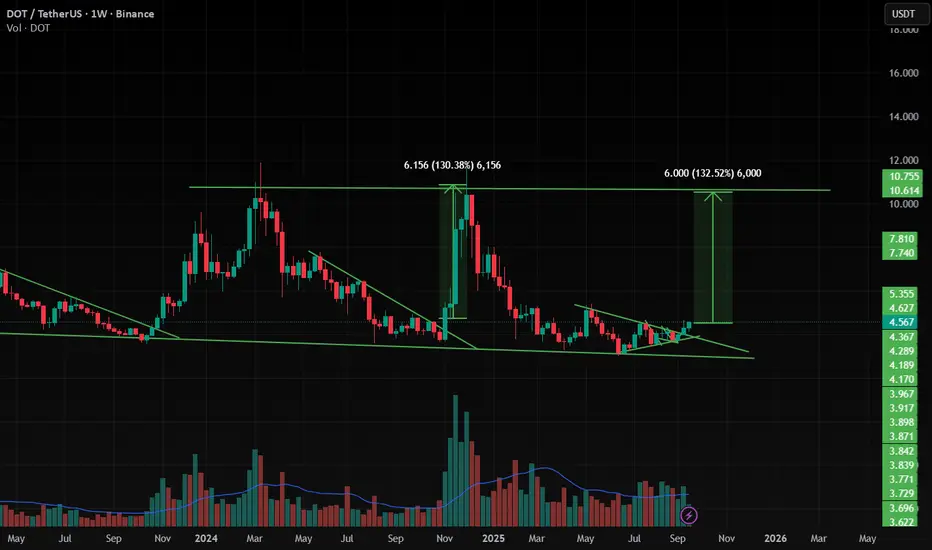
DOT Breakout Incoming – Get Ready!
CRYPTOCAP:DOT Polkadot is showing early signs of a reversal from its long accumulation phase. After months of sideways action, the chart is hinting at a major upside move! 🧠📈
Targets to watch:
🎯 $8.54
🎯 $11.73
🎯 $14.41
This could be the start of a powerful rally. DOT is looking explosive! 💣

Dot Polkadot >>Super Bullish in 18M!!"Polkadot forming an irregular flat pattern? Could surge 261.8% and potentially reach $140 in 18 months if an ETF is approved."

Polkadot Eyes $7.67 as Breakout LoomsPolkadot’s structure shows signs of bottoming. Accumulation above the 0.618 Fibonacci support has created a solid foundation, and price is now challenging resistance. This phase is critical, as confirmed breakouts from such levels often lead to sharp upward momentum.
Key Technical Points
- $3.39 S

$dot potentialGreat opportunities here imo…
We could see a draw back but I don’t see anything lower than the $4 handle here.
The whole handle from the early into mid $4 pricing plays heavy here.
Again, some nice closures above $4.50 should see us above $6 with a crucial handle sitting @$8.30+ which is reasonab

See all ideas
Summarizing what the indicators are suggesting.
Oscillators
Neutral
SellBuy
Strong sellStrong buy
Strong sellSellNeutralBuyStrong buy
Oscillators
Neutral
SellBuy
Strong sellStrong buy
Strong sellSellNeutralBuyStrong buy
Summary
Neutral
SellBuy
Strong sellStrong buy
Strong sellSellNeutralBuyStrong buy
Summary
Neutral
SellBuy
Strong sellStrong buy
Strong sellSellNeutralBuyStrong buy
Summary
Neutral
SellBuy
Strong sellStrong buy
Strong sellSellNeutralBuyStrong buy
Moving Averages
Neutral
SellBuy
Strong sellStrong buy
Strong sellSellNeutralBuyStrong buy
Moving Averages
Neutral
SellBuy
Strong sellStrong buy
Strong sellSellNeutralBuyStrong buy
Displays a symbol's price movements over previous years to identify recurring trends.
Frequently Asked Questions
The current price of DOT / TetherUS (DOT) is 3.985 USDT — it has fallen −2.23% in the past 24 hours. Try placing this info into the context by checking out what coins are also gaining and losing at the moment and seeing DOT price chart.
DOT / TetherUS price has fallen by −5.19% over the last week, its month performance shows a 12.17% increase, and as for the last year, DOT / TetherUS has decreased by −10.65%. See more dynamics on DOT price chart.
Keep track of coins' changes with our Crypto Coins Heatmap.
Keep track of coins' changes with our Crypto Coins Heatmap.
DOT / TetherUS (DOT) reached its highest price on Nov 4, 2021 — it amounted to 55.090 USDT. Find more insights on the DOT price chart.
See the list of crypto gainers and choose what best fits your strategy.
See the list of crypto gainers and choose what best fits your strategy.
DOT / TetherUS (DOT) reached the lowest price of 2.000 USDT on Aug 18, 2020. View more DOT / TetherUS dynamics on the price chart.
See the list of crypto losers to find unexpected opportunities.
See the list of crypto losers to find unexpected opportunities.
The safest choice when buying DOT is to go to a well-known crypto exchange. Some of the popular names are Binance, Coinbase, Kraken. But you'll have to find a reliable broker and create an account first. You can trade DOT right from TradingView charts — just choose a broker and connect to your account.
Crypto markets are famous for their volatility, so one should study all the available stats before adding crypto assets to their portfolio. Very often it's technical analysis that comes in handy. We prepared technical ratings for DOT / TetherUS (DOT): today its technical analysis shows the strong sell signal, and according to the 1 week rating DOT shows the strong sell signal. And you'd better dig deeper and study 1 month rating too — it's sell. Find inspiration in DOT / TetherUS trading ideas and keep track of what's moving crypto markets with our crypto news feed.
DOT / TetherUS (DOT) is just as reliable as any other crypto asset — this corner of the world market is highly volatile. Today, for instance, DOT / TetherUS is estimated as 11.99% volatile. The only thing it means is that you must prepare and examine all available information before making a decision. And if you're not sure about DOT / TetherUS, you can find more inspiration in our curated watchlists.
You can discuss DOT / TetherUS (DOT) with other users in our public chats, Minds or in the comments to Ideas.