DOT / USDT : Momentum building for a strong rallyDOT/USDT is showing strong momentum and looks ready for a rally. If momentum continues to build, the next upside targets are $5 – $6.
Always manage risk and wait for confirmation before entering.

polkadot bullrun expected pricePolka Dot is holding it's support on weekly timeframe. First attempt to break local resistance is already happened. We are expected Dot ETF also which can drive it price at least 2x.

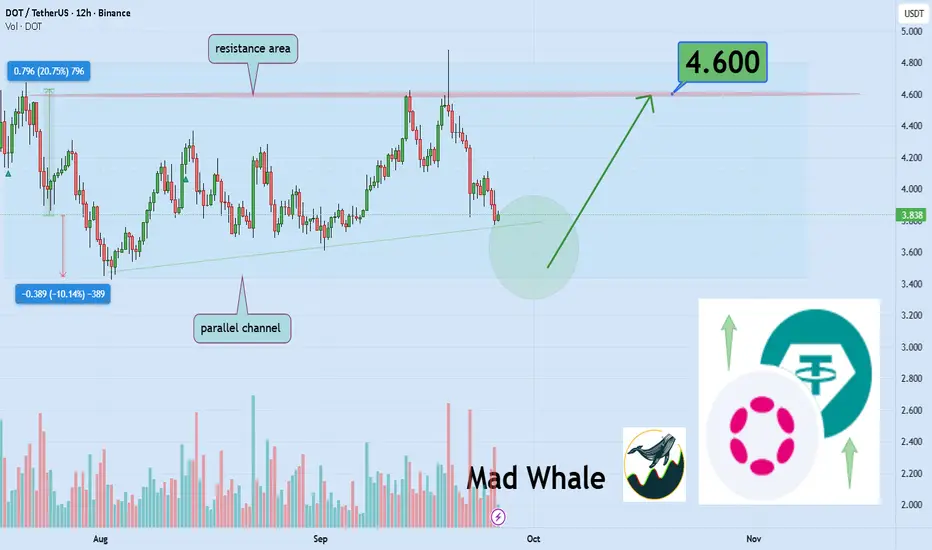
Polkadot testing strong support, potential 20% upside to 4.60Hello✌️
Let’s analyze Polkadot’s price action both technically and fundamentally 📈.
🔍Fundamental analysis:
Polkadot (DOT) is rolling out the JAM upgrade in Q4 2025, aiming for 1M TPS and stronger scalability for apps and enterprises.
With supply capped at 2.1B and inflation reduced, DOT coul
Polkadot Range-Bound Between Weekly Levels, POC Acts as MagnetPolkadot continues to trade between weekly support at $3.39 and resistance at $4.40. Price action remains rotational within this range, with the point of control acting as the primary magnet.
Polkadot’s price has been consolidating for an extended period within a defined weekly range. After multipl

DOTUSDT - 200% Upside - Long SetupDOTUSDT has been in a long consolidation. A bullish divergence was there and now a wedge pattern was in play and finally a bullish breakout and retest could be observed. This would mean a trend reversal and further Higher Highs and Higher Lows. Therefore, giving the perfect opportunity for a long en

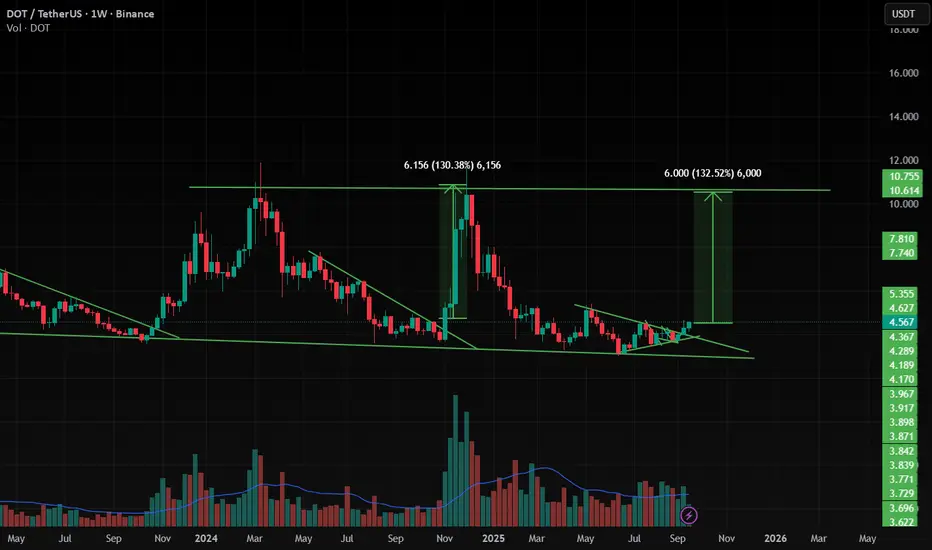
DOT is Ready for 130% Up Move DOT is making a pattern at Support zone and It has given a Breakout from that pattern . and at the same time Altcoin Season Index is at 74 , when it is >75 it is sign of very bullish in altcoins and Breakouts will have very high potential to give a big move .
and at the same time Bitcoin dominance
POLKADOT TO $25Now that we know an altseason is on the way, I think this time Polkadot can break through the $10 resistance.
The next important and strong resistance is at $25, which is a resistance area and the 0.702 of the Fibonacci.

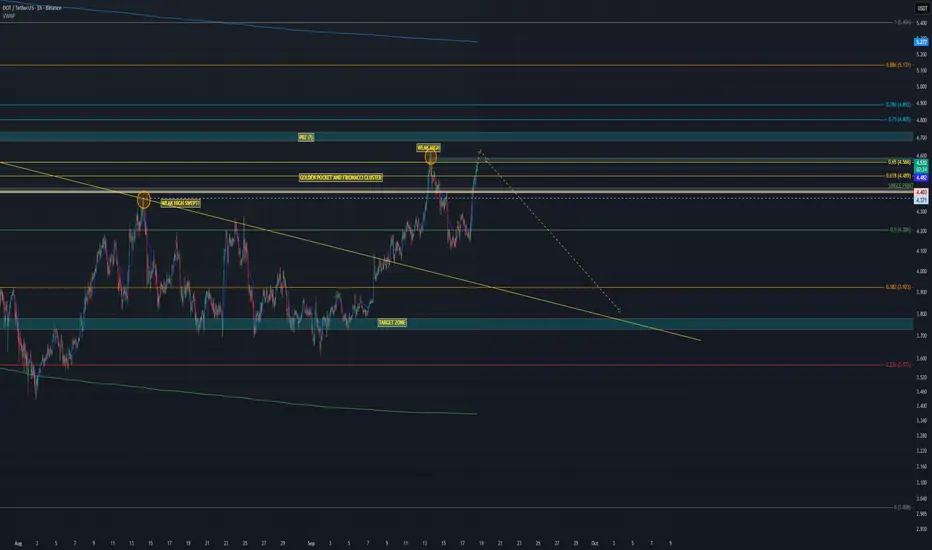
WHAT GOES UP, MUST COME DOWN – $DOT DUMP TIME?In my last analysis we nailed the move: CRYPTOCAP:DOT pumped to sweep the weak 14 Aug high exactly as projected. ✅ That mission is complete – now it’s time for the other side of the trade.
Analysis
14 Aug high swept → equilibrium reached.
Price in HTF Golden Pocket + strong Fib cluster.
B
$DOT clean ENTRY on daily candle CLOSE above $4.70CRYPTOCAP:DOT on the DAILY chart still under that long-term horizontal resistance up there at $4.60 - $4.70 which is also now the upper trendline of our ASCENDING TRIANGLE that has been forming since late June.
Same strategy, entries above $4.7 with a good daily candle close. Also about to materia

Dot/Usdt
Polkadot cryptocurrency is worth buying at the price of $3.80, with a stop-loss at $3.40 and a target price of $4.80. It could potentially experience around 30% price growth from now.

See all ideas
Summarizing what the indicators are suggesting.
Oscillators
Neutral
SellBuy
Strong sellStrong buy
Strong sellSellNeutralBuyStrong buy
Oscillators
Neutral
SellBuy
Strong sellStrong buy
Strong sellSellNeutralBuyStrong buy
Summary
Neutral
SellBuy
Strong sellStrong buy
Strong sellSellNeutralBuyStrong buy
Summary
Neutral
SellBuy
Strong sellStrong buy
Strong sellSellNeutralBuyStrong buy
Summary
Neutral
SellBuy
Strong sellStrong buy
Strong sellSellNeutralBuyStrong buy
Moving Averages
Neutral
SellBuy
Strong sellStrong buy
Strong sellSellNeutralBuyStrong buy
Moving Averages
Neutral
SellBuy
Strong sellStrong buy
Strong sellSellNeutralBuyStrong buy
Displays a symbol's price movements over previous years to identify recurring trends.