ETH downside target hit, bottom soon?Wave 2 is taking the form of a complex WXYXZ correction broadening wedge. Ugly, hard to trade or find any entries. This will cause a lot of stress. This is also potentially a wave 4, but my preferred count is 2 for now.
Wave 2 appears complete with a swing below the boundary at the High Volume Node. Price is below the saily 200EMA. The trend is down, so we should expect more down. Wave X printed a triangle, hinting at this move down being the final move before reversal.
📈 Daily RSI has reached oversold with unconfirmed bullish divergences.
👉 Continued downside has a target of the High Volume Node $2080, where I will be adding.
Safe trading
Trade ideas

BTC ETH SOL Dump Your bags! Collapse Is About To ResumeLast Friday morning I closed all my SHORTs and entered some small LONGs hoping to catch a nice bounce but it wasn't even worth it. There is ZERO strength in this market at the moment.
My small LONG positions are now closed. I am about to go ALL IN AGAIN with SHORT positions.
Buckle up! crypto is about to resume crashing all the way into early December.

ETH Wave Analysis According to Wave Analysis principal, ETH is completing Correction Wave to start next bullish phase for target 7K and 11K.

Ethereum Builds Strength: Day Trading Blueprint🔥 ETH/USD — Ethereum Day-Trade Breakout Blueprint 🚀 | Bullish Momentum Setup 🔍
📌 Asset: ETH/USD — Ethereum vs U.S. Dollar
📈 Market Type: Crypto | DAY TRADE Blueprint
📖 Trade Plan — Bullish Breakout Structure
ETH is building strong upward momentum with clean higher-lows and tightening price compression. Buyers are stepping in across major crypto pairs, signaling strength in the broader market cycle.
🎯 Entry
Any price-level breakout entry depending on your execution style.
🛑 Stop Loss (Risk Management First)
This is Thief SL → @ 2760
Dear Ladies & Gentlemen (Thief OG’s), adjust your SL based on your OWN strategy and risk.
⚠️ I'm NOT recommending to use ONLY my SL — your money, your rules, your risk tolerance.
🏆 Target
Moving Average is acting as strong resistance + market is entering overbought zones + potential trap formation for late buyers.
Our TP Zone → @ 3000
⚠️ Dear Ladies & Gentlemen (Thief OG’s), TP is your personal choice.
You can take profits the way YOU manage risk.
🔗 Related Pairs to Watch (Correlation Radar)
Watching correlated pairs gives confirmation + early signals of ETH strength or weakness.
1️⃣ BTC/USD (Bitcoin) — King Maker
ETH usually follows BTC’s momentum.
If BTC shows bullish continuation + strong volume → ETH breakout becomes HIGHER probability.
If BTC stalls or rejects → ETH breakouts often fail or become fakeouts.
2️⃣ ETH/BTC — Relative Strength Pair
A rising ETH/BTC = Ethereum outperforming Bitcoin.
A falling ETH/BTC = ETH lagging → Breakouts weaken.
Key Significance: Shows where smart money is rotating.
3️⃣ NASDAQ 100 / US Tech Index ( NASDAQ:NDX / NASDAQ:QQQ )
ETH has high correlation with risk-on tech sentiment.
If US tech rallies → Crypto liquidity flows → ETH bullish pressure increases.
If tech sells off → Crypto often follows.
4️⃣ DXY — U.S. Dollar Index ( TVC:DXY )
Weak USD → Crypto strengthens (inverse correlation).
Strong USD → Crypto cooling or correcting.
Watching DXY helps understand global risk appetite.
5️⃣ SOL/USD, AVAX/USD, MATIC/USD — Layer-1 Competitive Coins
High performance in these alt L1s often triggers rotation flows into ETH.
When these pump together → ETH usually follows with momentum.
📊 Why These Correlations Matter
Crypto → Highly interconnected; no asset moves alone.
BTC controls trend direction.
TradFi indices & USD influence liquidity conditions.
ETH/BTC shows smart-money rotation.
Alt-L1s show risk appetite in the broader ecosystem.
Tracking these pairs = fewer fake breakouts + stronger conviction.

ETH/USD 1H Chart Pattern.📌 ETH/USD 1H Analysis
I have drawn two target levels on my chart, and based on the trendline break + Ichimoku signals, my targets look correct.
---
1️⃣ Trendline Break
ETH has broken the downward trendline, which shows the beginning of bullish momentum.
---
2️⃣ Ichimoku Cloud
Price is trying to move above the cloud.
If a candle closes above the cloud on 1H, the bullish continuation becomes stronger.
---
🎯 Target Levels (Based on my Chart)
✔ Target 1 (Short-Term)
$3,040 – $3,060
This is the first resistance zone and the first realistic target after the breakout.
✔ Target 2 (Extended Target)
$3,220 – $3,250
If ETH breaks Target 1 with strong volume, it can move toward this higher target.
---
Suggested Trading Plan
Stop-Loss: $2,775 – $2,785
Take Profit 1: $3,040
Take Profit 2: $3,230

ETH/USD (1H timeframe) ...ETH/USD (1H timeframe) on Coinbase, and it’s clearly showing a raisin trendline test with two downside “Target Points” already drawn. Let’s break it down:
---
🔍 Chart Analysis
Price is $3,441, sitting right on the ascending trendline.
Ichimoku Cloud is turning bearish (price below the cloud).
Trendline break looks likely — momentum is weak and candles are closing below the cloud.
Two target zones (downside) are marked on my chart.
---
📉 Bearish Breakdown Scenario
If ETH breaks and closes below the ascending trendline (~$3,440 area):
First Target (TP1): around $3,230 – $3,250
→ This aligns with previous horizontal support and midpoint of the last bounce.
Second Target (TP2): around $3,000 – $3,050
→ This is my deeper support zone — the next strong demand level on the chart.
---
⚠ Invalidation / Stop-Loss
If ETH closes back above $3,520 – $3,540, that would invalidate the bearish move (trendline reclaim + cloud flip).
---
🧭 Trade Summary
Entry (Breakdown): Below 3,440
TP1: 3,240
TP2: 3,020
SL: 3,540

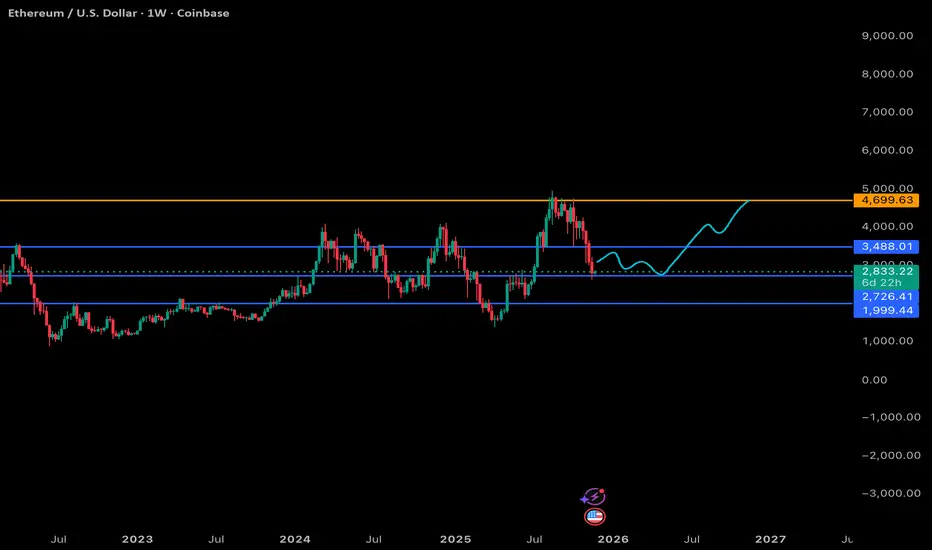
ETH 1W Breakdown: My Levels & What to Expect Next - Nov 23 2025Here’s my current high-timeframe view on Ethereum. Same structure as the BTC chart:
Blue = support, orange = major resistance, and the teal line = where I think price is headed into next year.
Support Levels (Blue)
$3,488: This is the upper support zone. ETH already lost it on the weekly, so I’m treating it as a potential reclaim level later rather than an area to rely on for an immediate bounce.
$2,726: This is the real weekly support I’m watching short-term. Price is sitting just above it, and this level has acted as both resistance and support multiple times across 2024–2025. If ETH is going to stabilize, it’ll probably start here.
$1,999: Deep, cycle-reset support. I’m not calling for this, but it’s absolutely in play if the broader market gets another leg down or BTC drags everything into a deeper correction phase.
Resistance (Orange)
$4,699–$5,000: This is the macro ceiling for ETH. Major weekly resistance from the last cycle’s highs. ETH hasn’t convincingly broken above this since 2021, so this is the level that needs to be taken out to start a real expansion phase.
My Expected Path (Teal)
The teal line is basically my roadmap going into late 2025/2026:
ETH chops around between $2.7K and $3.4K while the market tries to find weekly direction.
Eventually we get a reclaim of that mid-zone, slow, sideways, frustrating price action.
Then a grind back into the $4–4.5K region as momentum rebuilds.
Break above the orange zone later next year, which finally opens the door for a move into price discovery (I’m thinking $6K+ if things really align with the broader cycle).
This mirrors the BTC idea: a mid-cycle reset, sideways accumulation, then the breakout once the market has properly flushed leverage and sentiment has cooled off.
Overall View
ETH looks like it’s in the same boat as BTC right now, not bearish on the macro, just in that annoying “let’s reset everything” phase that tends to drag on longer than most people want. If it plays out like this, I think ETH offers multiple opportunities to accumulate before we get any push toward its all-time-high region.
Slow grind now, bigger moves later.
short ethBullish scenario: ETH could reach around $4,600–$4,700 if market conditions stay positive.
Neutral scenario: Price likely moves sideways between $2,300–$3,400.
Bearish scenario: A correction could push ETH down to $1800.

Is The Crypto Bull Market Over?!Follow me on X! @Trdr_Alchemist
Over $1B in liquidations on BTC alone, extreme fear across the market, and everyone suddenly calling for the end of the bull market. But this move may be exactly what we needed.
The weekly close is VITAL for us down here. I like what I am seeing, and this could be the biggest sign for us.
⚠️ Disclaimer:
I am not a financial advisor. The content shared on this channel is for educational and informational purposes only and should not be considered financial advice.
Trading and investing in cryptocurrency involve high risk — you could lose some, or all, of your money. Always do your own research and make sure you understand the risks before making any financial decisions.

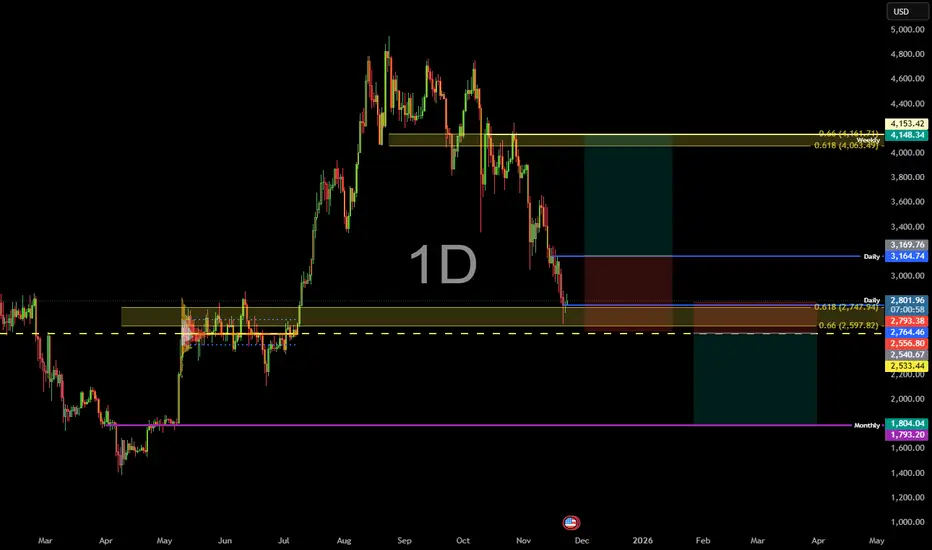
ETH santa rally set up, and short if it failsETH chart looks great for bounce back long here. We have held the HTF golden pocket over the weekend and likely spot to provide a relief rally from hard drop.
We want to see some momentum to the upside for the long trade first. Several 4hr or a daily close over the entry area will be the signal. The final target is the GP and weekly level. Look left to previous consolidation ranges for resistance and likely spots to TP along the way.
However, we are currently in a very strong downtrend and if that should continue the short option is also there. Loss of the GP and entry below the POC of the previous range in this area should take us down to the monthly level. This does offer a tighter SL and will be putting on a larger size trade if this happens.
I'm still bearish on EThereum Price might not get to the point of interest i marked out but if it does, I'm 50% sure it will hold then do a 100 pips sell first before either continuing to TP or reversing.
Use proper risk and money management if you do decide to set your limit order after the close of this current daily candle.

ETH idea 12.11.2025On this market, I see the potential of the two closest scenarios, on the one hand, a short at the level of 3900-4000, where I would like to see the sfp above the previous high, and then a long one, which I would like when it falls below the wall at the price of 3180

ETHUSD W1 - Swing PositionETHUSD W1
We might be starting the bullish continuation here in the Crypto space after such an aggressive correction. We have marked on a 618 correction from previous swing low to swing high price.
Swing low price of $1400, to a swing high price of $5000, a huge extension seen from April 2025 through to end of Aug 2025. We have indicated various prices of interest, working out every $500.
Falling just shy of $2500, this may have been the lowest price we expect to. Lets see what this week brings.


ETH shortStrong downtrend with ADX above 40.
EMA's cross over downwards.
RSI not yet oversold.
Sell volume clearly dominates.
Has lots of room to breakdown further.

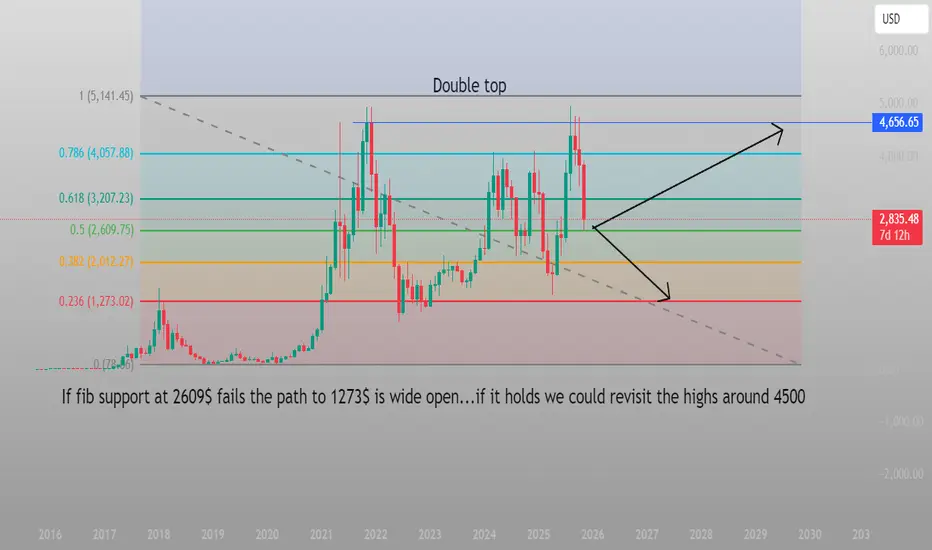
ETH decision pointWe are at a crossroads I believe.
Double top near 4600; major resistance ahead.
Key support at 2609; breakdown targets 1273.
Hold at 2609 could rally toward 4500.
Fib levels guide risk and targets.
ETH market snapshot ETH — Mid-term view
I don’t rule out a deeper move toward the $1800 zone, but on the daily and 3D/4D timeframes ETH is already showing clear signs of a pause: local oversold conditions, MACD convergence, and a test of the global trendline. I’m positioning long here with the idea that ETH is strong enough for buyers to step in before tagging the lower zone.
Technically, ETH is still the only attractive setup for me right now: large-scale consolidation with compression toward the $4200–4500 resistance area, where a breakout could open the way into “open sky.”
Local structure:
The first major resistance zone is $3500 — confluence of MAs + the level where the market would need to request a trend reversal confirmation.

ETHUSD Weekly
Great weekly pullback for ETHUSD. Long-term buy here with the market structure bill coming next month.

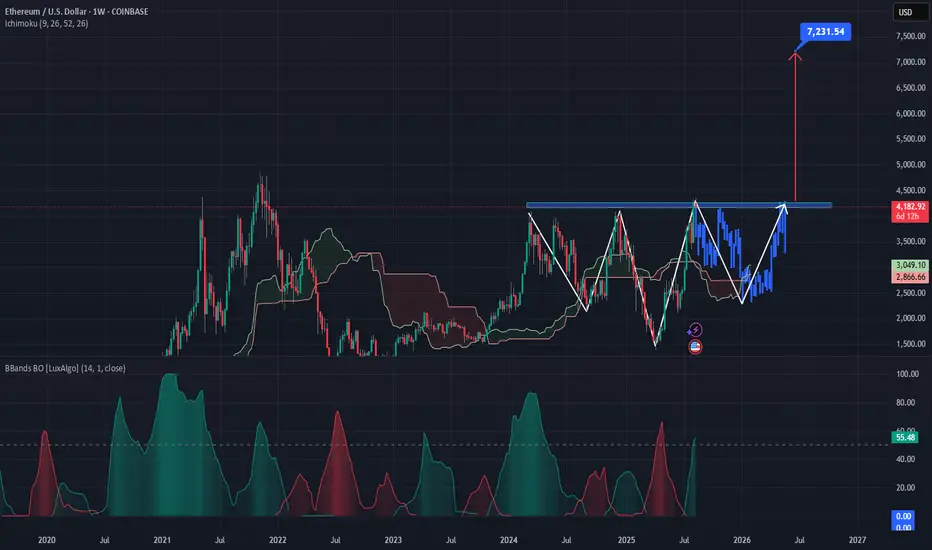
ETH possible reverse HNS pattern predictionAs ETH is trading around psychological zone of 4,000 which it has tested many times. I am seeing some inducement in this area and a potential to reach 7,200 after making reverse HNS pattern. Let's see how it plays out
ETH Long - 64% increase from $2700 Price RegionThis call is based on a volatility expansion 50% level retest on the 3d. This tool identifies volatility expansion events, tracks how price behaves after them, and builds volatility based projection levels and statistics. It shows how far reversal moves typically travel and how reliable they have been.
I expect a re-test of these same levels provided on the 4h time frame as indicated by the red and white boxes on the upper bound of price.
We have had a good couple weeks of buyers and sellers trading around this level with out any further violent moves below it.
Bitcoin is also starting to show positive market structure on LTF's. I believe during the BTC dead cat bounce alt season will have finally arrived after 4-5 years

ETH Bull Run Alert: From $1,780 Lows to $6,100 Peaks? My TradingHey traders and crypto fam! If you're grinding TradingView charts like me, you've probably eyed Ethereum's wild ride. Right now, ETH is hovering around $2,700 (as of Nov 22, 2025), but let's talk that dip you're mentioning—back to $1,780? That sounds like a throwback to those brutal 2022 lows or a potential retest if macro headwinds (think Fed hikes or BTC dominance spikes) hit hard. But here's the bullish thesis that's got me stacking: In this bull cycle, ETH ain't just recovering—it's primed to moon to $6,100+ by mid-2026. Why? Ethereum's ecosystem is firing on all cylinders: ETF inflows are pouring in, Layer-2 scaling (thanks to Dencun and Prague upgrades) is slashing fees, and DeFi TVL is exploding past $200B. Plus, restaking protocols like EigenLayer are locking up supply like never before. If BTC hits $150K
Risks? Yeah, crypto's volatile AF. If BTC dumps below $80K or regs tighten (SEC eyeing staking?), we could wick back to $1,780. But with 42% of experts saying "buy now" and ETF flows at record highs, the risk/reward screams LONG ETH. What do you think—$6,100 too conservative, or am I dreaming? Drop your takes below, smash that follow button for daily updates, and let's turn this prediction into profits. To the moon! #ETH #CryptoBull #TradingView

Weekly ETH possible fair value locatedIt is possible we going to have a up week. We may entering a bit longer down movement but there are always a relief rally.

