SELL ETH-USDT ETH-USD is currently moving from 2993 to 3132. if Eth breaks the support of 2967 we can see the price at 2851.
ETHUSD.P trade ideas

ETHUSD#ETHUSD - H1
📣 Upon analyzing the 1-hour timeframe, we expect that with the break of the descending trend in the range of 3165, there will be potential for price growth towards the range of 3375.
⛔ Stop Loss: 2990
On the other hand, with the break of the range of 2990, one can be optimistic about a price decline towards the range of 2600.
⛔ Stop Loss: 3165

ETH rejection or breakthrough at resistance $3131ETH is trying to break through FIB resistance at $3131.
If it gets rejected price is heading towards pointed Fib price target of $2831.
If it breaks through resistance price heading towards $3502


Eth 41624I'll be real here. Eth looks fried. It is breaking down against bitcoin as well. It appears to be putting in a lower high on usd pair and vs btc its toast. Its been on my mind and I really hope it doesnt. I do have some shitcoin positions still but not very much. Derisked weeks ago on the pumps and BTC dominance flexing
. Ethereum really needs to put in a long term base structure and find itself in this world. imho the merge and transition to stake model, completely screwed any potential it had. Its centralized garbage now. personally will not be heavy in any alts. THe only ones that could see something are the king of AI and that TAO. But the rest of the shitcoin market isnt looking so hot and really serves no purpose for society. Unless dominance really craters and starts to paint a bullish setup for alts im out.
Goodl luck eth maxis

$ETH Price Prediction 4/16/2024Late post but a possible double-bottom could be forming given the hold at 3k.
This could also just be a temporary push so we should look to flip the prior D1 marker (green).
imo I believe we're in for another correction but anything can happen in this market.
www.tradingview.com

(ETH) ETHEREUM "Two Options" -- The Red Doorttwo options as proposed in my graph based on the movement of Ethereum. It appears Ethereum has chosen to go through the red door this time around. Or, if it was because of Bitcoin so be it. When people refer to the news and justify financial actions based on those news events I tend to see those associations as flaky at best. The price of crypto was stated based on a large indicator of the TOTAL crypto chart to have a short. When the price fell and at the same time some news was happening, as if news isn't always happening, people have the tendency to associate big news events with the story of cryptocurrency, or whatever. This time around it was some other war. Personally, in my take, Iran was using their drones to prevent further missile attacks by Israel on Palestine. By forcing Israel to defend themselves against the drone attack this wastes many of their missiles in their artillery preventing those missiles used to defend themselves to be used as attack missiles.

The bull run is overNo new highs = seeking new lows.
RSI was overbought for far too long and will now have an equal and opposite reaction.
MACD averages trending down and long way to go.

ETH/USD: Dodging the 4K Rejection and Riding the RollercoasterHey there, crypto warriors! Get ready to dive back into the ETH/USD battleground – it's time for another epic trading update that'll make your heart race faster than a DeFi token pump!
So, let's rewind to our last analysis. We talked harmonics patterns, support zones, and resistance levels – all the good stuff. But guess what? The plot thickens, my friends!
Fast forward to today: We're facing some serious drama on the weekly charts. That's right, we gave the infamous 4K level a good old-fashioned rejection, sending us on a downward spiral. But fear not, brave traders – we're not out of the game just yet!
Taking a closer look at the charts, we're hitting some key Fibonacci levels like a boss. The shadow of the candle landed right on the 61% fib, and we're currently hovering above the 31% – talk about walking the tightrope!
Now, here's the million-dollar question: Are we ready to make a move? Well, it all depends on those cheeky daily candles. If they keep confirming support like they're supposed to, we might just be in for some bullish action. But hey, if you're not feeling it, there's no shame in waiting for another drop to that sweet, sweet 61% fib or even our initial entry point.
But hey, remember the golden rule of crypto trading: Buy the dip, hodl the moon! And hey, if all else fails, just blame it on Elon Musk – works every time!
So, here's to the brave souls riding the ETH rollercoaster – may your trades be profitable and your memes be dank!
Keywords: ETH/USD, trading update, Ethereum analysis, Fibonacci levels, support zones, resistance levels, volatility, risk management, cryptocurrency news, rollercoaster ride, trading strategies, investing, dollar-cost averaging, Elon Musk memes.

ETH: 3.5k next?ETH is trading at support right now. An hold here could catapult the price back to 3.5k. A loss of the 2.9k level could instead bring the price down to 2.7k before a recovery. Geopolitical situation doesn't help. Be careful with leverage.

Eth to 4800$Eth swept the highs and lows. Now, its time to be in eth buy 3000$ stops below 27500$ targetting $4800.
Bullish

Potential bullish reversal?Ethereum (ETH/USD) is trading close to the pivot which has been identified as an overlap support. Could this crypto-currency find support around this region before potentially bouncing higher towards the 1st resistance?
Pivot: 3,032.85
1st Support: 2,847.25
1st Resistance: 3,436.46
Risk Warning:
Trading Forex and CFDs carries a high level of risk to your capital and you should only trade with money you can afford to lose. Trading Forex and CFDs may not be suitable for all investors, so please ensure that you fully understand the risks involved and seek independent advice if necessary.
Disclaimer:
The above opinions given constitute general market commentary, and do not constitute the opinion or advice of IC Markets or any form of personal or investment advice.
Any opinions, news, research, analyses, prices, other information, or links to third-party sites contained on this website are provided on an "as-is" basis, are intended only to be informative, is not an advice nor a recommendation, nor research, or a record of our trading prices, or an offer of, or solicitation for a transaction in any financial instrument and thus should not be treated as such. The information provided does not involve any specific investment objectives, financial situation and needs of any specific person who may receive it. Please be aware, that past performance is not a reliable indicator of future performance and/or results. Past Performance or Forward-looking scenarios based upon the reasonable beliefs of the third-party provider are not a guarantee of future performance. Actual results may differ materially from those anticipated in forward-looking or past performance statements. IC Markets makes no representation or warranty and assumes no liability as to the accuracy or completeness of the information provided, nor any loss arising from any investment based on a recommendation, forecast or any information supplied by any third-party.

Apr.9-Apr.15(ETH)Weekly market recapLet’s first have a look on the current U.S. macroeconomy. Last Wednesday, the U.S. Department of Labor released CPI data for March. While the predicted value was higher than the previous value, the actual value was higher than the predicted value. This also means that the CPI will be worse than expected in the first four months of 2024. BTC and US stocks fell. With Federal Reserve officials and Biden promising to cut interest rates in 2024, market sentiment calmed down and BTC turned higher. However, the interest rate cut promised by officials was quite different from the June rate cut expected by the market at the time, and there would still be adjustments in the future.
As we mentioned in the previous recap, BTC remains fluctuating at a high level and other tokens are gradually weakening. If BTC cannot refresh ATH, the market may face a significant correction. Over the weekend, Iran's raid on Israel became the trigger for bulls to collapse.
We believe that BTC has safe-haven characteristics, but when too many chips are piled up at a high level, the safe-haven properties will be diluted. Risks begin to be released.
And that might not be a bad thing. BTC is about to undergo its fourth halving this week, and from a long-term monetary policy perspective, the bullish trend has not been ruined. Yesterday many Hong Kong asset management companies received approval to issue BTC spot ETFs, which will once again consolidate liquidity.
ETH broke below the given resistance level last week and then rebounded to near the support level. Unlike BTC, ETH is more vulnerable without the liquidity support of spot ETFs. After the Dencun upgrade, ETH has almost no special benefits. A large amount of locked and staked ETH will increase volatility.
During the weekend's decline, ETH's trading volume increased significantly, and you can clearly see that it is above historical averages. Although on the WTA indicator, the blue columns representing whales has also appeared, the bears have been confirmed over the weekend. The ME indicator maintains a bullish trend but is narrowing significantly.
In summary, we believe that ETH may maintain its decline this week. We lower resistance to 3700 and support to 2800.
Disclaimer: Nothing in the script constitutes investment advice. The script objectively expounded the market situation and should not be construed as an offer to sell or an invitation to buy any cryptocurrencies.
Any decisions made based on the information contained in the script are your sole responsibility. Any investments made or to be made shall be with your independent analyses based on your financial situation and objectives.

$ETH Price Prediction 4/15/2024ETH closes weekly just below the new goal line but with enough momentum to reach lower pattern boundary.
With retraction back to previous lows we are in position for a possible inverse head-and-shoulders recovery.
Look to maintain daily (1.5hrs) around 3090-3100. If not, expect a drop below 3k.
www.tradingview.com

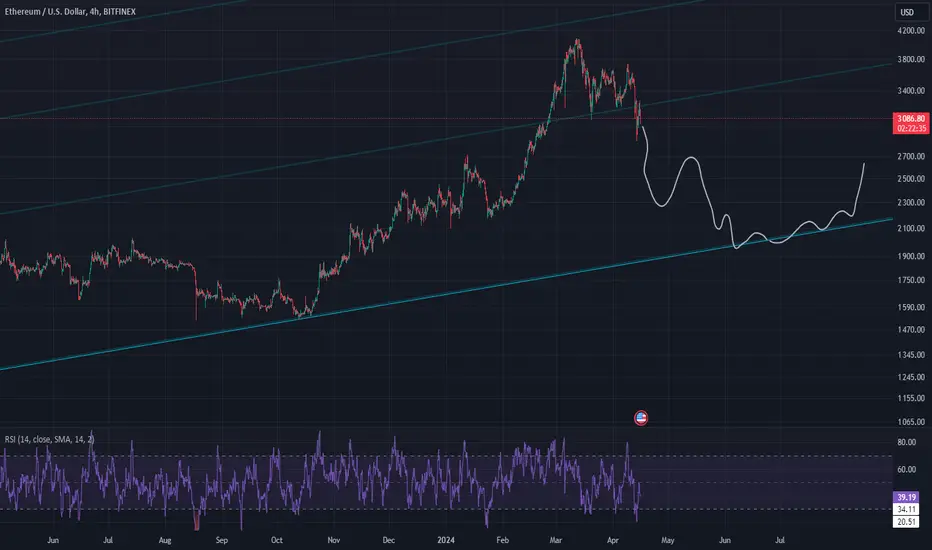
Ethereum is in decline. The short term case looks bearish.Eth will need to hold the trendline in light blue or else we should expect a deeper decline.
Ethereum: Next Target in FocusFor Ethereum, we have a new setup and anticipate that Wave ((i)) has completed at approximately $3,525. We now expect to see Wave ((ii)). We believe we are currently in a Wave (c) within Wave ((ii)), which should reach a retracement between 50% and 78.6%, equating to a range from $3,324 to a maximum of $3,175. Following this, we anticipate a rise to at least $4,092.

Ethereum (ETH/USD) Bullish Opportunity following Anti-Gartley Introduction:
In this technical analysis report, we will delve into the current market conditions of Ethereum (ETH/USD) and provide insights based on the formation of an Anti-Gartley Harmonic Pattern (XABCD). Our analysis aims to guide traders in making informed decisions regarding entry points, stop-loss levels, and potential profit targets.
Pattern Recognition:
ETH has exhibited the formation of an Anti-Gartley Harmonic Pattern (XABCD) on its price chart. This pattern suggests a bullish reversal is likely to occur, with point D serving as the anticipated starting point for an upward movement.
Key Levels:
- Entry: Near 3130
- Stop Loss: Near 2830
Analysis:
1. Entry Point (3130): Traders are advised to consider entry near the price level of 3130. This level aligns with the formation of the Anti-Gartley pattern and represents a strategic entry point for those anticipating a bullish movement.
2. Stop Loss (2830): To manage risk effectively, it is prudent to place a stop loss order near 2830. This level provides a buffer against potential adverse price movements and helps protect capital in the event of a reversal.
Profit Targets:
- TP-1 (3435): The first profit target is set at 3435. This level represents a significant resistance area where a partial profit-taking strategy may be considered.
- TP-2 (3700): The second profit target is identified at 3700, reflecting a higher resistance zone where further profit realization can be anticipated.
- TP-3 (3990): The final profit target is positioned at 3990, indicating a potential extended bullish move towards higher price levels.
Conclusion:
Based on the analysis of the Anti-Gartley Harmonic Pattern (XABCD) formation, Ethereum (ETH/USD) is poised for a bullish trajectory. Traders are advised to consider entry near 3130, with a stop loss at 2830, and profit targets at 3435, 3700, and 3990 respectively. As with any trading strategy, risk management remains paramount, and traders should adjust their positions accordingly based on market dynamics.
This analysis serves as a guide for traders seeking to capitalize on the potential bullish movement in Ethereum. It is essential to conduct thorough due diligence and monitor market conditions closely to optimize trading outcomes.

ETH WILL DUMP SOON TO 2100$ALL trading ideas have entry point + stop loss + take profit + Risk level.
hello Traders, here is the full analysis for this pair, let me know in the comment section below if you have any questions, the entry will be taken only if all rules of the strategies will be satisfied. I suggest you keep this pair on your watchlist and see if the rules of your strategy are satisfied. Please also refer to the Important Risk Notice linked below.
Disclaimer

ETH: IDEA USELESS FOR YOUHi guys, I have to draw some line but it's not an open idea, I'm sorry.
Don't take it for useful, I just use TradingView also to not forget some ideas.

Ethereum final moveLets see what ethereum has.
ETF coming, we don't know what can the SEC say.
Sometimes they tag ETH as a security, other times as an utility.
We will have to wait until the final date.
Please go up sir, mi familia

Around 3300$ is critically important for #ethereum #ethAs clearly seen in the chart, CRYPTOCAP:ETH is about to test a major resistance zone. Declination will be terrible. Daily closing above 3500$ will be great.

ETHUSDOn the 4 hour chart, we have a confirmed shift in markets structure indicating a bearish momentum is setting in. The forthcoming bitcoin halving is likely to affect other crypto currencies negatively. The expectation is that as the halving date approaches we will see a lot of selling pressure across the crypto market.

Potential bearish breakoutEthereum (ETH/USD) has made a bearish breakout through the pivot. Could the downward momentum potentially carry it lower towards the 1st support?
Pivot: 3,224.00
1st Support: 2,609.35
1st Resistance: 3,693.53
Risk Warning:
Trading Forex and CFDs carries a high level of risk to your capital and you should only trade with money you can afford to lose. Trading Forex and CFDs may not be suitable for all investors, so please ensure that you fully understand the risks involved and seek independent advice if necessary.
Disclaimer:
The above opinions given constitute general market commentary, and do not constitute the opinion or advice of IC Markets or any form of personal or investment advice.
Any opinions, news, research, analyses, prices, other information, or links to third-party sites contained on this website are provided on an "as-is" basis, are intended only to be informative, is not an advice nor a recommendation, nor research, or a record of our trading prices, or an offer of, or solicitation for a transaction in any financial instrument and thus should not be treated as such. The information provided does not involve any specific investment objectives, financial situation and needs of any specific person who may receive it. Please be aware, that past performance is not a reliable indicator of future performance and/or results. Past Performance or Forward-looking scenarios based upon the reasonable beliefs of the third-party provider are not a guarantee of future performance. Actual results may differ materially from those anticipated in forward-looking or past performance statements. IC Markets makes no representation or warranty and assumes no liability as to the accuracy or completeness of the information provided, nor any loss arising from any investment based on a recommendation, forecast or any information supplied by any third-party.
