Re-entry Long idea on ETHUSDBased on :
-quantitative analysis
-Volume analysis
-Option flow analysis
Trade ideas

ETHUSDT BULLISH MOVE34% pullback fully absorbed at prior breakout level ($2,250–2,300) that flipped to support • Daily EMAs never lost their bullish order — price only wicked below but closed above every day • Volume-backed reclaim of the entire ribbon today This is exactly how trending markets reset without breaking. Higher-timeframe bull market still 100% intact as long as $2,250 holds.
CRYPTOCAP:ETH BINANCE:ETHUSDT BITSTAMP:ETHUSD

Opportunities for market growth at the end of the yearToday we have reached a new major bifurcation point in the middle of the quarter, which I have focused on. For individual coins, starting in the middle of this week, the probability of a bullish quarterly candle reversal with large growth waves will increase, similar to RESOLV and TNSR. Such reversals will be facilitated by a slowdown in the fall of ETH with attempts to change the trend before the end of the year.
So far, the bearish influence has prevailed in the market, with the opening of most major periods below key resistances and stable sales until the middle of the quarter to consolidate below 3,500, which I will indicate in the latest review. The ultimate goal of the bears in this quarter is to test the range of 2500-2750, with an attempt to close the annual candle in it under a negative scenario, and against the background of consolidation below 3500, this goal is still relevant. By the end of the month, we may still see new sales impulses to break through 2750, but with increasing buying activity at the end of each week, against which individual coins will try to grow. The second half of the quarter for ETH opened below 3,250, which gives a signal for sales below 3,000 up to 2,500, but an opening above 3,100 is a technical signal for growth up to 3,500-4,100. The attempt to reverse the quarterly candle is also facilitated by its opening above 4,100.
And so, under an optimistic scenario and a stable transition to a reversal of the quarterly candle in the second half of the week, purchases can be expected until the end of the week, with the aim of opening a new week above 3250, which will ensure continued growth until the end of the month and the possibility of opening a new month with a growth signal before the end of the year. With less volatility, there is a chance of opening a new week below 3,100, which could lead to a reversal next week.
As I wrote in a review at the beginning of October, BTC opened the quarter negatively, with a pullback signal down to 90-100 k, which the bears successfully worked out. There is a large medium-term support in the 85-90k zone, from which a pullback is likely. In addition to the growth of the altcoin index and the growth of ETH/BTC, which I expect at the turn of the quarter, the slowdown in the decline of BTC will also cease to put pressure on the market and allow individual coins to show major reversals.
Brent may once again have quite a big impact on the markets. If today and tomorrow the price fixes above $ 64 and, moreover, above $ 65, then the probability of growth of the crypt will prevail until the close of the week. In the event of US manipulation and a sudden new wave of brent sales below $62.5 today or tomorrow, there will be a chance for an ETH reversal before the weekend. Given the released data on stocks in the United States, the probability of a positive scenario prevails. All markets are connected, and no matter how absurd it may seem at first glance, it was the background manipulation of the commodity price that allowed the bears to break through key supports on ETH more than once, both on October 10 at 4,100, and at the subsequent 3,500, 3,250 and 3,100. By superimposing the dynamics of brent in the second half of the week on the dynamics of ETH by the weekend, you can see a chain reaction. That is why by the second half of October, I predicted a drop down to 3,500 by the end of the week, in the event of a drawdown of brent to $ 60.
Against the background of a slowdown in the fall of ETH and attempts to reverse the quarter, it is possible to make regular toppings for individual coins. First of all, it is worth paying attention to TURTLE and MITO, which have strong technical signals for growth up to 0.21-25 in the medium term. So the potential is the ground for dynamics similar to RESOLV. VIC BMT HOOK CHESS also has slightly weaker technical signals for growth, which I am also considering working with in the first place. On an attempt to reverse the quarter, there is a high probability of their growth to 50-70%, at least with the aim of breaking the last monthly candle. In the case of a stable ETH reversal, growth impulses of up to 200%+ can be expected.
Similarly, growth waves of up to 40-50% may show weaker instruments that do not have obvious signals, but are in an extremely oversold zone, such as QUICK COS FIO DATA. In my opinion, these tools are candidates for the assignment of the monitoring tag, given the dynamics, and therefore I recommend using a small position when working with them.
In addition to the positive note towards the end of the year that has appeared at the moment, I would like to focus on the overall negative dynamics of the market, which may continue at the beginning of the year. The current likely pullback on the quarterly and annual candles is still a temporary phenomenon and gives opportunities to coins that have technical growth signals left earlier. Most of the market, after attempts to roll back the tops at the turn of the year, is likely to continue falling until the second quarter. That is, coins without obvious growth signals, especially those with large capitalization, may remain flat until January or February without significant purchases followed by a major break.

ETHEREUM(ETH/USD): Consolidation – The Silence of VolatilityEven though ⚠️ETHEREUM is trading in a bearish trend since October, 📉
The pair has been in a deep consolidation, since the last 3 days 🗓️
The price is currently testing a strong horizontal support level where the price is consolidating. ↔️
Because the trend is strongly bearish, chances will be high to see
a further bearish continuation. 🐻
Your reliable confirmation will be a breakout and a 4H candle close below the underlined support. 🕯️
The next goal for the sellers will be 2840 🎯
Alternatively, the market may continue consolidating and trading within the range. 🔄

ETHUSD: Outlook for the Upcoming DaysMonthly View:
The monthly timeframe remains bullish overall, but ETH has pulled back to gather strength. This kind of move is typical when the market is gearing up to break a higher high. The broader structure hasn’t shifted—this is simply a deeper retracement inside a bullish narrative.
Weekly View:
The weekly chart is showing a similar story. Price has been dropping consistently without giving even a single proper reversal. If ETH truly wanted to fall aggressively, it would normally make a move up first, trigger traders’ stop-losses near previous highs, and then dump. But this time, it didn’t do that.
This unusual behavior hints that the market may be preparing something different from what most traders expect.
Daily View:
The daily timeframe is where things get really interesting. ETH spent more than half the recent sessions moving sideways, collecting liquidity on both sides. After that, it dipped and formed a lower high—but that lower high hasn’t been broken yet.
According to my analysis, ETH is currently sitting in the Discount Zone, an area where buyers often start becoming active.
4-Hour View:
On the 4H chart, I already had a clean short setup earlier, but now I’m watching for signs of a potential reversal. That reversal idea is not guaranteed, though—it becomes invalid if ETH fails to break the series of lower highs.
There’s also another scenario: ETH might refuse to break the lower highs and begin forming higher lows at the same time. If that happens, we’ll see a period of sideways consolidation. When the breakout finally comes—whichever direction it chooses—the move is likely to be powerful.
Final Thoughts:
Based on my analysis, ETH is showing mixed but promising signals across the higher and lower timeframes. The monthly structure is still bullish, and this pullback looks more like preparation for a stronger push rather than a trend reversal. Weekly price action hasn’t shown any meaningful bounce yet, which is unusual—and that alone hints that the market might be setting up something unexpected.
On the daily chart, ETH has swept liquidity after moving sideways for quite a while, and now it’s resting in the Discount Zone, where smart money usually becomes active. The 4H timeframe already gave clean short opportunities earlier, but now the market is approaching a point where a reversal could begin—unless lower highs remain untouched.
If ETH starts forming higher lows without breaking lower highs, the market will likely slip into a compression phase. When price finally breaks out of that squeeze, the move—up or down—can be very strong.
Again, this is just my personal viewpoint. Please do your own analysis before investing. Your profits and losses are entirely your responsibility—I’m only sharing what the charts are suggesting to me right now. Stay alert to the reaction levels ahead; that’s where the next major direction will reveal itself.
----------------------------------------------------------------------------------------------
Thanks for checking out this analysis! If you enjoyed it, hit that follow button so you don’t miss future updates. And if this breakdown helped you out, drop a like 👍 and share your thoughts in the comments 💬—I always appreciate the feedback!

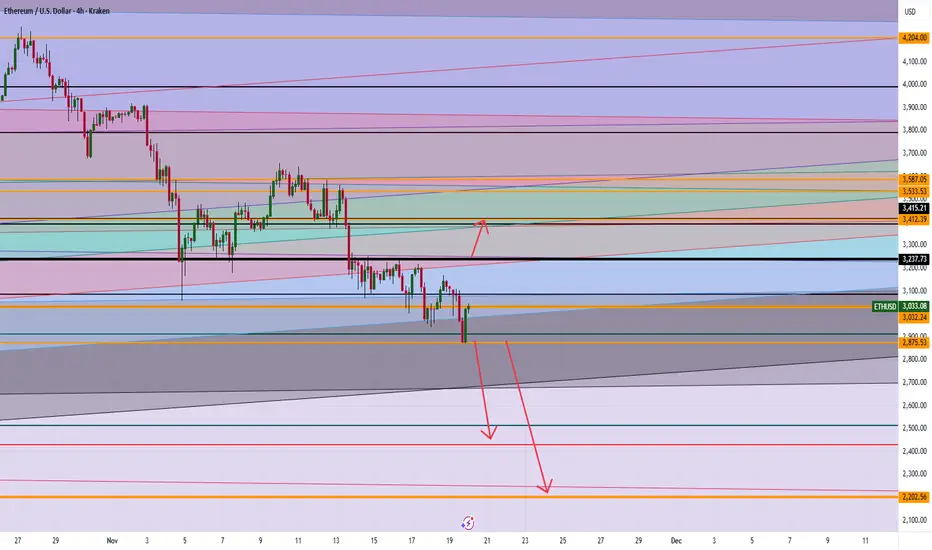
ETH Breakout Levels: Is $3,600 Next or Will Ethereum Crash to $2If ETH holds above 3237, clear momentum targets the 3400 range, with further upside potential toward 3500–3600 if buyers keep control.
A sustained break below 2875 opens the path to 2500, and possibly deeper toward 2200 on heavy selling pressure.
Any questions send me a DM
ETH BUY?Market Overview:
The overall trend remains bullish on both the daily and weekly timeframes.
Daily Outlook:
On the Daily timeframe, the market appears to be forming a potential reversal pattern, indicating a possible continuation of the broader bullish move. Should the current support level hold, we could see buyers gaining momentum and pushing prices higher.
Disclaimer:
Please be advised that the information presented on TradingView is solely intended for educational and informational purposes only.The analysis provided is based on my own view of the market. Please be reminded that you are solely responsible for the trading decisions on your account.
High-Risk Warning
Trading in foreign exchange on margin entails high risk and is not suitable for all investors. Past performance does not guarantee future results. In this case, the high degree of leverage can act both against you and in your favor

$ETH Bottom Vibes: Strong Bullish Div on the DailyCRYPTOCAP:ETH is giving potential bottom signs. While the next seemingly bearish-minded zone of liquidity is between 2500-2700. However, I disagree. There is a sneaky zone of accumulation that CRYPTOCAP:ETH bulls and bears battle between 2800-3100. See the tan colored box on my chart.
Next, you can see a Strong Bullish Divergence on the daily chart for CRYPTOCAP:ETH with the RSI.
Last, there is a subtle, yet technically significant Falling Wedge Pattern forming up on the chart of $ETH. Meanwhile the fear is nearly at an all time high and the market awaits NVDA and AI performance. Earnings came in in the GREEN.
I typically try to think different than the "crowd think". So if the bottom is here it would front run so many people who want to purchase ETH in the 2500-2700 range. Makes sense to me.
The sentiment checks out for bottom vibes (like the CMC Greed and Fear Index at a 15 yesterday) combined with 1 very strong technical indicator (strong bullish divergence on the 1 Day chart) right in the middle of a sneaky zone of accumulation.
Let's see. NFA

ETH PERPETUAL TRADE BUY SETUP Long from $2880ETH PERPETUAL TRADE
BUY SETUP
Long from $2880
Currently $2880
Targeting $2980 or Above
(Trading plan IF ETH
go down to $2830 will add more longs)
Follow the notes for updates
In the event of an early exit,
this analysis will be updated.
Its not a Financial advice

ETHEREUM Thoughts - Potential Bottom front running the majority CRYPTOCAP:ETH has experienced a blood bath this month but I believe a potential bottom could be forming here. It really relies on several factors:
- CRYPTOCAP:BTC
- NASDAQ:NVDA
- Market wide sentiment
However, through technical analysis and hours of staring at this chart the past few weeks, I am spotting some interesting signs of life for a true bounce. I detail those in my video.
Spoiler Alert: Looks like a STRONG BULLISH DIVERGENCE is forming on the CRYPTOCAP:ETH daily chart - lets pay attention and see if the NASDAQ:NVDA earnings affect the price like I think it may...

ETH Long - Golden Pocket BITSTAMP:ETHUSD is very oversold and showing signs of a short squeeze building on the 4 hour chart. Almost all long liquidity was wiped around 2920 area ($1.3BB on hyper liquid) and there is currently a large cluster of short liquidations around $3120, so it should start to head that direction and cascade up from there until we reach the golden pocket.
There are plenty of macro headwinds, including NASDAQ:NVDA earnings after the bell today that could easily compromise this outlook in the short-term but I believe we will push higher from here. Even if we wick lower in the short-term, I believe that it's close enough to a bottom to enter here with a stop below LOD and some put options to hedge.

Why my ETH Holding has grownIn my last ETH update when the price was at $1700 and it looked as if the world was crashing, I mentioned I thought ETH was going to set a new ATH and so far it did but not at the price area I was expecting. I also did mention that I expected a return to around $3000 which is close to where it currently is.
All that said, I have had more time to look at the ETH chart and I think I may have been less bullish than I should have and as a result I grew my ETH holding since then. A few things I would like to point out.
One of which I mentioned in my last update. Looking at the ETH chart, it looks too similar to the gold chart with the ABC shakeout that gold went into before the massive rally.
Imagine holding GLD from Aug 2023 and selling in Oct 2023 because you could no longer handle the pain at this point below?
Now imagine those that held during this time, the fear and uncertainty they would have gone through. Personally, I think that is what the bookmakers are doing to ETH holders. If you believe the narrative that every asset will be tokenized and it ETH is the most trusted, then it makes sense to shake as many people out as possible before the GLD like rally.
Secondly, (although its a toss up) the action ETH is displaying now is similar to that of 2018 to 2020 and that we are in Sep-Oct of 2020 as you can see from the main chart and below as well.
Finally, the one bearish scenario is that we are doing the gold option but that we fail like this stock (PSNL) once we go and set a new ATM from here.
I had noticed the-same gold pattern and traded it but luckily I sold just before the failed breakout (so far) and you can clearly see the ABC pattern exactly like GLD before the breakout.
This is not a financial advice and I am not asking you to buy ETH. Just my opinion.
Please like, share and leave a comment.

ETHUSDNote that these analyzes are only for recording personal accounts and journals that will be reviewed in the future.
Please do not enter into any trade just by viewing the analysis, thank you.

ETH going to fill the gapETH is filling the imbalance left, while BTC is in the POI. this could be a reversal point to switch back up

EthereumETHUSD
- Completed " 12345 " Impulsive Waves
- Consolidation Phase as an corrective pattern in Short Time Frame
- Break of Structure
- RSI - Divergence
- Change of Characteristics

ETHUSD | 1-Hour Bullish Continuation Concepts: ICT | SMC | Bill Williams | RR > 2:1
ETH is setting up for a significant bullish move on the 1-hour chart. After a clear sweep of sell-side liquidity, price has shown strong displacement and is now coiling above a key support confluence, suggesting a continuation toward the range high is likely.
ICT & SMC Analysis:
Liquidity Sweep & FVG: The wick down to $3,069.1 constituted a clear sweep of sell-side liquidity. The powerful bullish candle that followed created a significant Fair Value Gap (FVG) and a Bullish Order Block.
Market Structure Shift (MSS): The break above the recent swing high at $3,090.9 confirmed a shift from a ranging/downward structure to a bullish one.
Mitigation & Retest: The current pullback is retesting the confluence of the FVG, the Order Block, and the Alligator, offering a high-probability long entry.
Bill Williams’ Alligator Confirmation:
The Alligator on the 1-hour frame confirms the bullish bias:
Lips (3,078.4) > Teeth (3,079.5) > Jaw (3,079.8)
The alignment is bullish, and price holding above the Lips indicates the trend is awake and active. We are looking for the next impulsive leg to begin from this support.
Trade Plan (1-Hour Setup):
🟩 Entry Zone: $3,077 - $3,082 (Confluence of FVG, Order Block, and Alligator support)
🔴 Stop Loss: $3,068 (Below the recent liquidity sweep low)
🎯 Take Profit: $3,258 (Major previous high and a key liquidity pool on the 1H/4H chart)

“Ethereum Support Retest & Bullish Reversal Setup”Ethereum is retesting the key support zone after a bearish move, holding above the trendline. If the support holds, price may bounce toward the next target at 3,150, following the projected upward move. BOS levels and trendline interactions highlight potential bullish continuation.

#ETH/USDT : Rebound Setup from ascending channel Support#ETH
The price is moving within an ascending channel on the 1-hour timeframe and is adhering to it well. It is poised to break out strongly and retest the channel.
We have a downtrend line on the RSI indicator that is about to break and retest, which supports the upward move.
There is a key support zone in green at the 2930 price level, representing a strong support point.
We have a trend to stabilize above the 100-period moving average.
Entry price: 3064
First target: 3100
Second target: 3168
Third target: 3260
Don't forget a simple money management rule:
Place your stop-loss order below the green support zone.
Once you reach the first target, save some money and then change your stop-loss order to an entry order.
For any questions, please leave a comment.
Thank you.

Ethereum Accumulates Below Key ResistanceFenzoFx—Ethereum remains bearish, trading near $3,078.00. Price is below $3,170.00, with a bearish fair value gap overhead and resistance at $3,371.00. Technical indicators show an oversold market with bullish divergence, and candlestick patterns suggest accumulation around this zone.
Despite the bearish setup, a short-term rise may occur to grab liquidity before the downtrend resumes. In this case, Ethereum could target the bearish gap and resistance at $3,371.00.

ETH: Might have another chance to long!Hello Traders .
okay, this was the volume profile of ETH of the Binance! Any reaction to it could activate our buy option!

Don't sell your Ethereum !!!CRYPTO:ETHUSD
Based on my analysis of the historical context and the global macro-economy, I believe there is still room for growth. This is particularly true with the upcoming interest rate decision meeting on December 10th, which is anticipated to potentially bring a positive surprise. Furthermore, the end of the government shutdown, which had previously clouded the outcomes, adds to this outlook.
Personally, I see a spark of hope, and this is corroborated by my technical analysis using Elliott Waves. As you can see in the chart analysis, it suggests we still need one final, fifth impulsive wave before a bear market begins.
This is not financial advice, just my personal opinion.

ETH 4H – Potential Major Accumulation FormingWith recent price action, I am seeing what maybe an accumulation happening on the 4 hour chart, flipping my original bias from redistribution. Price is just above a major Preliminary Support level at $2450 and has been forming a large descending channel/wedge. The most recent down swing responded with a sharp wick, which aligns with the Selling Climax. Price then had an Automatic Reaction and since then has returned with a Secondary Test.
If this is correct, we may be entering Phase B of accumulation, where we can see an Upthrust move before absorption of seller continues below.
Why This Looks Like Accumulation
The market is still making lower lows in price, but the internal strength is not confirming those lows. This is typical behavior in Accumulation Phase B/C, where supply exhausts while price drifts downward.
Key supporting signals:
1. Delta Behavior
Recent down-legs have shown declining sell delta, meaning sellers are pushing price lower but with noticeably less aggression. This weakening of effort vs. result is a classic precursor to a terminal action such as a Spring or major ST.
2. Dual RSI Divergences
The RSI indicator here is split into two components:
• Purple = Relative Strength of Price
• Teal = Relative Strength of Volume
Across the most recent lows:
• Price made lower lows
• RSI-price made slightly higher highs and higher lows
• RSI-volume showed a mixed but rising structure, making both higher highs and higher lows on the internal swings
This is important because it shows momentum decoupling from price. When both price-strength and volume-strength diverge upward while price drifts downward, it often signals that the market is absorbing supply rather than breaking down structurally.
3. Volume Tapering
Each push lower has occurred on gradually diminishing volume, and even the bearish expansions lack the signature spike you typically see in distribution breaks. This behavior aligns with absorption, not aggressive continuation.

Bearish continuation for ETHEREUMRetracement from new lows
Retest of the head and shoulders neckline
New lows incoming in the next weeks
