ETHUSD | This is not gambling...but surely a high risk setupLooks like ETH is completing a corrective complex (a b c d e) wave into a channel. The current push wave (c) suggests an exhaustion point. This is not gambling, its just probabilities.
If the structure plays out, ETH may begin a correction toward the FVG + fib retracement zone before extending into the channel bottom.
This is a high-risk setup. Because it is a counter-trend. And it depends on rejection from the upper boundary.
A breakout above $3115 will invalidate this setup.
Good Luck!
Trade ideas

ETHUSDT SELL POSITIONEthereum is currently under strong selling pressure, and with the price hovering around $3,000, it could easily drop back below $2,600. However, for a more reliable entry, the 4-hour timeframe gap around $3,250–$3,350 offers a much better zone to look for a sell position.
If price reaches this area with a strong and impulsive move, there is a high probability (over 70%) that this sell setup will play out successfully. But if Ethereum approaches the $3,300 zone with weak momentum, the trade becomes a bit more risky, and the setup may require further confirmation before entering.

Bearish reversal?Ethereum (ETH/USD) is rising towards the pivot and could reverse to the 1st support.
Pivot: 3,203.88
1st Support: 2,725.92
1st Resistance: 3,681.97
Disclaimer:
The opinions given above constitute general market commentary and do not constitute the opinion or advice of IC Markets or any form of personal or investment advice.
Any opinions, news, research, analyses, prices, other information, or links to third-party sites contained on this website are provided on an "as-is" basis, are intended to be informative only, and are not advice, a recommendation, research, a record of our trading prices, an offer of, or solicitation for, a transaction in any financial instrument and thus should not be treated as such. The information provided does not involve any specific investment objectives, financial situation, or needs of any specific person who may receive it. Please be aware that past performance is not a reliable indicator of future performance and/or results. Past performance or forward-looking scenarios based upon the reasonable beliefs of the third-party provider are not a guarantee of future performance. Actual results may differ materially from those anticipated in forward-looking or past performance statements. IC Markets makes no representation or warranty and assumes no liability as to the accuracy or completeness of the information provided, nor any loss arising from any investment based on a recommendation, forecast, or any information supplied by any third party.

ETHUSD Bull Trap? - Final Breakdown Setup Is Almost Locked InETH is still stuck inside a clear falling channel, and the entire pattern is behaving like a corrective downtrend. The recent bounce from 2620 looks sharp, but it’s still just a counter-trend move. Nothing here screams trend reversal yet.
Wave 3 ending at 2620 , and now the price is rising for a Wave 4 retracement. Wave 4 usually moves back toward the mid-channel and tests previous breakdown zones.
The red box around 3200–3300 is the key trap zone. This is where sellers can return because Wave 4 must not enter Wave 1 territory, which sits higher. As long as ETH stays under that invalidation level, the bearish structure remains fully intact.
The move looks like a classic (a)-(b)-(c) correction inside Wave 4. Once this corrective bounce completes, the chart suggests ETH will resume the downward path. The channel alignment and wave symmetry both support a final Wave 5 drop.
If the bearish count plays out, ETH could slide toward 2400 – 2300 in Wave 5 before a major bottom forms. That’s the zone where sellers exhaust and buyers take control again. Until ETH breaks the invalidation level with strength, downside remains the more probable outcome.
Stay Tuned!
@Money_Dictators

Ethereum Relative Strengthening to Bitcoin going into FOMCWhen ETHBTC breaks out of the trendline it's been a good indicator for further ETHUSD upside. Let's see a strong confirmation signal out of this downward trendline from October this year going into the last FOMC meeting of 2025 this week.

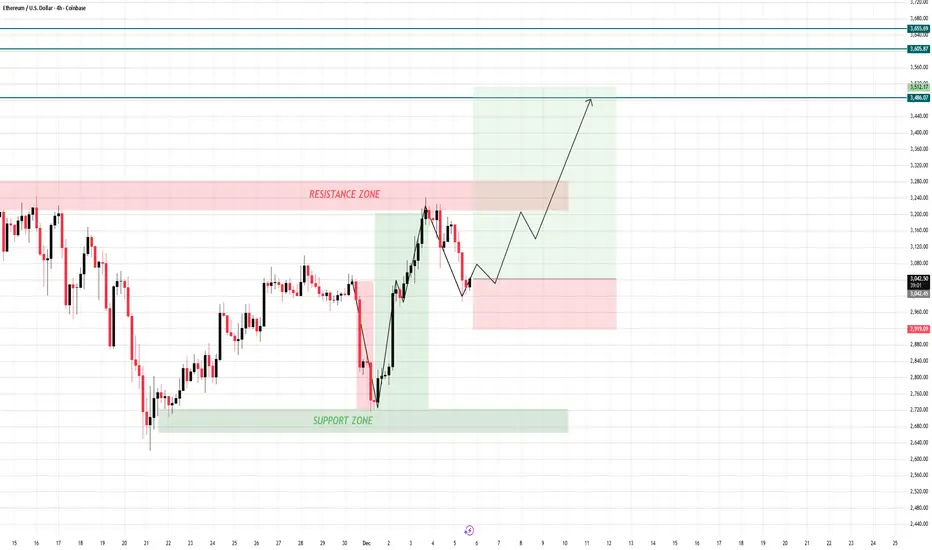
The Trap Is Set — Ethereum Preparing for Liftoff🚀 ETHEREUM 4H OUTLOOK – ACCUMULATION BEFORE BULLISH EXPANSION
1. Market Structure Overview
- ETH is currently respecting the broader bullish structure after rejecting from the upper Resistance Zone (≈ 3,180–3,220) and pulling back into the mid-range.
- The recent drop is not a reversal; it is a healthy retracement into demand after an impulsive rally.
- Price is now stabilizing above the Support Zone (≈ 2,940–2,970) — the key area that previously launched a strong bullish leg.
✔ The trend remains bullish on higher timeframes
✔ Current structure shows a corrective pullback into liquidity
✔ Bullish orderflow still intact as long as support holds
2. Scenarios Ahead
🔹 Main Scenario (High Probability) – Bullish Continuation
If price holds above the support area and continues forming higher lows:
→ ETH is expected to bounce and build structure toward the upside.
Upside Targets:
🎯 3,460
🎯 3,605
🎯 3,655 (major liquidity + extended target)
The drawn projection on your chart (higher low → stair-step structure → rally) is perfectly aligned with bullish continuation.
🔹 Sub Scenario (Low Probability)
If ETH breaks below 2,940, structure shifts short-term bearish:
→ Deeper pullback into 2,850 – 2,880
→ Only triggered if a clean break + close below support happens.
Currently, there is no confirmation for this scenario.
3. Summary – Structure & Liquidity Alignment
ETH continues to follow a textbook bullish model:
✔ Corrective pullback into demand
✔ Accumulation above support
✔ Clean rejection from supply, but no trend reversal
✔ Bullish projection remains valid toward liquidity clusters above
The move is simply compression → accumulation → expansion.
4. Intraday Trading Setups (Based on Chart Structure)
📌 SETUP 1 – Intraday Buy Setup (Preferred Scenario)
ETH BUY ZONE:
👉 2,940 – 2,970
Take Profit:
🎯 3,120 – 3,180 (short-term)
🎯 3,460 – 3,605 (swing)
Stop Loss:
❎ 2,915
⚠ Manage risk properly — crypto volatility is high.
📌 SETUP 2 – Intraday Sell Setup (Only for Countertrend Traders)
ETH SELL ZONE (Resistance):
👉 3,180 – 3,220
Take Profit:
🎯 3,050 – 3,000
Stop Loss:
❎ 3,245
⚠ Countertrend trades should use smaller sizing.
Stay patient. The market always rewards those who wait for price to come to their zone — not those who chase it
ETHEREUM to 15kCan Ethereum rally like it did from April to August 2025, or is this an inverse head and shoulders that could take it to 15k?

$8,000 (ETH) Inverted Head & Shoulders + Fibonacci Extension!(ETH) - Inverted Head & Shoulders Reversal Forming with the Measured Move Reaching Around $8,000
(ETH) Fibonacci Extension Reaching Around $8,000
(ETH) Leads & Alts Follow!
IN $3,025.00

ETH long🔥 Ethereum is gearing up for a major move. Market sentiment is shifting bullish, with strong accumulation and renewed interest from big players. The narrative is clear: ETH is positioned as the backbone of decentralized finance and smart contracts, and demand is building. Traders are eyeing this as a breakout play — Ethereum looks ready to fly.

ETH LONG Price has completed a textbook bullish market structure shift (MSS) after sweeping significant sell‑side liquidity below the $3,069 level. Following the displacement, price is now in a pullback phase, retesting the newly formed support zone and Fair Value Gap (FVG). This is a high‑quality ICT long setup for continuation toward the recent swing highs.
• Direction: Long
• Entry Zone: 3,135 – 3,145 (retest of FVG support & previous resistance turned support)
• Stop Loss: 3,049 (below the swept low and bullish order block)
• Target: 3,400 (previous high + equal legs projection / HTF liquidity pool)
• R/R: High‑quality expansion setup – risk is well‑defined below the liquidity sweep, reward offers a clear path to the next major liquidity zone.
Key ICT/SMC Observations:
Clear sell‑side liquidity sweep below $3,069 followed by a strong displacement candle.
Bullish Market Structure Shift (MSS) confirmed with a higher high and higher low.
Price is now retracing into the Fair Value Gap (FVG) created during the initial rally, offering a premium entry.
The 3,135–3,145 zone now acts as a support confluence (FVG + previous resistance).
Bias remains bullish above the swept low. A reaction from the 3,135–3,145 support zone will signal buyers are in control, targeting the 3,400 liquidity area for the next leg up.
Trade at your own risk. Manage size and always use a stop.

ETHUSD Moon IdeaUsing prior tops and lows an expanding structure can be drawn with price hopefully looking for the top of this structure to touch again
I think the pump will be very fast compared to how BTC has recently rose
Weekly timeframe

ETH: Upward!Ethereum has managed to rise towards the $3,100 level in recent hours. We still assign a 40% probability that, as part of blue wave alt.(b), ETH will move above resistance at $3,656 before selling off into our green Target Zone between $2,228 and $1,789. In our primary scenario, we also expect ETH to reach this zone—potentially without first exceeding the $3,656 level. In either case, once ETH enters the Target Zone, we anticipate a corrective rally, which should top out within the red Target Zone ($5,805 – $7,326) at the high of magenta wave (B).

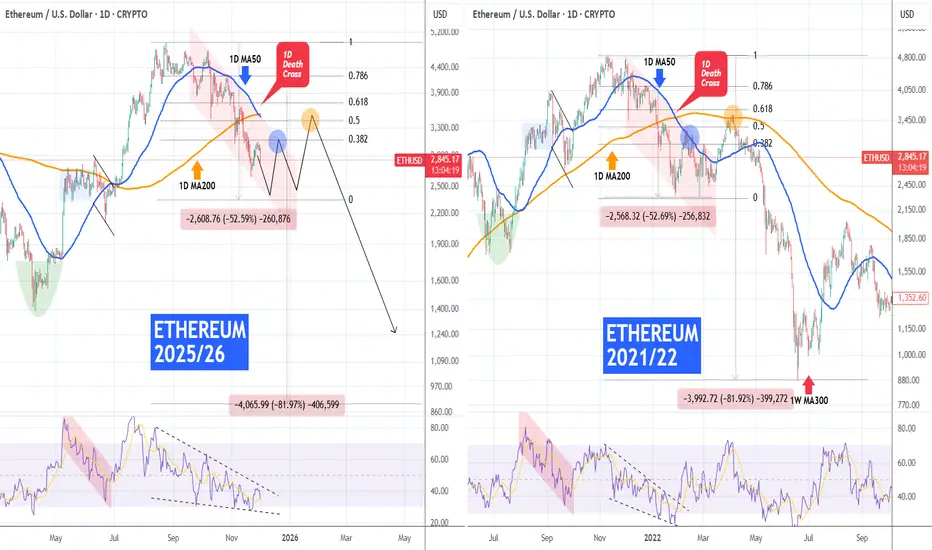
ETHEREUM made 1D Death Cross. Will it follow the 2022 BearCycle?Ethereum (ETHUSD) completed on Saturday its first 1D Death Cross in 9 months (since February 28 2025) and today the market is (so far) reacting violently to it with a strong sell-off.
The market didn't even manage to re-test its 1D MA50 (blue trend-line) on last week's rebound and if it follows the 2022 Bear Cycle, it may look for a bottom after completing a -52.50% decline from its Cycle Top. Technically, even the build up to the Cycle Top resembles the 2021/22 fractal and as you can see the similarities are even evident on their 1D RSI sequences.
As a result, if this 1st Bear Cycle wave for ETH bottoms around $2400, we could be expecting a first rebound to test the 1D MA50 (within the 0.382 - 0.5 Fibonacci range, i.e. around $3100) and get rejected, followed by one last to test the 1D MA200 (orange trend-line), within the 0.5 - 0.618 Fibonacci levels (i.e. above $3350) and get rejected to start the 2nd wave of the Bear Cycle.
Would you 'trust' this Bear Cycle build up?
---
** Please LIKE 👍, FOLLOW ✅, SHARE 🙌 and COMMENT ✍ if you enjoy this idea! Also share your ideas and charts in the comments section below! This is best way to keep it relevant, support us, keep the content here free and allow the idea to reach as many people as possible. **
---
💸💸💸💸💸💸
👇 👇 👇 👇 👇 👇
Ethereum - Weekly Bullish Flip Above $3KEthereum Structural Reversal Complete: Weekly Candle Confirms $3000+ Hold, Targeting $4900 with $7160 Extension
Ethereum has completed a significant structural reversal with weekly candle confirmation above the critical $3000 psychological level. The 0.618 Fibonacci retracement has held on the weekly timeframe, creating a multi-month setup targeting previous highs at $4900, with extended targets reaching the 1.618 Fibonacci extension at $7160.
🎯 Setup Overview:
Current Status: Weekly bullish reversal confirmed above $3000
Critical Level: $3500 close needed to confirm continuation
Intermediate Target: $4900 (previous cycle highs)
Extended Target: $7160 (1.618 Fibonacci extension)
Position Type: Spot portfolio addition for long-term hold
📊 What Just Happened:
The Weekly Flip:
Ethereum's weekly candle closed decisively above $3000, marking the first sustained hold above this psychological level after months of consolidation and testing. This isn't a wick or a brief spike it's a confirmed close on the weekly timeframe, which carries significantly more weight than intraday or daily moves.
The 0.618 Support:
The 0.618 Fibonacci retracement level (calculated from cycle lows to previous highs) has held throughout the recent consolidation period. This golden ratio level marks where deep corrections in bull markets typically find support before resuming uptrends.
Momentum Shift:
Weekly momentum indicators have flipped from bearish to bullish. The reversal isn't just price it's confirmed by:
Volume expansion on the breakout
Momentum oscillators crossing into bullish territory
Market structure shifting to higher lows
📈 Why $3500 Is The Key Level:
The Gate to Higher Prices:
A weekly close above $3500 would accomplish several technical objectives:
Break above intermediate resistance that capped prior rallies
Confirm the $3000 level as support rather than temporary bounce
Open clear path to retest previous highs at $4900
Signal institutional accumulation phase is complete
Historical Context:
$3500 previously acted as both support (before the decline) and resistance (during recovery attempts). A clean break and hold above this level represents role reversal—former support becomes resistance becomes support again.
Why Weekly Matters:
Daily closes can be manipulated or result from short-term volatility. Weekly closes represent sustained conviction from market participants and institutional positioning that persists across multiple trading sessions.
🎯 The Target Structure:
Phase 1: $4900 (Previous Highs)
Represents the prior cycle peak
~62% upside from current $3000 level
Major psychological resistance where profit-taking will occur
First logical target for position reduction
Phase 2: $7160 (1.618 Fibonacci Extension)
Long-term extension target based on geometric progression
Represents 138% upside from $3000
Aligns with potential new cycle highs
Final target for remaining position
Why These Targets:
Not arbitrary price predictions geometric extensions based on:
Historical price structure
Fibonacci ratios that have guided ETH throughout its history
Measured moves from confirmed support levels
Previous cycle behavior patterns
📊 Technical Confluence:
Weekly 0.618 Fibonacci:
This deep retracement level held as support, indicating strong hands accumulated the pullback. When 0.618 holds, the probability of continuation to previous highs increases significantly based on historical crypto cycles.
$3000 Psychological Level:
Round numbers matter in crypto. $3000 represents a major psychological threshold that attracts both retail and institutional attention. Holding above this level shifts sentiment.
Volume Confirmation:
The move above $3000 occurred with increasing volume, suggesting accumulation from larger players rather than retail FOMO. Sustainable moves require volume validation.
Market Structure:
Higher lows are now establishing on the weekly chart. This is textbook uptrend structure after a corrective phase completes.
🛡️ Spot Portfolio Addition Strategy:
Why "Spot" Matters:
This isn't a leveraged trade or short-term speculation. This is spot accumulation for a multi-month to multi-year position. Key differences:
No liquidation risk
Can weather volatility without forced exits
Designed to capture structural moves, not daily swings
Appropriate for long-term asymmetric bet on crypto adoption
Position Sizing:
Crypto allocation should be sized according to:
Personal risk tolerance (typically 5-10% of portfolio max)
Ability to withstand 30-50% drawdowns without panic
Long-term conviction in Ethereum's utility and adoption
Understanding this is a high-risk, high-reward allocation
Entry Approach:
Primary entry: Current $3000+ zone (confirmed support)
Additional entry: Pullback to $3200-3300 if opportunity presents
Final add: On confirmed break above $3500 (momentum confirmation)
This staged approach improves average entry while maintaining conviction.
📈 Why Ethereum for Long-Term Hold:
Fundamental Backdrop:
Ethereum 2.0 transition to proof-of-stake complete
Growing DeFi ecosystem with real utility
NFT and tokenization infrastructure
Institutional adoption increasing (ETFs, corporate treasury)
Deflationary tokenomics post-EIP-1559
Market Position:
ETH represents the second-largest cryptocurrency by market cap with established network effects, developer activity, and institutional recognition.
Risk Acknowledgment:
Crypto remains highly speculative and volatile. Regulatory uncertainty, technological risks, and market sentiment shifts can cause dramatic price swings unrelated to technical structure.
🧠 Why Most Will Miss This Setup:
Fear from Past Pain:
Many traders were hurt during the drawdown from previous highs. That emotional scar makes re-entry uncomfortable precisely when risk/reward is most favorable.
Waiting for "Confirmation":
By the time $4000 or $4500 "confirms" the move, the best risk/reward is gone. Entry at $3000 with $2700 stop offers far superior asymmetry than entry at $4000 with $3500 stop.
Disbelief After Consolidation:
Long consolidation periods create disinterest. When breakouts finally occur, many aren't watching anymore yet these are often the highest-probability setups.
Recency Bias:
Recent sideways action makes traders assume more sideways action. Weekly timeframe reversal suggests the character of price action is changing.
📊 Fibonacci Extensions Explained:
Why They Guide Long-Term Moves:
Fibonacci extensions (1.272, 1.618, 2.618) project where impulse waves typically complete based on the size of previous moves. The $7160 target (1.618 extension) isn't random—it's a mathematical projection.
Historical Validation:
Throughout crypto history, major bull moves have repeatedly respected these extension levels. Bitcoin, Ethereum, and other major assets have demonstrated this pattern across multiple cycles.
How to Use Them:
Identify completed corrective structure (0.618 support held)
Measure from correction low to breakout high
Project extensions for potential targets
Use these as profit-taking zones, not guaranteed destinations
📅 Timeframe Expectations:
Multi-Month Position:
From $3000 to $4900 could take 3-6 months depending on momentum and broader crypto market conditions. This isn't a swing trade—it's a position trade.
From $4900 to $7160:
If achieved, this extension could take 6-12+ months and likely requires favorable macroeconomic conditions and continued crypto adoption narratives.
Volatility Acceptance:
Expect 15-25% pullbacks even within a bull move. Spot positions can weather this; leveraged positions cannot. This is why spot allocation matters.
⚠️ Risk Factors:
Crypto Volatility:
30-50% drawdowns are normal in crypto, even during bull markets. Position sizing must accommodate this reality without forcing emotional exits.
Regulatory Uncertainty:
Government actions on crypto regulation, particularly in major markets like the US and EU, can cause rapid sentiment shifts.
Macro Environment:
Crypto correlates with risk assets. Fed policy, recession fears, and liquidity conditions affect crypto prices significantly.
Technical Failure:
If Ethereum closes back below $2700 on a weekly basis, the 0.618 support thesis breaks and the bullish structure is compromised. This requires disciplined reassessment.
$3500 Rejection:
Price could fail at $3500 and consolidate longer before attempting higher targets. Patience required if this scenario plays out.
🏆 The Long-Term Investor Approach:
They Buy Structure, Not Hype:
The weekly 0.618 hold + $3000 breakout provides objective structure. No need for hopium just probability-based positioning.
They Size Appropriately:
5-10% crypto allocation allows exposure to asymmetric upside while containing downside to manageable levels if thesis fails.
They Think in Cycles:
Crypto moves in multi-year cycles. Current positioning is for the next expansion phase, not next week's price action.
They Scale Out at Targets:
Reduce 1/3 at $4900 (books significant profit, removes emotion)
Reduce 1/3 at $5800-6000 (locks more gains if extension occurs)
Final 1/3 at $7160 or trailing stop (maximizes upside while protecting capital)
📌 Key Takeaways:
✅ Weekly confirmation matters: Daily noise is filtered out; weekly close above $3000 signals structural change.
✅ 0.618 support held: This Fibonacci level has historically marked the end of corrections in crypto bull markets.
✅ $3500 is the gateway: Close above this level opens clear path to retest $4900 highs with minimal resistance.
✅ $7160 represents geometric extension: Not speculation mathematical projection based on Fibonacci ratios that have guided ETH historically.
✅ Spot allocation appropriate: Long timeframe, high volatility, and asymmetric potential make this a spot hold, not a leveraged trade.
⚠️ Important Disclaimers:
This analysis is for educational purposes and reflects a technical view based on weekly timeframe structure, Fibonacci analysis, and crypto market cycles. It is not financial advice or a recommendation to buy or sell Ethereum or any cryptocurrency.
Cryptocurrencies are highly speculative and volatile. Price can drop 30-50% in days regardless of technical structure. The $7160 target represents a mathematical extension, not a guaranteed destination.
Regulatory risk, technological vulnerabilities, and market manipulation are inherent to crypto markets. Past cycle behavior does not guarantee similar patterns will repeat.
The 0.618 support could fail. If Ethereum closes below $2700 on a weekly basis, the bullish thesis is compromised and requires immediate reassessment.
Only invest capital you can afford to lose completely. Crypto allocation should be sized as high-risk, high-reward portion of diversified portfolio. Consider consulting a financial professional and understand the technology and risks before investing.
All cryptocurrency investing involves substantial risk of loss.
✨ Join the Discussion:
Are you accumulating Ethereum at these levels? How do you approach spot crypto allocation in your portfolio? Share your perspective in the comments.
📜 Buy structure. Think in cycles. Hold with conviction.

#ETH/USDT (1h) (spot)#ETH
The price is moving in a descending channel on the 1-hour timeframe. It has reached the lower boundary and is heading towards a breakout, with a retest of the upper boundary expected.
We are seeing a bearish trend in the Relative Strength Index (RSI), which has reached near the lower boundary, and an upward bounce is expected.
There is a key support zone in green at 2970, and the price has bounced from this level several times. Another bounce is expected.
We are seeing a trend towards stabilizing above the 100-period moving average, which we are approaching, supporting the upward trend.
Entry Price: 30019
First Target: 3058
Second Target: 3124
Third Target: 3202
Remember a simple principle: Money Management.
Place your stop-loss order below the green support zone.
For any questions, please leave a comment.
Thank you.

Ethereum Breaks Out – 3,050 Flipped to Support, TargetingETH/USD 15M – Quick TakeEthereum just broke out of the multi-day 2,950–3,050 range with strong volume and a clean retest of the breakout level as support. Price now accelerating above the key 3,050–3,060 resistance zone.Bullish as long as we hold above 3,050 on pullbacks → next targets 3,125 → 3,175–3,200.Only a fast drop and 15M/1H close back under 3,050 would invalidate and flip the structure bearish again.Momentum is finally back on the bulls’ side.#Ethereum #ETHUSD #Crypto #Breakout #BullishBias Not financial advice – trade at your own risk.

ETH USDHI GUYS
UPDATE ON ETH USD
I stopped providing scalp entries on every MOVE , for so many reasons one of them is to have a much clean chart. etc
This is what i expect around those areas on the RT H8, H4 CONTINUATION SELL PATH.
NOTE always follow btc for direction on all small stable coins

Ethereum - Another -30% correction!🥊Ethereum ( CRYPTO:ETHUSD ) continues the bearmarket:
🔎Analysis summary:
Just over the past couple of weeks, Ethereum has already been correcting about -40%. This happened due to another failed all time high breakout sending prices lower. And Ethereum can drop another -30% before it will then retest a major confluence of support.
📝Levels to watch:
$2,500 and $ 2,000
SwingTraderPhil
SwingTrading.Simplified. | Investing.Simplified. | #LONGTERMVISION

Ethereum (ETHUSD) – Momentum Shift in Progress?thereum just staged a strong rebound, signaling a potential momentum shift after months of bearish pressure.
🔄 Trend Development
After a sharp drop early last week, ETH quickly reversed and printed a higher low — a key early sign of bullish intent.
Shortly after, ETH broke above the previous week's high, marking the first higher-high and higher-low structure in months. While this happened in a tight time frame, it's a meaningful development from a price action perspective.
📉 Support & 📈 Resistance Levels
Support held strong in the $2,600 – $2,800 range
Immediate resistance now sits at $3,300
A breakout above $3,300 could trigger a move toward the upper boundary of the descending channel
However, we can't give the "all clear" just yet. A weekly close above $4,000 – $4,200 would be needed to confirm a full trend reversal and bullish continuation.

ETHUSD Daily Trade SetupIn this update we review the recent price action in Ethereum and identify the next high probability trading opportunties and price objectives to target. To review today's video analysis click here!

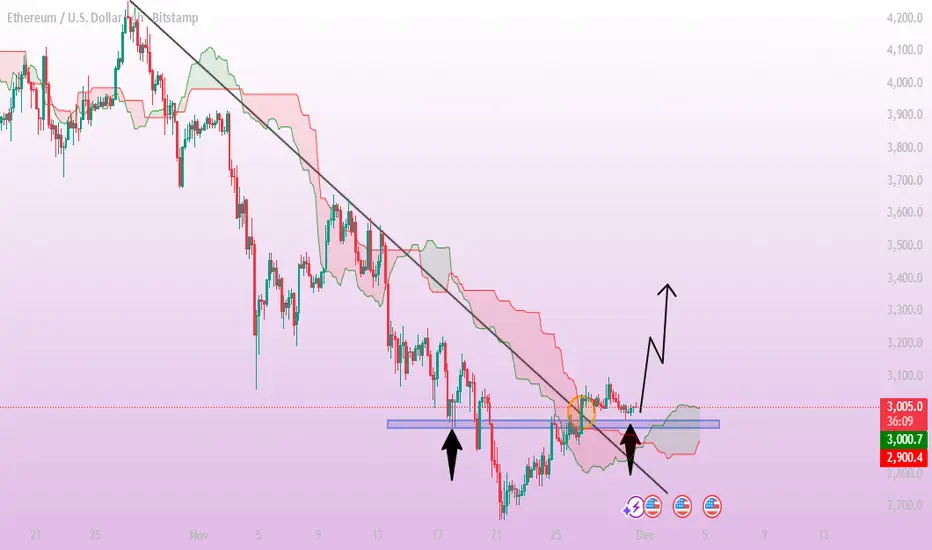
ETH/USD Long SetupThe Ethereum chart shows price moving above the downward trendline and stabilizing around a key zone marked on the chart. This area previously acted as an important level, and ETH is now holding above it, suggesting strength in the current structure. Price is also supported by the cloud, indicating a potential shift in momentum. If ETH continues to maintain stability above the highlighted zone, the next upward move may develop toward higher levels. Target 1 is 3,220, where the next significant price reaction is likely. If bullish momentum continues, Target 2 is 3,380, aligning with previous market structure and projected upward movement. Holding above 3,000 remains essential for confirming the upward outlook.
If you found this XAUUSD analysis helpful, don’t forget to LIKE 👍 and COMMENT 💬!
ETH PERPETUAL TRADE BUY SETUP Long from $3120ETH PERPETUAL TRADE
BUY SETUP
Long from $3120
Currently $3120
Targeting $3175 or Above
(Trading plan IF ETH
go down to $3060 will add more longs)
Follow the notes for updates
In the event of an early exit,
this analysis will be updated.
Its not a Financial advice

Ethereum: The Market’s Breath Finds a New RhythmEthereum: The Market’s Breath Finds a New Rhythm
The Technical Landscape
The previous short thesis played out beautifully, but the tide has shifted. ETHUSD now appears to be carving out a range, breathing in a slower rhythm. The chart suggests:
Entry: ~3150 (support zone)
Stop Loss: ~2580 (invalidates thesis)
Target: ~4280 (resistance zone)
Reward/Risk: ~2:1
The Philosophy
There are those who believe that if it cannot be measured, it does not exist. But what is an edge? It is not a number—it is a rhythm. Just as a child feels the wind without a ruler, a trader senses the flow without certainty. The market inhales, exhales, and now rests in a range. A limitless trader sees limitless opportunities.
An Illustrative Setup
The ultra-secret-super-duper-alpha-edge?
Buy at support.
Short at resistance.
Simple, but not easy. The first person who tells you the future is the easiest liar to spot. Trade the thesis, not the fantasy.
Disclaimer: This is not financial advice. It is for educational and informational purposes only. Please conduct your own research and manage your risk accordingly.
