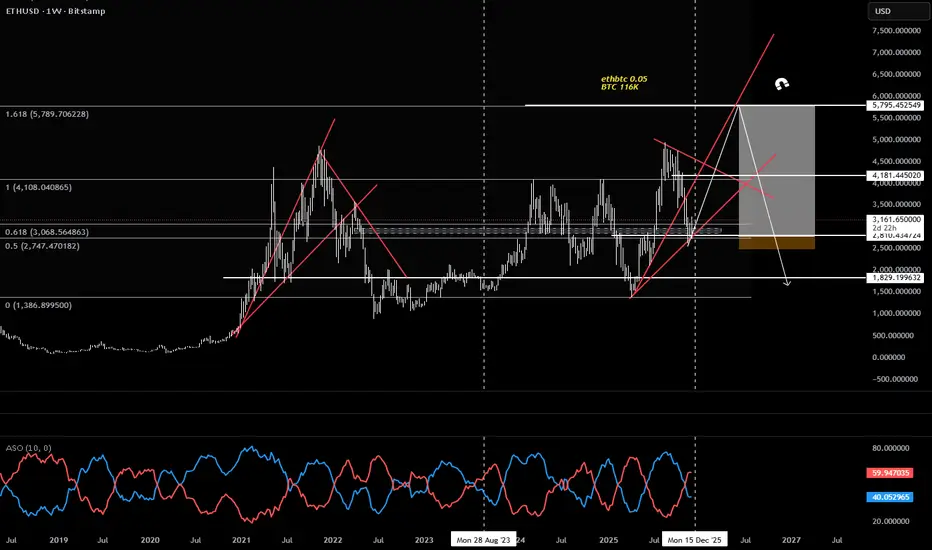
ETH Late Stage Bull Cycle Look at ethbtc reversal and breakout
Indicating ETH going to outperfrom BTC next 5 months
Which by all it means, late stage bull which will lead us to temporary bear market for BTC
ETHBTC 0.05
BTC 116K
ETH 5.8K
Trade ideas
ETH Take that Buy positionthe trend is going back bullish , you must be buying at this time , it's all about positionning to catch the trend

ETHUSD (30m) – Liquidity Trap & Bearish Continuation OutlookFX:EURUSD
Price has already cleared several liquidity points and broken a major descending trendline. As long as the structure remains intact and support holds, continuation toward the next premium level is likely.
Key Scenarios
✅ Bullish Case 🚀
If price retests and holds above 4,154 zone
→ 🎯 Target 1: 4,210
→ 🎯 Target 2: 4,250–4,270 major resistance
❌ Bearish Case 📉
Break and close below 4,129 invalidation zone
→ 🎯 Downside Target: 4,105–4,070
Current Levels to Watch
Resistance 🔴: 4,210 🡆 4,250–4,270
Support 🟢: 4,154 🡆 4,129 (invalidation)
Liquidity Swept: Prior highs cleared
⚠️ Disclaimer: This analysis is for educational purposes only — not financial advice

ETHUSD Long Setup — Potential Reversal After Liquidity SweepAfter an extended sell-off during the session, ETH formed a sharp liquidity sweep near the $2,720 – $2,730 zone, followed by a strong bullish reaction. Price has broken short-term structure to the upside and is now forming higher lows on the 15-minute timeframe.
📌 Entry: around $2,800
📌 Stop-loss: below the liquidity sweep zone (~$2,725)
📌 Take-profit: targeting $2,960 – $2,970 zone from previous imbalance / inefficiency
➕ Confluences
Rejection from higher-timeframe demand
Aggressive selling exhausted after liquidity grab
Bullish market structure shift (MSS) on M15
Increasing volume on upward candles
⚠️ What invalidates the setup?
A clean break below $2,725 with strong selling pressure would invalidate the reversal bias and open space for continuation to the downside.

ETH PERPETUAL TRADE BUY SETUP Long from $2790ETH PERPETUAL TRADE
BUY SETUP
Long from $2790
Currently $2790
Targeting $2845 or Above
(Trading plan IF ETH
go down to $2730 will add more longs)
Follow the notes for updates
In the event of an early exit,
this analysis will be updated.
Its not a Financial advice

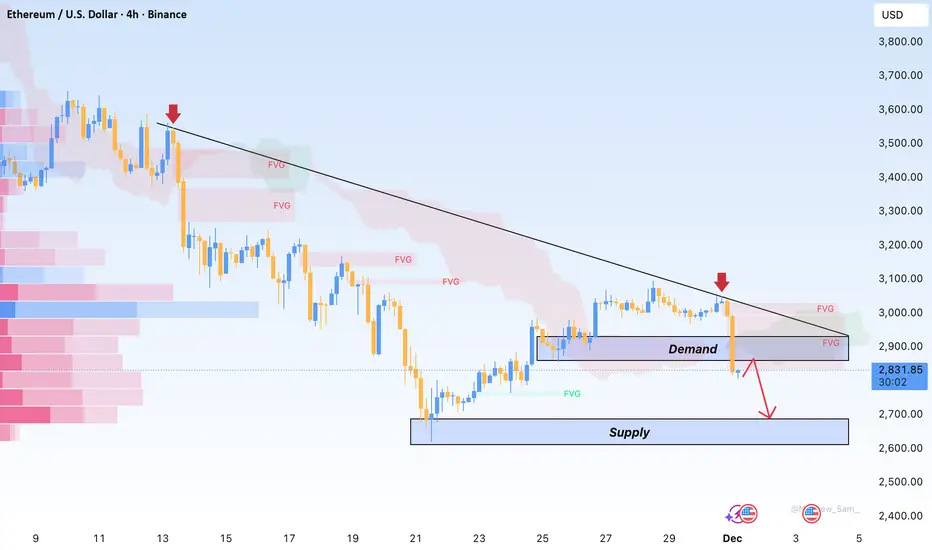
ETH Faces Heavy Rejection, Downside Risk IntensifiesETH printed a strong 4H bearish candle as soon as price retested the 3,030–3,100 supply zone, confirming that sellers still dominate this area. The sequence of lower highs remains intact, and the sharp break below 2,900 with increased volume signals a genuine sell-off rather than a routine shakeout.
Price is currently hovering around the 2,820–2,850 support, but buying interest is weak. The 2,750–2,780 pocket carries deeper liquidity and is a more realistic area for the market to stabilise if downward momentum continues.
Macro conditions also lean bearish: US yields are climbing, expectations for prolonged high rates from the Fed persist, regulatory pressure from the SEC remains, and whale flows to exchanges add further weight on crypto sentiment.
My view: ETH is more likely to slide toward 2,750–2,780 before any meaningful recovery. Only a 4H close above 3,030 would provide early signs of a short-term reversal.
eth taps athgm,
i'll keep this post short and sweet, straight to the point.
eth came down in 3 waves from the recent highs,
we swept the all time highs to catch all the short stops
and we shook out all the bulls after.
we've been consolidating beneath last cycles high for many years now,
and i believe we are getting ready to break out finally.
my upside target is pretty fluid, not attached to any particular number,
more interested in the wave structure itself.
somewhere around 8-10k is fair value,
maybe as high as 20k if we ignite some true momentum.
---
ps. if this post gets 5 likes, i will share my macro bull case on eth.

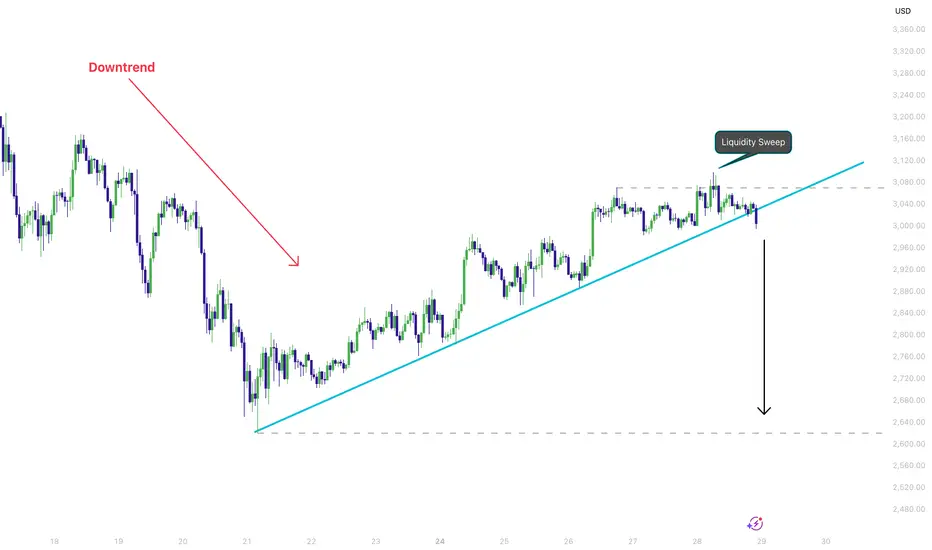
ETH Trendline Break After Liquidity Sweep – Watching 3080 → 2650ETH just broke beneath a clean ascending trendline that has held multiple reactions over the past several sessions. The most recent liquidity sweep around the 3080 level printed clear rejection, and the structure since that point has leaned progressively weaker.
With the trendline now broken, the chart opens room for ETH to revisit deeper inefficiencies, with the 2650 area standing out as the next major structural pocket. This aligns with the earlier 3080 sweep, which hinted at bearish intent before the break.
Key levels I’m watching:
• 3080 – prior liquidity sweep and rejection
• Trendline – now broken and potentially flipping into resistance
• 2600 zone – next major downside liquidity area
Not a trade signal, just sharing the technical structure I’m monitoring.
Etherium is following the bear marketetherium couldn't push any further , that to low market cap and the following syndrome to bitcoin , overall market sentiment is bearish on the higher time frame . it's a set a forget

ETHUSD - Inverted H&S An inverted H&S pattern forming with only the right shoulder yet to complete.
I expect following the right shoulder upward movement to come, not sure how much but it will be there.
Chart pattern analysis on this daily timeframe.
Alt season?

ETH Buy Signal: Heikin Ashi Bullish Reversal at Key SupportSTRATEGY SNAP: HEIKIN ASHI BULLISH SETUP
CHART SETUP:
· Asset: ETH/USDT
· Timeframe: 1 Hour - Optimal for swing entries
· Chart Type: Heikin Ashi - Clean trend identification
· Pattern: Bullish reversal at dynamic support
· Exchange: Binance - Reliable price data
📊 STRATEGY EXECUTION PLAN:
ENTRY: $3,000
· Precise level for position initiation
· Heikin Ashi candles showing bullish momentum shift
· Requires confirmation candle close above $3,000
RISK MANAGEMENT:
· Stop Loss: $2,970 (Below recent swing low)
· Risk Per Trade: ~1.0% from entry
· Position Sizing: Standard 1-2% portfolio risk
PROFIT TARGETS:
· Target 1: $3,020 (+0.67% return)
· Target 2: $3,050 (+1.67% return)
· Risk-Reward Ratio: 1:2.3 (Excellent)
🎓 TECHNICAL RATIONALE:
Why This Setup Works:
1. Heikin Ashi Advantage: Smoothed candles showing clear bullish momentum shift
2. Support Respect: Price holding above key psychological $3,000 level
3. Trend Alignment: Higher timeframe bias remains bullish
4. Volume Confirmation: Watch for increasing volume on breakout
Key Levels to Watch:
· Immediate Resistance: $3,020 (Target 1)
· Next Resistance: $3,050 (Target 2)
· Critical Support: $2,970 (Must hold for bullish case)
⚡ MY STRATEGY CRITERIA MET:
✅ Heikin Ashi bullish momentum confirmation
✅ Clear support level identification
✅ Defined risk management parameters
✅ Logical target projections
✅ Favorable risk-reward ratio
TRADE MANAGEMENT SUGGESTIONS:
· Consider partial profit booking at Target 1
· Move stop to breakeven at $3,010 once Target 1 reached
· Trail stop for remaining position to Target 2
· Monitor overall crypto market sentiment
EDUCATIONAL INSIGHT:
"Heikin Ashi charts are particularly effective for identifying smooth trend transitions and reducing market noise. The current setup shows a clear momentum shift from bearish to bullish consolidation."
---
🔔 FOLLOW for real-time strategy updates and more educational chart analysis!
#Ethereum #ETH #TradingStrategy #HeikinAshi #Crypto #TechnicalAnalysis #Binance #TradingView
⚠️ DISCLAIMER: I am not a financial advisor. This is educational market analysis demonstrating my personal trading strategy. NOT investment advice. Trade at your own risk. Past performance doesn't guarantee future results.

ETHUSD Next Move Analysis
Price is trading inside an ascending channel, but momentum is weakening near the upper trendline.
Market recently rejected near the target zone (around 3260–3300), showing selling pressure.
A breakdown of the channel support can trigger a short opportunity.
Short Entry Idea
Entry: After price breaks below channel support
Target 1: Support zone around 3050–3000
Target 2: Deeper support around 2900
Bearish Confirmation
Rejection from the upper zone
Break of channel + retest
Weak bullish candles turning into bearish structure


ETH Chart doesn't look prettyI see Ethereum’s chart not looking pretty for long nor hold positions at these prices.
Price Action
ETH continues to make lower highs and lower lows inside a descending wedge.
Price is moving toward two major demand zones, and the momentum is really weak. Just minor price hiccups.
I'm expecting some choppy or even consolidation movements before a possible test of the lower demand blocks.
OBV is such an underrated indicator!
Look at OBV, this is where the things gets interesting..
OBV is breaking its trendline downward, even while price hasn’t fully broken structure yet.
This is a classic sign of volume distribution. Smart money is exiting positions quietly.
When OBV breaks direction before price, it often predicts the next major move.
At the moment, ETHUSD is looking heavily bearish. Given the fact that BTC is also giving early signs of a bearish trend, I don't think buying ETH is a good idea here. I'll wait for a deeper correction.
Good Luck!

Ethereum Fake Breakout? Deep Drop After Hitting $4000After breaking above $4000, Ethereum boosted confidence among many holders — and a large number of traders entered right at that level.
But Bitcoin’s sharp drop triggered massive stop-loss hits across the market, revealing that the breakout was fake and most likely a stop-hunting move.
That’s why we saw such a deep correction.
I personally exited around $3800 with a small loss, and I shared the signal in the link below.
Even I was trapped by this fake breakout.
📉 Next support levels:
$2500
$1500
What’s your outlook?

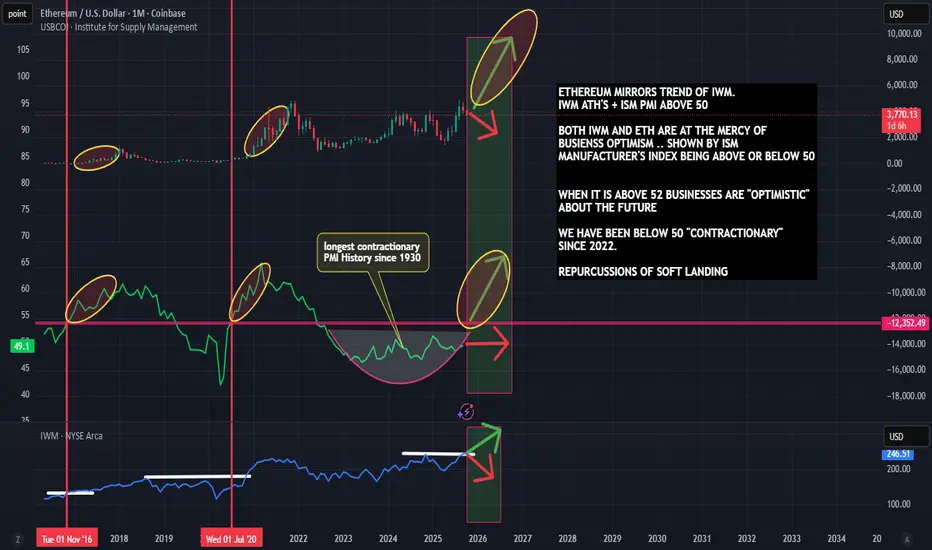
Ethereum Moves with The Business Cycle and Small Cap StocksThere's still hope for Ethereum and Altcoins into 2026
Why Altcoins Never Caught the Bull: The Missing Piece in the Crypto Cycle
Bitcoin, gold, and the S&P 500 (SPY) have long proven their close relationship with M2 money supply — when liquidity expands, they rise.
But Ethereum and the broader altcoin market play by a slightly different rulebook. They don’t just need liquidity… they need optimism.
Specifically, expanding small-cap stocks and a strong business sentiment environment.
Higher-risk assets — from growth stocks to altcoins — thrive when the economy believes in itself. And throughout this entire crypto cycle, that optimism never fully materialized.
Despite strong narratives, legal wins, and technological progress, altcoin expansions never sustained. Why? Because the business cycle is the true king of risk-taking.
🧭 Where to Watch: IWM & PMI
Two of the best gauges for this optimism are:
IWM (Russell 2000) – tracks small-cap stocks and risk appetite
ISM PMI – measures manufacturing activity and future order expectations
When the PMI is above 52, the economy is in expansion mode — and that’s historically when IWM hits new highs.
Interestingly, Ethereum has mirrored IWM’s trend, even showing outperformance when IWM pushes into all-time highs. That means ETH’s bullish potential could be closely tied to the next leg of small-cap and business expansion.
💡 The Takeaway
In the past, money supply (M2) and business optimism rose together.
Now, they’ve decoupled — giving us a clearer way to separate which catalyst drives which asset.
So, the big question:
👉 If business sentiment improves in 2026… does Ethereum finally get its real bull run?
Only time — and the next PMI reading — will tell.
ETHEREUM HIGH PROBABILITY LONG SETUP SOON!!!🚨 ETHER HIGH PROBABILITY BUY SETUP 🚨
* Here We Can See Clearly The Next Potential Moves For ETHUSD Coming Hours/Days.
* Keep Your Eyes Close On Your Trading Positions.
* Happy PIP Hunting Traders.
FXKILLA.

#ETH/USDT (1h) (spot)#ETH
The price is moving in a descending channel on the 1-hour timeframe. It has reached the lower boundary and is heading towards breaking above it, with a retest of the upper boundary expected.
We have a downtrend on the RSI indicator, which has reached near the lower boundary, and an upward rebound is expected.
There is a key support zone in green at the 2960 price level. The price has bounced from this zone multiple times and is expected to bounce again.
We have a trend towards stability above the 100-period moving average, as we are moving close to it, which supports the upward move.
Entry price: 3000
First target: 3033
Second target: 3080
Third target: 3140
Don't forget a simple principle: money management.
Place your stop-loss below the support zone in green.
For any questions, please leave a comment.
Thank you.

ETH - Hourly ChartT.A explained -
BackSide (BS)
FrontSide (FS)
Inverse BS (Inv.BS)
Inverse FS (Inv.FS)
BS & FS levels are expected support when dashed lines, tested when dotted and resistance when solid lines.
The inverse is true for the Inv. BS Inv. FS levels, they are resistance as dashed lines, tested as dotted and support as solid lines.
Monthly timeframe is color pink
weekly grey
daily is red
4hr is orange
1hr is yellow
15min is blue
5min is green if they are shown.
strength favors the higher timeframe.
2x dotted levels are origin levels where trends have or will originate. When trends break, price will target the origin of the trend. its math, when the trend breaks, the vertex breaks too so the higher timeframe level/trend that breaks, the more volatility there could be as strength in the orders flow in to fuel the move.

ETH/USD 4H Analysis: Testing Key ResistanceETH/USD 4H Analysis: Testing Key Resistance
• Significant Rally: Ethereum has staged a powerful recovery rally (marked by the recent green candles), bouncing sharply from the $2,850 Latest Support level and successfully breaking above the major downtrend line (red channel).
• Key Resistance Test: The immediate focus is a crucial test of the $3,000 Key Level (blue zone), which has acted as both support and resistance recently. A decisive close above $3,000 would solidify bullish momentum.
• Previous Downtrend: This bounce follows a sharp drop and rejection from the $3,200 previous support zone (teal zone), with the price previously confined by a macro downtrend (red channel) since mid-month.
• Next Targets: If the $3,000 level is reclaimed, the price will likely target the next resistance at the $3,200 Previous Support level, followed by the $3,350 Current Resistance (red zone). Failure to hold above $2,850 could lead to a retest of the $2,500 to $2,600 Current Support zone.

ETH BREAKOUT: DON’T MISS THE NEXT BIG MOVE!📌 ETH/USD MARKET ANALYSIS – 30M (Professional Trader Style)
1. Overall Market Structure
- Price has been consolidating inside a descending channel.
- Forming consistent lower highs – lower lows, but selling pressure is weakening near the demand zone.
- Finally, price created a rectangle compression and then broke out aggressively above the descending trendline.
2. Key Zones
✔ Demand Zone (Strong Support): 2980 – 3010
Multiple rejections + strong bullish reactions → buyers clearly defend this area.
✔ Supply Zone (Key Resistance): 3065 – 3090
Price is approaching this zone again, but momentum suggests a high probability of BREAKING THROUGH.
3. Breakout Confirmation
The breakout candle shows:
- Strong bullish body
- Increased volume
- Clear break of previous lower high → CHOCH (Change of Character)
This signals that ETH is transitioning from a correction phase into a renewed bullish trend.
4. Trading Plan (Price Action Style)
📌 Primary Scenario – BUY the Retest
Wait for price to pull back into the broken supply zone (now a demand flip) at 3065–3075.
Enter BUY when you see:
- Rejection wicks
- Bullish engulfing
- FVG reaction
- Or any PA confirmation
🎯 TP1: 3120
🎯 TP2: 3160
🎯 TP3: 3200+
⛔ SL: Below 3045 (below breakout structure)
5. Why This BUY Setup Is High Probability
✔ Clean breakout of the descending channel
✔ Strong momentum push (not a weak fake-out)
✔ Beautiful defense at demand zone
✔ Trendline tested 3 times → valid breakout
✔ Market structure shift from bearish → bullish
6. Pro Tips
Don’t FOMO buy the breakout candle
Wait for a clean retest for better R:R
Focus on zone reaction + CHOCH + bullish momentum
Stay patient. The market always rewards disciplined traders.

ETH BULLISHPlease don’t judge the set up lol I’m still learning. I’d love some constructive criticism cause I know I got a rookie setup but I am bullish on ETH.

ETHmas Tree...Oh, ETHmas Tree...Thy Candles are so Falling!!!What in the World is going on with ETH, you say??? Well, this is following our market structure almost to a T. See my previous posts on ETH to see how we got here and why the market is moving the way it is. This is Structural Market Making Moves, and has absolutely nothing to do with the News, Tariffs, Fed Reports, etc.
What just happened:
In the last look, we had an H1 BOS up that led us all the way back up to this H4 Supply Zone. Over the Thanksgiving Holiday and long weekend, the market tried to push up and break out of this zone. BUT...it is an H4 Supply zone, and as mentioned previously, there are a LOT of sellers waiting to sell their ETH here. After failing to overcome those sellers, we have seen the huge rejection expected.
What is significant about this move:
It is VERY important to note now that during all of this up and down over the weekend, and the ultimate failure to break any higher, we have gotten an H4 BOS Up from the lows....This H4 Supply Zone was broken with a closed H4 Candle. So, at this point we are looking for the market to push back down to the Source of that H4 BOS ~ (2680 - 2750). So, this huge fall we've just seen should take us back down to that area to retest and see IF the overall Fall from All Time Highs is finally over.
What to look for:
From here, we need to watch as we approach this H4 BOS Source and look for signs on the 15 min that the drop will end there. The H4 BOS could hold, but there is still the prevailing Weekly Demand Zone (~2150 - 2670) that is what is overall pulling the price down. So, this H4 BOS zone is the first attempt to see if the Weekly Zone is satisfied.
If this H4 BOS Zone holds and we do not get an H4 close below it, ETH could finally start to regain strength. Otherwise, if this H4 BOS Zone gets broken with an H4 close, then the weekly takes over again, and we're back to looking at the Weekly View. The Daily Source of that large weekly zone is still the target (~2150-2300).
